OPEN-SOURCE SCRIPT
Cập nhật Pearson Correlation [Mr_Rakun]
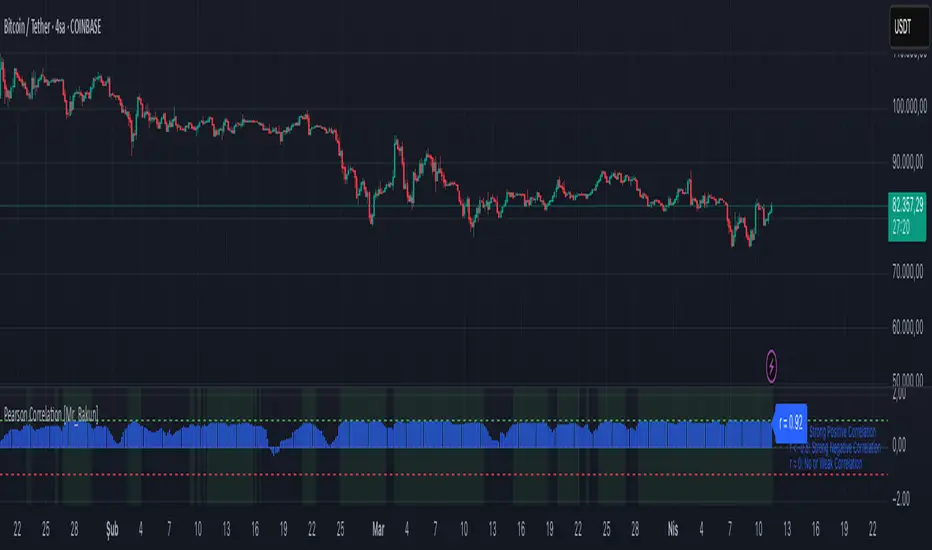
Pearson Correlation
This script calculates the Pearson correlation coefficient (r) between the closing price of the current asset and another selected asset.
🔍 How It Works:
• The user selects a correlation period (default: 20) and a symbol (default: ETH/USDT).
• The script retrieves the closing prices of both assets.
• The Pearson correlation formula is applied:
r = \frac{n(\sum xy) - (\sum x)(\sum y)}{\sqrt{[n\sum x^2 - (\sum x)^2][n\sum y^2 - (\sum y)^2]}}
• The correlation is plotted as a histogram:
• +1 (green line) → Perfect positive correlation
• -1 (red line) → Perfect negative correlation
• 0 (gray line) → No correlation
📊 Why Use This?
This indicator helps traders identify relationships between assets, such as whether two markets move together or inversely. It is useful for hedging strategies, portfolio diversification, and market comparisons.
Phát hành các Ghi chú
- InfoMã nguồn mở
Theo đúng tinh thần TradingView, tác giả của tập lệnh này đã công bố nó dưới dạng mã nguồn mở, để các nhà giao dịch có thể xem xét và xác minh chức năng. Chúc mừng tác giả! Mặc dù bạn có thể sử dụng miễn phí, hãy nhớ rằng việc công bố lại mã phải tuân theo Nội quy.
Thông báo miễn trừ trách nhiệm
Thông tin và các ấn phẩm này không nhằm mục đích, và không cấu thành, lời khuyên hoặc khuyến nghị về tài chính, đầu tư, giao dịch hay các loại khác do TradingView cung cấp hoặc xác nhận. Đọc thêm tại Điều khoản Sử dụng.
Mã nguồn mở
Theo đúng tinh thần TradingView, tác giả của tập lệnh này đã công bố nó dưới dạng mã nguồn mở, để các nhà giao dịch có thể xem xét và xác minh chức năng. Chúc mừng tác giả! Mặc dù bạn có thể sử dụng miễn phí, hãy nhớ rằng việc công bố lại mã phải tuân theo Nội quy.
Thông báo miễn trừ trách nhiệm
Thông tin và các ấn phẩm này không nhằm mục đích, và không cấu thành, lời khuyên hoặc khuyến nghị về tài chính, đầu tư, giao dịch hay các loại khác do TradingView cung cấp hoặc xác nhận. Đọc thêm tại Điều khoản Sử dụng.