OPEN-SOURCE SCRIPT
Morning & Evening Star
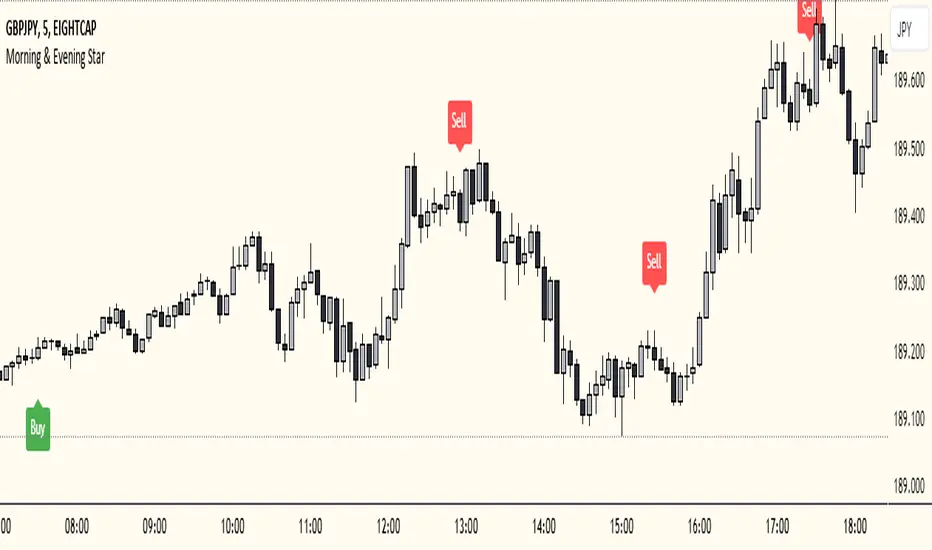
This Pine Script code is designed to identify Morning Star and Evening Star candlestick patterns on a chart. Here's how it works:
Calculate Candle Body and Wick Sizes: The script calculates the size of the candle body and wick based on the difference between the close and open prices, as well as the difference between the high and the maximum of the close and open prices.
Determine if the Candle is a Doji: It checks if the candle is a doji by comparing the size of the body to a fraction of the wick size. If the body size is less than or equal to 20% of the wick size, it is considered a doji.
Determine if the Current Candle is Bullish or Bearish: It checks if the current candle is bullish (close price is higher than open price) or bearish (close price is lower than open price).
Plot Shapes for Doji and Candles: It plots shapes on the chart to indicate buy and sell signals based on the presence of a doji and the formation of Morning Star or Evening Star patterns. These shapes are displayed below (for buy signals) or above (for sell signals) the respective candlesticks.
Combine this indicator with my support and resistance zones indicator for better results
Mã nguồn mở
Theo đúng tinh thần TradingView, tác giả của tập lệnh này đã công bố nó dưới dạng mã nguồn mở, để các nhà giao dịch có thể xem xét và xác minh chức năng. Chúc mừng tác giả! Mặc dù bạn có thể sử dụng miễn phí, hãy nhớ rằng việc công bố lại mã phải tuân theo Nội Quy.
Thông báo miễn trừ trách nhiệm
Thông tin và các ấn phẩm này không nhằm mục đích, và không cấu thành, lời khuyên hoặc khuyến nghị về tài chính, đầu tư, giao dịch hay các loại khác do TradingView cung cấp hoặc xác nhận. Đọc thêm tại Điều khoản Sử dụng.