OPEN-SOURCE SCRIPT
Cập nhật Histogram (MACD) with Divergences
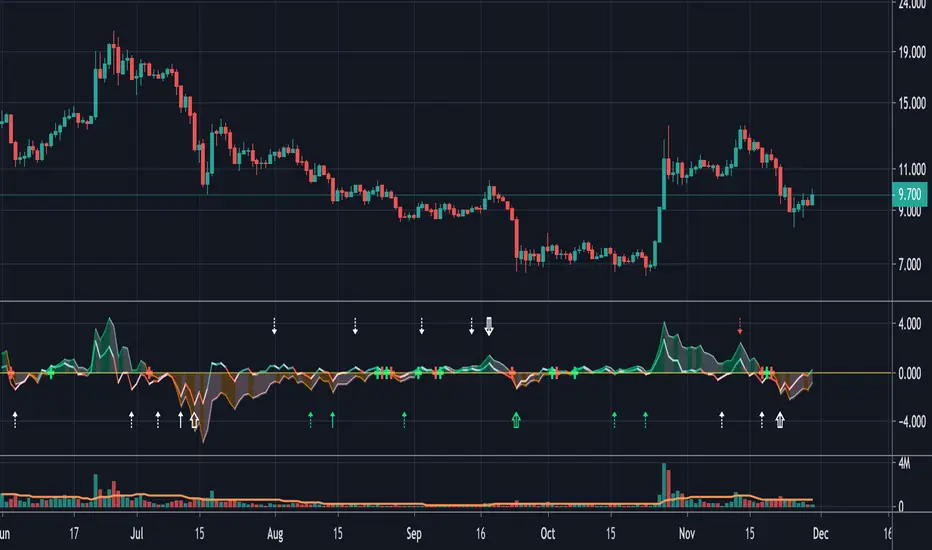
The focus with this MACD plot is solely towards the Histogram.
MACD & Signal can be made visible, but is made invisible by default.
The brighter line (green-red) is derived from the 'usual' MACD, the initial settings are completely different though:
- Fast Length 1
- 'Slow' Length 7
This is Histogram (1)
When this line crosses the 0 - line, this can give a nice early BUY - SELL sign,
especially combined with the 2nd Histogram, which uses a Slow Length of 49.
This latter Histogram (2) is filled ("Area") with a green/orange colour.
When Histogram (2) cross the 0 - line, this is visible as a green/red 'Cross'
These "Crosses", compared with the candles, gives possible/probable Support/Resistance lines.
Example,
if you bought on 5 March (Green Cross), and sold on 14 July, you'd have a nice profit!

A nice green area filled Histogram (2) (above 0 - line) can be considered as very Bullish,
an orange area filled Histogram (2) (below 0 - line) can be considered as Bearish.
Histogram (1) line can be used for shorter term Buy - Sell trades, the larger Bullish/Bearish Trend (of Histogram (2)) taking into account!
(see yellow dotted lines on the image).
All this is combined with a "Divergence" plot (with thanks to "Coingrats" (and "BabyWhale83") for the hard work!)
The small, more bright Triangles are triggered by Histogram (1)
The larger Triangles are triggered by Histogram (2)
- Green Triangles are Bullish Divergences
- Red Triangles are Bearish Divergences
- White Triangles (pointing upwards/downwards) are Bullish/Bearish Hidden Divergences
Very importantly, always combine the Divergence Triangles with another tool for confirmation, for example a MACD or RSI which produced an extra confirmation.
The movement of Histogram (2) above or below the 0 - line can be a confirmation as well.
As default these 3 options are enabled (for me this gives better results):
Simple MA (Oscillator)
Simple MA (Signal Line)
Simple MA (Signal Line 2)
This indicator can be used with normal "Candles", "Line", or "Heikin Ashi" (gives some differences)
Hope this is original and helpful!
MACD & Signal can be made visible, but is made invisible by default.
The brighter line (green-red) is derived from the 'usual' MACD, the initial settings are completely different though:
- Fast Length 1
- 'Slow' Length 7
This is Histogram (1)
When this line crosses the 0 - line, this can give a nice early BUY - SELL sign,
especially combined with the 2nd Histogram, which uses a Slow Length of 49.
This latter Histogram (2) is filled ("Area") with a green/orange colour.
When Histogram (2) cross the 0 - line, this is visible as a green/red 'Cross'
These "Crosses", compared with the candles, gives possible/probable Support/Resistance lines.
Example,
if you bought on 5 March (Green Cross), and sold on 14 July, you'd have a nice profit!
A nice green area filled Histogram (2) (above 0 - line) can be considered as very Bullish,
an orange area filled Histogram (2) (below 0 - line) can be considered as Bearish.
Histogram (1) line can be used for shorter term Buy - Sell trades, the larger Bullish/Bearish Trend (of Histogram (2)) taking into account!
(see yellow dotted lines on the image).
All this is combined with a "Divergence" plot (with thanks to "Coingrats" (and "BabyWhale83") for the hard work!)
The small, more bright Triangles are triggered by Histogram (1)
The larger Triangles are triggered by Histogram (2)
- Green Triangles are Bullish Divergences
- Red Triangles are Bearish Divergences
- White Triangles (pointing upwards/downwards) are Bullish/Bearish Hidden Divergences
Very importantly, always combine the Divergence Triangles with another tool for confirmation, for example a MACD or RSI which produced an extra confirmation.
The movement of Histogram (2) above or below the 0 - line can be a confirmation as well.
As default these 3 options are enabled (for me this gives better results):
Simple MA (Oscillator)
Simple MA (Signal Line)
Simple MA (Signal Line 2)
This indicator can be used with normal "Candles", "Line", or "Heikin Ashi" (gives some differences)
Hope this is original and helpful!
Phát hành các Ghi chú
- Used my updated Divergences (Pivots)- fixed small errors
- Settings made more clear
- more info between script
Phát hành các Ghi chú
- Added my "Divergences (Pivots)" (PivDiv 3)Different options for Divergences:
- 'Long Period', default checks 25 bars to the Left (="History") and 1 bar to the Right (="Future")
- 'Medium Period', default checks 15 bars to the Left (="History") and 1 bar to the Right (="Future")
- 'Short Period', default checks 5 bars to the Left (="History") and 1 bar to the Right (="Future")
Each Bar checks an amount of Bars at the Left (="History") and Bars to the Right (="Future"), insuring this particular Bar is the Highest or Lowest of them all at "close",
this is compared to the or or and so we have our Divergences.
There is always a slight delay (number of Bar(s) at the Right side (="Future")
> You can alter both sides in a way that suits you best
If you like a setting, where the amount of “RightBars” equals the ”LeftBars” you can enable the " > Only change 'LeftBars'" button.
Then you only have to adjust the amount of “LeftBars” and the amount of “RightBars” automatically will be the same.
- Sensitivity Divergences, default x = '5'
x ⩾ 2 compares the value with ⩾ 2 previous values instead of 1, making the sensitivity higher
Bullish divergences are "Green":
- "⇡︎" = 'Short' "period"
- "↑︎" = 'Medium' "period"
- "⇧" = 'Long' "period"
Bearish divergences are "Red"
- "⇣︎" = 'Short' "period"
- "↓︎" = 'Medium' "period"
- "⇩︎" = 'Long' "period"
Hidden Bullish divergences are "White":
- "⇡︎" = 'Short' "period"
- "↑︎" = 'Medium' "period"
- "⇧" = 'Long' "period"
Hidden Bearish divergences are "White"
- "⇣︎" = 'Short' "period"
- "↓︎" = 'Medium' "period"
- "⇩︎" = 'Long' "period"
While evaluating be sure to check other time frames as well!
- Added Alerts
Thank you!
Mã nguồn mở
Theo đúng tinh thần TradingView, tác giả của tập lệnh này đã công bố nó dưới dạng mã nguồn mở, để các nhà giao dịch có thể xem xét và xác minh chức năng. Chúc mừng tác giả! Mặc dù bạn có thể sử dụng miễn phí, hãy nhớ rằng việc công bố lại mã phải tuân theo Nội quy.
Who are PineCoders?
tradingview.com/chart/SSP/yW5eOqtm-Who-are-PineCoders/
TG Pine Script® Q&A: t.me/PineCodersQA
- We cannot control our emotions,
but we can control our keyboard -
tradingview.com/chart/SSP/yW5eOqtm-Who-are-PineCoders/
TG Pine Script® Q&A: t.me/PineCodersQA
- We cannot control our emotions,
but we can control our keyboard -
Thông báo miễn trừ trách nhiệm
Thông tin và các ấn phẩm này không nhằm mục đích, và không cấu thành, lời khuyên hoặc khuyến nghị về tài chính, đầu tư, giao dịch hay các loại khác do TradingView cung cấp hoặc xác nhận. Đọc thêm tại Điều khoản Sử dụng.