OPEN-SOURCE SCRIPT
Cập nhật Dynamic Momentum Bands | AlphaAlgos
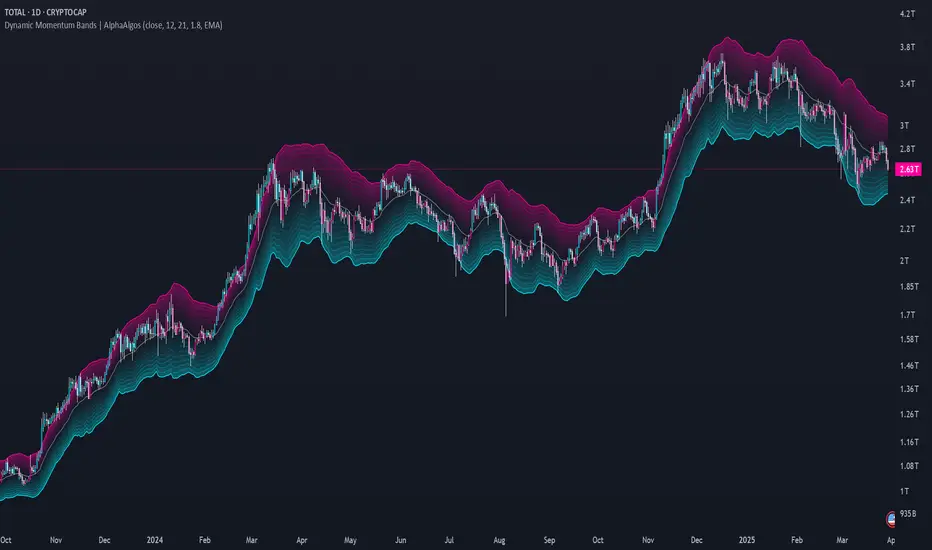
Dynamic Momentum Bands | AlphaAlgos
Overview
The Dynamic Momentum Bands indicator is an advanced technical analysis tool that combines multiple analytical techniques to provide a comprehensive view of market momentum and trend dynamics. By integrating RSI (Relative Strength Index), volatility analysis, and adaptive moving averages, this indicator offers traders a nuanced perspective on market conditions.
Key Features
Technical Methodology
The indicator employs a sophisticated approach to market analysis:
1. Momentum Calculation
2. Band Construction
Configuration Options
Core Settings:
Visual Settings:
Trend Identification
The indicator provides trend insights through:
Trading Applications
Trend Following:
- Use band position relative to price as trend indicator
- Identify momentum shifts through color changes
- Utilize gradient zones for trend strength assessment
Volatility Analysis:
Best Practices
This indicator is provided for informational purposes only. Always use proper risk management when trading. Past performance is not indicative of future results. Not financial Advise
Overview
The Dynamic Momentum Bands indicator is an advanced technical analysis tool that combines multiple analytical techniques to provide a comprehensive view of market momentum and trend dynamics. By integrating RSI (Relative Strength Index), volatility analysis, and adaptive moving averages, this indicator offers traders a nuanced perspective on market conditions.
Key Features
- Adaptive band calculation based on price momentum
- Integrated RSI-driven volatility scaling
- Multiple moving average type options (EMA, SMA, VWMA)
- Smooth, gradient-based band visualization
- Optional price bar coloring for trend identification
Technical Methodology
The indicator employs a sophisticated approach to market analysis:
1. Momentum Calculation
- Calculates RSI using a customizable length
- Uses RSI to dynamically adjust band volatility
- Scales band width based on distance from the 50 RSI level
2. Band Construction
- Applies a selected moving average type to the price source
- Calculates deviation using ATR (Average True Range)
- Smooths band edges for improved visual clarity
Configuration Options
Core Settings:
- Price Source: Choose the price data used for calculations
- RSI Length: Customize the RSI calculation period (1-50)
- Band Length: Adjust the moving average period (5-100)
- Volatility Multiplier: Fine-tune band width
- Band Type: Select between EMA, SMA, and VWMA
Visual Settings:
- Bar Coloring: Toggle color-coded price bars
- Gradient-based band visualization
- Smooth color transitions for trend representation
Trend Identification
The indicator provides trend insights through:
- Color-coded bands (blue for bullish, pink for bearish)
- Smooth gradient visualization
- Optional price bar coloring
Trading Applications
Trend Following:
- Use band position relative to price as trend indicator
- Identify momentum shifts through color changes
- Utilize gradient zones for trend strength assessment
Volatility Analysis:
- Observe band width changes
- Detect potential breakout or consolidation periods
- Use RSI-driven volatility scaling for market context
Best Practices
- Adjust RSI length to match trading timeframe
- Experiment with different moving average types
- Use in conjunction with other technical indicators
- Consider volatility multiplier for different market conditions
This indicator is provided for informational purposes only. Always use proper risk management when trading. Past performance is not indicative of future results. Not financial Advise
Phát hành các Ghi chú
Update to UI ColoringMã nguồn mở
Theo đúng tinh thần TradingView, tác giả của tập lệnh này đã công bố nó dưới dạng mã nguồn mở, để các nhà giao dịch có thể xem xét và xác minh chức năng. Chúc mừng tác giả! Mặc dù bạn có thể sử dụng miễn phí, hãy nhớ rằng việc công bố lại mã phải tuân theo Nội quy.
Thông báo miễn trừ trách nhiệm
Thông tin và các ấn phẩm này không nhằm mục đích, và không cấu thành, lời khuyên hoặc khuyến nghị về tài chính, đầu tư, giao dịch hay các loại khác do TradingView cung cấp hoặc xác nhận. Đọc thêm tại Điều khoản Sử dụng.
Mã nguồn mở
Theo đúng tinh thần TradingView, tác giả của tập lệnh này đã công bố nó dưới dạng mã nguồn mở, để các nhà giao dịch có thể xem xét và xác minh chức năng. Chúc mừng tác giả! Mặc dù bạn có thể sử dụng miễn phí, hãy nhớ rằng việc công bố lại mã phải tuân theo Nội quy.
Thông báo miễn trừ trách nhiệm
Thông tin và các ấn phẩm này không nhằm mục đích, và không cấu thành, lời khuyên hoặc khuyến nghị về tài chính, đầu tư, giao dịch hay các loại khác do TradingView cung cấp hoặc xác nhận. Đọc thêm tại Điều khoản Sử dụng.