OPEN-SOURCE SCRIPT
US Treasuries Yield Curve
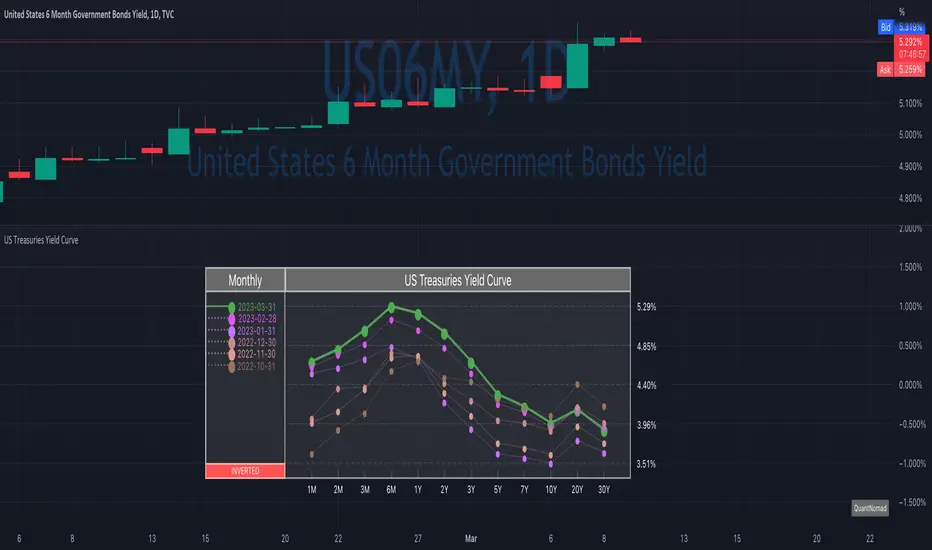
News about the yield curve became pretty crucial for all the trades in the last year.
So in the team, we decided to implement a nice widget that will allow you to track the current yield curve in your chart directly.
It's possible to compare the current yield curve with past yield curves. You can choose to display the number of curves weeks, months, and years ago. So you can see the dynamics of the yield curve change.
When the Y2 > Y10 curve is considered invested, so you'll see an "Inverted" notification on the chart.
Thanks to MUQWISHI for helping code it.
Disclaimer
Please remember that past performance may not indicate future results.
Due to various factors, including changing market conditions, the strategy may no longer perform as well as in historical backtesting.
This post and the script don’t provide any financial advice.
Mã nguồn mở
Theo đúng tinh thần TradingView, tác giả của tập lệnh này đã công bố nó dưới dạng mã nguồn mở, để các nhà giao dịch có thể xem xét và xác minh chức năng. Chúc mừng tác giả! Mặc dù bạn có thể sử dụng miễn phí, hãy nhớ rằng việc công bố lại mã phải tuân theo Nội quy.
Quant Developer | Pine Script v6 | Python & R
12+ yrs system. trading, hedge fund experience
Custom indicators, strategies & screeners
Futures & options
💼 Hire/Consulting:
qntly.com/hire
🎓 PineScript V6 Course:
qntly.com/ps6
12+ yrs system. trading, hedge fund experience
Custom indicators, strategies & screeners
Futures & options
💼 Hire/Consulting:
qntly.com/hire
🎓 PineScript V6 Course:
qntly.com/ps6
Thông báo miễn trừ trách nhiệm
Thông tin và các ấn phẩm này không nhằm mục đích, và không cấu thành, lời khuyên hoặc khuyến nghị về tài chính, đầu tư, giao dịch hay các loại khác do TradingView cung cấp hoặc xác nhận. Đọc thêm tại Điều khoản Sử dụng.