OPEN-SOURCE SCRIPT
MACD with Candle Display
MACD Calculation:
Uses user-defined Fast Length, Slow Length, and Signal Smoothing parameters to compute MACD.
Supports SMA (Simple Moving Average) or EMA (Exponential Moving Average) for the MACD line and signal line
Histogram-Based Candle Coloring:
The script categorizes histogram bars into four states:
0 (Very Bullish) → Green
1 (Likely Bearish) → Blue
2 (Likely Bullish) → Orange
3 (Very Bearish) → Red
Histogram Plot:
Displays histogram bars with distinct colors based on price momentum changes.
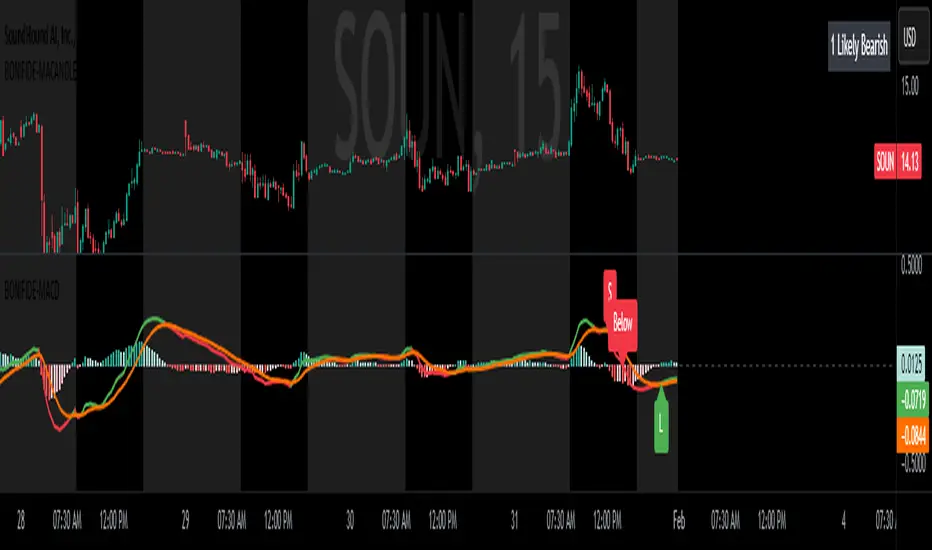
Market Sentiment Display in Status Line & Price Scale:
Instead of adding a label on the chart (which could obstruct candles), a text display is shown in the price scale and status line:
"0 Very Bullish"
"1 Likely Bearish"
"2 Likely Bullish"
"3 Very Bearish"
The text appears in the top-right corner with white font on a black background.
Purpose:
This indicator enhances the standard MACD by incorporating candle coloring and a cleaner sentiment display in the price scale, helping traders quickly interpret market momentum without cluttering the chart.
Uses user-defined Fast Length, Slow Length, and Signal Smoothing parameters to compute MACD.
Supports SMA (Simple Moving Average) or EMA (Exponential Moving Average) for the MACD line and signal line
Histogram-Based Candle Coloring:
The script categorizes histogram bars into four states:
0 (Very Bullish) → Green
1 (Likely Bearish) → Blue
2 (Likely Bullish) → Orange
3 (Very Bearish) → Red
Histogram Plot:
Displays histogram bars with distinct colors based on price momentum changes.
Market Sentiment Display in Status Line & Price Scale:
Instead of adding a label on the chart (which could obstruct candles), a text display is shown in the price scale and status line:
"0 Very Bullish"
"1 Likely Bearish"
"2 Likely Bullish"
"3 Very Bearish"
The text appears in the top-right corner with white font on a black background.
Purpose:
This indicator enhances the standard MACD by incorporating candle coloring and a cleaner sentiment display in the price scale, helping traders quickly interpret market momentum without cluttering the chart.
Mã nguồn mở
Theo đúng tinh thần TradingView, tác giả của tập lệnh này đã công bố nó dưới dạng mã nguồn mở, để các nhà giao dịch có thể xem xét và xác minh chức năng. Chúc mừng tác giả! Mặc dù bạn có thể sử dụng miễn phí, hãy nhớ rằng việc công bố lại mã phải tuân theo Nội quy.
Thông báo miễn trừ trách nhiệm
Thông tin và các ấn phẩm này không nhằm mục đích, và không cấu thành, lời khuyên hoặc khuyến nghị về tài chính, đầu tư, giao dịch hay các loại khác do TradingView cung cấp hoặc xác nhận. Đọc thêm tại Điều khoản Sử dụng.