OPEN-SOURCE SCRIPT
US 10Y - US 2Y Spread
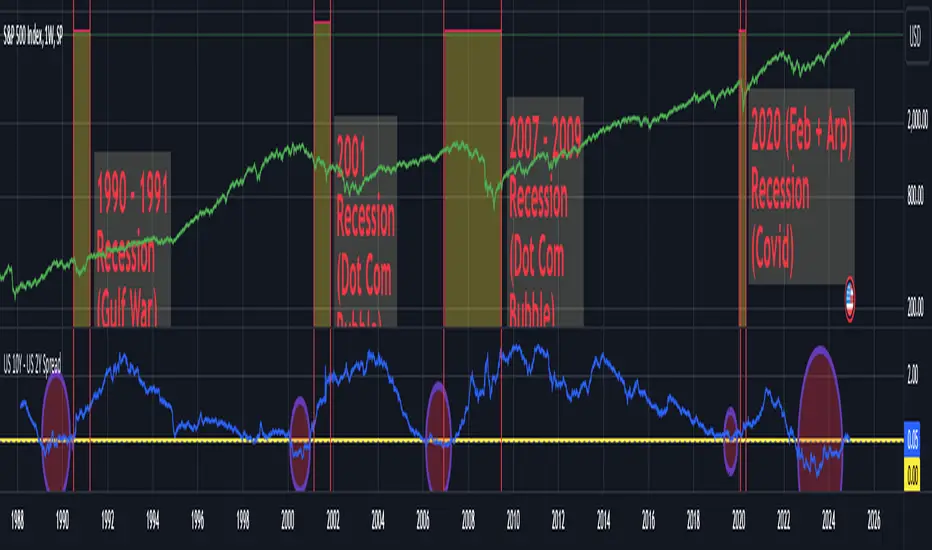
This script displays the Yield Spread between the 10 Year US Treasury Bond (US10Y) and the 2 Year US Treasury Bond (US02Y) as a blue line beneath the chart. It is best to be used on weekly charts a the yield spread is a leading indicator used for detecting possible recessions within the US economy.
A negative yield spread means the 2 year treasury bonds are paying a higher yield than 10 year treasury bonds indicating a possible slowdown of the US economy. In the past negative yield spreads where often followed by recessions and major corrections of the S&P500... you can see examples for this on the above chart for the Gulf War recession, the DotCom Bubble recession, the great recession due to the US housing market collapse and the short COVID recession.
Currently we are in an extended phase of negative yield spreads and if history repeats itself we could be in for a major correction on the financial markets within the next years.
Mã nguồn mở
Theo đúng tinh thần TradingView, tác giả của tập lệnh này đã công bố nó dưới dạng mã nguồn mở, để các nhà giao dịch có thể xem xét và xác minh chức năng. Chúc mừng tác giả! Mặc dù bạn có thể sử dụng miễn phí, hãy nhớ rằng việc công bố lại mã phải tuân theo Nội quy.
Thông báo miễn trừ trách nhiệm
Thông tin và các ấn phẩm này không nhằm mục đích, và không cấu thành, lời khuyên hoặc khuyến nghị về tài chính, đầu tư, giao dịch hay các loại khác do TradingView cung cấp hoặc xác nhận. Đọc thêm tại Điều khoản Sử dụng.