CISD & OB [BLAZ]Version 1.0 – Published October 2025: Initial release
1. Overview & Purpose
The CISD & OB indicator identifies and plots Order Blocks (OB) and Changes in State of Delivery (CISD) on price charts using a strict rule-based approach designed to highlight structural turning points and continuation zones in price action. It automatically detects these formations when price creates confirmed swing highs or lows, followed by opposing directional moves that break predefined structural levels.
Detection logic is consistently applied across all market conditions, allowing the indicator to identify areas where notable price reactions or liquidity shifts have occurred. These levels are plotted as horizontal lines on the chart and are updated in real time to reflect the latest structural developments, helping traders visualise potential reversal or continuation zones.
The methodology used in this indicator represents the author's specific approach to Order Block and CISD identification, incorporating custom criteria for swing validation and confirmation logic that differ from standard implementations. Detection operates entirely mechanically, without discretionary intervention, to ensure consistency and objectivity across use cases. This indicator functions on all standard timeframes and supports multiple asset classes, including Forex, Stocks, Cryptocurrencies, Futures, and Commodities.
The indicator is unique in its ability to apply detection logic to a custom timeframe, enabling multi-timeframe structural analysis without switching charts. Let’s begin by explaining key terminologies based on the author’s perception to aid in understanding the functionality of the indicator.
2. Order Block (OB)
An Order Block is identified when price creates a swing high or swing low followed by a directional move that closes beyond the open of the opposing candle(s) structure.
2.1. For bearish Order Blocks:
Price must form a confirmed swing high (higher than surrounding candles).
A subsequent bearish candle must close below the open of the bullish candle(s) that created the swing high.
2.2. For bullish Order Blocks:
Price must form a confirmed swing low (lower than surrounding candles).
A subsequent bullish candle must close above the open of the bearish candle(s) that created the swing low.
The indicator only validates Order Blocks where the structural formation meets minimum swing criteria and the confirming move demonstrates sufficient momentum beyond the identified level.
3. Change in State of Delivery (CISD)
A CISD occurs when a valid Order Block forms in the opposite direction to the previously confirmed Order Block, indicating a potential shift in market structure.
3.1. Formation criteria:
A bullish CISD forms when a valid bullish Order Block is detected after the most recent confirmed structure was a bearish Order Block.
A bearish CISD forms when a valid bearish Order Block is detected after the most recent confirmed structure was a bullish Order Block.
Each CISD represents the first opposing Order Block in a sequence, distinguishing it from continuation Order Blocks that follow in the same direction.
The indicator tracks the sequence of Order Block formations to automatically classify each new structure as either a CISD (directional change) or continuation Order Block based on the preceding confirmed structure.
4. Detection Logic & Visual Management
The indicator continuously scans price action in real time, validating only those patterns that meet predefined technical thresholds. Once a structure is confirmed, it is plotted as a horizontal line extending from the origin candle’s open to the confirming close.
To maintain chart clarity, the script integrates automatic display management, limiting the number of plotted lines according to user-defined settings. Independent styling options are available for bullish and bearish structures, including colour, width, and line thickness. CISD and OB structures are styled separately to provide a clear distinction between reversal and continuation events.
Developing structures appear as dotted potential horizontal lines until they are validated, at which point they transition to solid lines. The indicator also allows users to restrict visibility of plotted lines above a selected timeframe, ensuring that higher timeframe charts remain clean and readable.
If configuration settings conflict, such as incompatible timeframe or visibility filters, the indicator displays on-chart warning messages to guide users in adjusting their setup appropriately.
The indicator supports multi-timeframe plotting capability, allowing structures identified on higher timeframes to be visualised directly on the active lower timeframe chart. This feature allows traders to observe how market structures align across multiple timeframes, providing greater confirmation of overall trend direction, reinforcing analytical confidence through cross‑timeframe confluence, and ensuring short‑term decisions remain aligned with the prevailing market context.
Traders can configure alerts to receive notifications when new CISD or OB structures are confirmed. Alerts are fully customisable via the indicator input settings and can be defined by direction (bullish/bearish) and pattern type (OB or CISD).
5. Usage Instructions
5.1. Alert Setup:
Enable "Set Alert?" toggle in indicator settings.
Configure alert preferences for specific pattern types.
On the chart, click the three dots menu beside the indicator's name or press Alt + A.
Select "Add Alert" and click “Create” to activate the alert.
Alerts trigger when new patterns are confirmed.
5.2. Display Controls:
Use "Bullish Lines" and "Bearish Lines" toggles to show/hide patterns by direction.
Adjust line quantity settings (1-25) to control how many patterns display simultaneously.
Enable “Timeframe” to apply detection logic to a higher timeframe of choice, displaying CISD and OB patterns directly on the active chart.
5.3. Visibility Filter:
Use “Show below” to limit indicator visibility to specific timeframes. When enabled, the indicator hides automatically on any timeframe equal to or higher than the selected setting.
5.4. Appearance Customisation:
Toggle “CISD” or “OB” on/off to show or hide individual pattern types.
Modify colours and line widths independently for bullish and bearish structures.
The “Show potential line” option displays developing patterns as dotted horizontal lines until confirmed.
5.5. Warning Message:
Enable “Show warning messages” to display on‑chart guidance for conflicting or invalid configurations.
Choose the preferred message box position and colour styling for readability.
6. Protected Logic & Original Design
This indicator has been developed from the ground up using proprietary algorithms and a custom structural classification logic derived from original research into Order Block and CISD identification methods. The internal mechanics, including real-time pre-confirmation logic, multi-timeframe adaptation, directional classification sequencing, and automated display management, are not based on any publicly available script or third-party resource.
7. Disclaimer
This indicator is provided for educational and analytical purposes only. It does not constitute financial advice, investment recommendations, or trading signals. All trading and investment decisions remain solely the responsibility of the user.
Trading financial instruments involves substantial risk of loss. Past performance of any trading methodology or indicator does not guarantee future results. Users should conduct their own research and consider consulting with qualified financial professionals before making trading decisions.
The indicator's pattern detection is based on technical analysis principles and should be used as part of a comprehensive trading approach. No trading tool can guarantee profitable outcomes or eliminate market risk.
By using this indicator, users acknowledge they understand these risks and accept full responsibility for their trading decisions and outcomes.
[b]forex

Session Breakout Detector (SBD)Overview:
The Session Breakout Detector (SBD) is a TradingView indicator designed to identify and visualize breakouts from major trading sessions. It tracks a selected session (Tokyo, London, or New York) and detects price movements beyond the session's high or low, assisting traders in spotting potential breakout opportunities.
Key Features:
- Session Selection: Choose between Tokyo, London, or New York sessions.
- Breakout Detection Modes:
- Confirmed Bar: Detects breakouts when a candle closes beyond the session's range.
- Intrabar: Detects breakouts as soon as the price exceeds the session's high or low within a
candle.
- Visual Indicators:
- Displays session high, low, and range with a colored box for clear visualization.
- Marks breakouts with green (bullish) or red (bearish) triangles.
- Optional 50-Period SMA: Adds a 50-period Simple Moving Average to the chart for trend
analysis.
- Alerts: Configurable alerts for bullish and bearish breakouts.
Usage Instructions:
1. Select Session: Choose the desired trading session (Tokyo, London, or New York) from the
input settings.
2. Choose Breakout Detection Mode: Select between 'By confirmed bar' or 'By intrabars' based
on your trading preference.
3. Enable SMA (Optional): Toggle the 'Use SMA?' option to display the 50-period Simple Moving
Average.
4. Set Alerts: Configure alerts for breakout signals as per your trading strategy.
⚠️Note: This indicator is intended for informational purposes only and should not be construed as financial advice. Users are encouraged to conduct their own research and consider their individual risk tolerance before making trading decisions.

Forex Session High/Low TrackerThis indicator maps out each Forex session along with their relative highs and lows.

TrendLock Pro 2 — Dual Trend Confirmation📊 TrendLock Pro 2 — Dual Trend Confirmation
🔒 Trade only when the trend is locked and confirmed
TrendLock Pro is a professional no-repaint indicator designed for traders who want to cut through market noise and only capture validated opportunities.
It combines two powerful filters:
TrendScope (current timeframe) → fast detection of momentum shifts through an intelligent RSI setup.
Flow Guard (higher timeframe) → directional filter that only confirms trades aligned with the macro trend.
👉 The result: you only enter when both trends agree , ensuring dual validation before every trade.
🚀 Key Features
✅ No Repaint : signals remain reliable once printed.
✅ Dual Validation : micro-trend (M1, M5…) confirmed by the macro-trend (M15, M30…).
✅ Smart Filters : reduces false signals against the main trend.
✅ Versatile : ideal for M1 scalping, intraday trading, or swing setups.
✅ Built-in Alerts : get notified only when confirmation is strong.
✅ Clear Visuals : green diamonds for confirmed LONGs, red diamonds for confirmed SHORTs.
🎯 Who is it for?
Scalpers seeking safer entries.
Day traders looking to avoid counter-trend traps.
Swing traders preferring cleaner, filtered setups.
💡 Usage Tips
📉 Using Heikin Ashi candles smooths signals and makes them easier to read.
🛡️ Always place your Stop Loss wisely: the indicator doesn’t predict the future but analyzes real-time multi-timeframe trends.
🎯 Avoid being too greedy with Take Profits — aim for balanced targets to maintain a strong win rate.
⚡ Two trends, one signal. Trade with confirmation.

Sessions [Trade Tribe HQ]Color-coded session ranges with ADR% labels to help you trade smarter, not harder.
This tool marks New York, London, Tokyo, and Sydney sessions, showing their ranges, highs/lows, VWAPs, and ADR%.
🔹 Key Features
Colored session boxes (NY, London, Tokyo, Sydney)
Session highs & lows, VWAP, and trendlines
Dashboard showing active sessions, volume, and %ADR
ADR% labels at session close
🔹 How It Helps
Spot session traps, moves, and reversals faster
Manage expectations using ADR% (no chasing over-extended moves)
Identify overlap zones (London → NY) for volatility spikes
Simplify cycle tracking across global markets
Market Sessions Marker—making it easy to see where the energy has been spent and where opportunity is building next.
Created with ❤️ by TraderChick – part of the Trade Tribe HQ community.
If you found this tool useful, check out my profile for more strategies, classes, and resources.

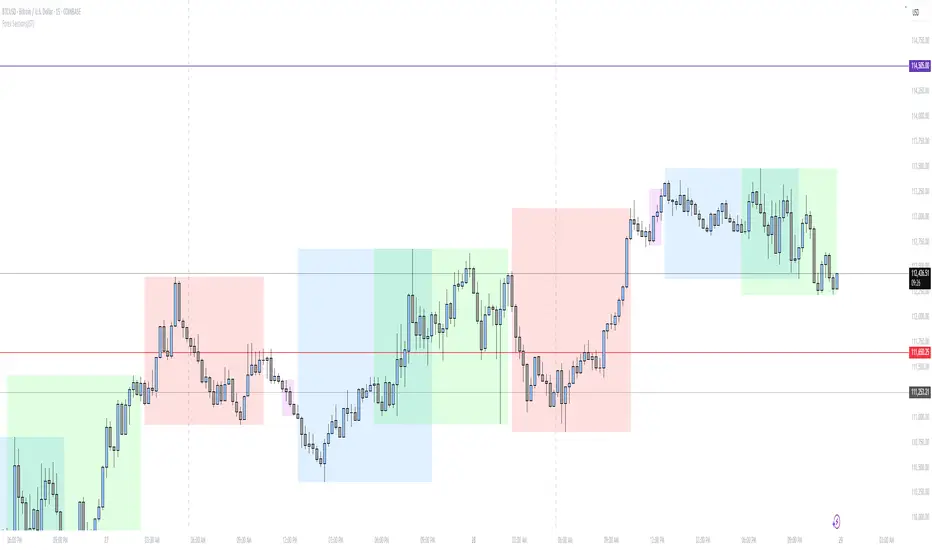
BOCS Channel Scalper Indicator - Mean Reversion Alert System# BOCS Channel Scalper Indicator - Mean Reversion Alert System
## WHAT THIS INDICATOR DOES:
This is a mean reversion trading indicator that identifies consolidation channels through volatility analysis and generates alert signals when price enters entry zones near channel boundaries. **This indicator version is designed for manual trading with comprehensive alert functionality.** Unlike automated strategies, this tool sends notifications (via popup, email, SMS, or webhook) when trading opportunities occur, allowing you to manually review and execute trades. The system assumes price will revert to the channel mean, identifying scalp opportunities as price reaches extremes and preparing to bounce back toward center.
## INDICATOR VS STRATEGY - KEY DISTINCTION:
**This is an INDICATOR with alerts, not an automated strategy.** It does not execute trades automatically. Instead, it:
- Displays visual signals on your chart when entry conditions are met
- Sends customizable alerts to your device/email when opportunities arise
- Shows TP/SL levels for reference but does not place orders
- Requires you to manually enter and exit positions based on signals
- Works with all TradingView subscription levels (alerts included on all plans)
**For automated trading with backtesting**, use the strategy version. For manual control with notifications, use this indicator version.
## ALERT CAPABILITIES:
This indicator includes four distinct alert conditions that can be configured independently:
**1. New Channel Formation Alert**
- Triggers when a fresh BOCS channel is identified
- Message: "New BOCS channel formed - potential scalp setup ready"
- Use this to prepare for upcoming trading opportunities
**2. Long Scalp Entry Alert**
- Fires when price touches the long entry zone
- Message includes current price, calculated TP, and SL levels
- Notification example: "LONG scalp signal at 24731.75 | TP: 24743.2 | SL: 24716.5"
**3. Short Scalp Entry Alert**
- Fires when price touches the short entry zone
- Message includes current price, calculated TP, and SL levels
- Notification example: "SHORT scalp signal at 24747.50 | TP: 24735.0 | SL: 24762.75"
**4. Any Entry Signal Alert**
- Combined alert for both long and short entries
- Use this if you want a single alert stream for all opportunities
- Message: "BOCS Scalp Entry: at "
**Setting Up Alerts:**
1. Add indicator to chart and configure settings
2. Click the Alert (⏰) button in TradingView toolbar
3. Select "BOCS Channel Scalper" from condition dropdown
4. Choose desired alert type (Long, Short, Any, or Channel Formation)
5. Set "Once Per Bar Close" to avoid false signals during bar formation
6. Configure delivery method (popup, email, webhook for automation platforms)
7. Save alert - it will fire automatically when conditions are met
**Alert Message Placeholders:**
Alerts use TradingView's dynamic placeholder system:
- {{ticker}} = Symbol name (e.g., NQ1!)
- {{close}} = Current price at signal
- {{plot_1}} = Calculated take profit level
- {{plot_2}} = Calculated stop loss level
These placeholders populate automatically, creating detailed notification messages without manual configuration.
## KEY DIFFERENCE FROM ORIGINAL BOCS:
**This indicator is designed for traders seeking higher trade frequency.** The original BOCS indicator trades breakouts OUTSIDE channels, waiting for price to escape consolidation before entering. This scalper version trades mean reversion INSIDE channels, entering when price reaches channel extremes and betting on a bounce back to center. The result is significantly more trading opportunities:
- **Original BOCS**: 1-3 signals per channel (only on breakout)
- **Scalper Indicator**: 5-15+ signals per channel (every touch of entry zones)
- **Trade Style**: Mean reversion vs trend following
- **Hold Time**: Seconds to minutes vs minutes to hours
- **Best Markets**: Ranging/choppy conditions vs trending breakouts
This makes the indicator ideal for active day traders who want continuous alert opportunities within consolidation zones rather than waiting for breakout confirmation. However, increased signal frequency also means higher potential commission costs and requires disciplined trade selection when acting on alerts.
## TECHNICAL METHODOLOGY:
### Price Normalization Process:
The indicator normalizes price data to create consistent volatility measurements across different instruments and price levels. It calculates the highest high and lowest low over a user-defined lookback period (default 100 bars). Current close price is normalized using: (close - lowest_low) / (highest_high - lowest_low), producing values between 0 and 1 for standardized volatility analysis.
### Volatility Detection:
A 14-period standard deviation is applied to the normalized price series to measure price deviation from the mean. Higher standard deviation values indicate volatility expansion; lower values indicate consolidation. The indicator uses ta.highestbars() and ta.lowestbars() to identify when volatility peaks and troughs occur over the detection period (default 14 bars).
### Channel Formation Logic:
When volatility crosses from a high level to a low level (ta.crossover(upper, lower)), a consolidation phase begins. The indicator tracks the highest and lowest prices during this period, which become the channel boundaries. Minimum duration of 10+ bars is required to filter out brief volatility spikes. Channels are rendered as box objects with defined upper and lower boundaries, with colored zones indicating entry areas.
### Entry Signal Generation:
The indicator uses immediate touch-based entry logic. Entry zones are defined as a percentage from channel edges (default 20%):
- **Long Entry Zone**: Bottom 20% of channel (bottomBound + channelRange × 0.2)
- **Short Entry Zone**: Top 20% of channel (topBound - channelRange × 0.2)
Long signals trigger when candle low touches or enters the long entry zone. Short signals trigger when candle high touches or enters the short entry zone. Visual markers (arrows and labels) appear on chart, and configured alerts fire immediately.
### Cooldown Filter:
An optional cooldown period (measured in bars) prevents alert spam by enforcing minimum spacing between consecutive signals. If cooldown is set to 3 bars, no new long alert will fire until 3 bars after the previous long signal. Long and short cooldowns are tracked independently, allowing both directions to signal within the same period.
### ATR Volatility Filter:
The indicator includes a multi-timeframe ATR filter to avoid alerts during low-volatility conditions. Using request.security(), it fetches ATR values from a specified timeframe (e.g., 1-minute ATR while viewing 5-minute charts). The filter compares current ATR to a user-defined minimum threshold:
- If ATR ≥ threshold: Alerts enabled
- If ATR < threshold: No alerts fire
This prevents notifications during dead zones where mean reversion is unreliable due to insufficient price movement. The ATR status is displayed in the info table with visual confirmation (✓ or ✗).
### Take Profit Calculation:
Two TP methods are available:
**Fixed Points Mode**:
- Long TP = Entry + (TP_Ticks × syminfo.mintick)
- Short TP = Entry - (TP_Ticks × syminfo.mintick)
**Channel Percentage Mode**:
- Long TP = Entry + (ChannelRange × TP_Percent)
- Short TP = Entry - (ChannelRange × TP_Percent)
Default 50% targets the channel midline, a natural mean reversion target. These levels are displayed as visual lines with labels and included in alert messages for reference when manually placing orders.
### Stop Loss Placement:
Stop losses are calculated just outside the channel boundary by a user-defined tick offset:
- Long SL = ChannelBottom - (SL_Offset_Ticks × syminfo.mintick)
- Short SL = ChannelTop + (SL_Offset_Ticks × syminfo.mintick)
This logic assumes channel breaks invalidate the mean reversion thesis. SL levels are displayed on chart and included in alert notifications as suggested stop placement.
### Channel Breakout Management:
Channels are removed when price closes more than 10 ticks outside boundaries. This tolerance prevents premature channel deletion from minor breaks or wicks, allowing the mean reversion setup to persist through small boundary violations.
## INPUT PARAMETERS:
### Channel Settings:
- **Nested Channels**: Allow multiple overlapping channels vs single channel
- **Normalization Length**: Lookback for high/low calculation (1-500, default 100)
- **Box Detection Length**: Period for volatility detection (1-100, default 14)
### Scalping Settings:
- **Enable Long Scalps**: Toggle long alert generation on/off
- **Enable Short Scalps**: Toggle short alert generation on/off
- **Entry Zone % from Edge**: Size of entry zone (5-50%, default 20%)
- **SL Offset (Ticks)**: Distance beyond channel for stop (1+, default 5)
- **Cooldown Period (Bars)**: Minimum spacing between alerts (0 = no cooldown)
### ATR Filter:
- **Enable ATR Filter**: Toggle volatility filter on/off
- **ATR Timeframe**: Source timeframe for ATR (1, 5, 15, 60 min, etc.)
- **ATR Length**: Smoothing period (1-100, default 14)
- **Min ATR Value**: Threshold for alert enablement (0.1+, default 10.0)
### Take Profit Settings:
- **TP Method**: Choose Fixed Points or % of Channel
- **TP Fixed (Ticks)**: Static distance in ticks (1+, default 30)
- **TP % of Channel**: Dynamic target as channel percentage (10-100%, default 50%)
### Appearance:
- **Show Entry Zones**: Toggle zone labels on channels
- **Show Info Table**: Display real-time indicator status
- **Table Position**: Corner placement (Top Left/Right, Bottom Left/Right)
- **Long Color**: Customize long signal color (default: darker green for readability)
- **Short Color**: Customize short signal color (default: red)
- **TP/SL Colors**: Customize take profit and stop loss line colors
- **Line Length**: Visual length of TP/SL reference lines (5-200 bars)
## VISUAL INDICATORS:
- **Channel boxes** with semi-transparent fill showing consolidation zones
- **Colored entry zones** labeled "LONG ZONE ▲" and "SHORT ZONE ▼"
- **Entry signal arrows** below/above bars marking long/short alerts
- **TP/SL reference lines** with emoji labels (⊕ Entry, 🎯 TP, 🛑 SL)
- **Info table** showing channel status, last signal, entry/TP/SL prices, risk/reward ratio, and ATR filter status
- **Visual confirmation** when alerts fire via on-chart markers synchronized with notifications
## HOW TO USE:
### For 1-3 Minute Scalping with Alerts (NQ/ES):
- ATR Timeframe: "1" (1-minute)
- ATR Min Value: 10.0 (for NQ), adjust per instrument
- Entry Zone %: 20-25%
- TP Method: Fixed Points, 20-40 ticks
- SL Offset: 5-10 ticks
- Cooldown: 2-3 bars to reduce alert spam
- **Alert Setup**: Configure "Any Entry Signal" for combined long/short notifications
- **Execution**: When alert fires, verify chart visuals, then manually place limit order at entry zone with provided TP/SL levels
### For 5-15 Minute Day Trading with Alerts:
- ATR Timeframe: "5" or match chart
- ATR Min Value: Adjust to instrument (test 8-15 for NQ)
- Entry Zone %: 20-30%
- TP Method: % of Channel, 40-60%
- SL Offset: 5-10 ticks
- Cooldown: 3-5 bars
- **Alert Setup**: Configure separate "Long Scalp Entry" and "Short Scalp Entry" alerts if you trade directionally based on bias
- **Execution**: Review channel structure on alert, confirm ATR filter shows ✓, then enter manually
### For 30-60 Minute Swing Scalping with Alerts:
- ATR Timeframe: "15" or "30"
- ATR Min Value: Lower threshold for broader market
- Entry Zone %: 25-35%
- TP Method: % of Channel, 50-70%
- SL Offset: 10-15 ticks
- Cooldown: 5+ bars or disable
- **Alert Setup**: Use "New Channel Formation" to prepare for setups, then "Any Entry Signal" for execution alerts
- **Execution**: Larger timeframes allow more analysis time between alert and entry
### Webhook Integration for Semi-Automation:
- Configure alert webhook URL to connect with platforms like TradersPost, TradingView Paper Trading, or custom automation
- Alert message includes all necessary order parameters (direction, entry, TP, SL)
- Webhook receives structured data when signal fires
- External platform can auto-execute based on alert payload
- Still maintains manual oversight vs full strategy automation
## USAGE CONSIDERATIONS:
- **Manual Discipline Required**: Alerts provide opportunities but execution requires judgment. Not all alerts should be taken - consider market context, trend, and channel quality
- **Alert Timing**: Alerts fire on bar close by default. Ensure "Once Per Bar Close" is selected to avoid false signals during bar formation
- **Notification Delivery**: Mobile/email alerts may have 1-3 second delay. For immediate execution, use desktop popups or webhook automation
- **Cooldown Necessity**: Without cooldown, rapidly touching price action can generate excessive alerts. Start with 3-bar cooldown and adjust based on alert volume
- **ATR Filter Impact**: Enabling ATR filter dramatically reduces alert count but improves quality. Track filter status in info table to understand when you're receiving fewer alerts
- **Commission Awareness**: High alert frequency means high potential trade count. Calculate if your commission structure supports frequent scalping before acting on all alerts
## COMPATIBLE MARKETS:
Works on any instrument with price data including stock indices (NQ, ES, YM, RTY), individual stocks, forex pairs (EUR/USD, GBP/USD), cryptocurrency (BTC, ETH), and commodities. Volume-based features are not included in this indicator version. Multi-timeframe ATR requires higher-tier TradingView subscription for request.security() functionality on timeframes below chart timeframe.
## KNOWN LIMITATIONS:
- **Indicator does not execute trades** - alerts are informational only; you must manually place all orders
- **Alert delivery depends on TradingView infrastructure** - delays or failures possible during platform issues
- **No position tracking** - indicator doesn't know if you're in a trade; you must manage open positions independently
- **TP/SL levels are reference only** - you must manually set these on your broker platform; they are not live orders
- **Immediate touch entry can generate many alerts** in choppy zones without adequate cooldown
- **Channel deletion at 10-tick breaks** may be too aggressive or lenient depending on instrument tick size
- **ATR filter from lower timeframes** requires TradingView Premium/Pro+ for request.security()
- **Mean reversion logic fails** in strong breakout scenarios - alerts will fire but trades may hit stops
- **No partial closing capability** - full position management is manual; you determine scaling out
- **Alerts do not account for gaps** or overnight price changes; morning alerts may be stale
## RISK DISCLOSURE:
Trading involves substantial risk of loss. This indicator provides signals for educational and informational purposes only and does not constitute financial advice. Past performance does not guarantee future results. Mean reversion strategies can experience extended drawdowns during trending markets. Alerts are not guaranteed to be profitable and should be combined with your own analysis. Stop losses may not fill at intended levels during extreme volatility or gaps. Never trade with capital you cannot afford to lose. Consider consulting a licensed financial advisor before making trading decisions. Always verify alerts against current market conditions before executing trades manually.
## ACKNOWLEDGMENT & CREDITS:
This indicator is built upon the channel detection methodology created by **AlgoAlpha** in the "Smart Money Breakout Channels" indicator. Full credit and appreciation to AlgoAlpha for pioneering the normalized volatility approach to identifying consolidation patterns. The core channel formation logic using normalized price standard deviation is AlgoAlpha's original contribution to the TradingView community.
Enhancements to the original concept include: mean reversion entry logic (vs breakout), immediate touch-based alert generation, comprehensive alert condition system with customizable notifications, multi-timeframe ATR volatility filtering, cooldown period for alert management, dual TP methods (fixed points vs channel percentage), visual TP/SL reference lines, and real-time status monitoring table. This indicator version is specifically designed for manual traders who prefer alert-based decision making over automated execution.

BOCS AdaptiveBOCS Adaptive Strategy - Automated Volatility Breakout System
WHAT THIS STRATEGY DOES:
This is an automated trading strategy that detects consolidation patterns through volatility analysis and executes trades when price breaks out of these channels. Take-profit and stop-loss levels are calculated dynamically using Average True Range (ATR) to adapt to current market volatility. The strategy closes positions partially at the first profit target and exits the remainder at the second target or stop loss.
TECHNICAL METHODOLOGY:
Price Normalization Process:
The strategy begins by normalizing price to create a consistent measurement scale. It calculates the highest high and lowest low over a user-defined lookback period (default 100 bars). The current close price is then normalized using the formula: (close - lowest_low) / (highest_high - lowest_low). This produces values between 0 and 1, allowing volatility analysis to work consistently across different instruments and price levels.
Volatility Detection:
A 14-period standard deviation is applied to the normalized price series. Standard deviation measures how much prices deviate from their average - higher values indicate volatility expansion, lower values indicate consolidation. The strategy uses ta.highestbars() and ta.lowestbars() functions to track when volatility reaches peaks and troughs over the detection length period (default 14 bars).
Channel Formation Logic:
When volatility crosses from a high level to a low level, this signals the beginning of a consolidation phase. The strategy records this moment using ta.crossover(upper, lower) and begins tracking the highest and lowest prices during the consolidation. These become the channel boundaries. The duration between the crossover and current bar must exceed 10 bars minimum to avoid false channels from brief volatility spikes. Channels are drawn using box objects with the recorded high/low boundaries.
Breakout Signal Generation:
Two detection modes are available:
Strong Closes Mode (default): Breakout occurs when the candle body midpoint math.avg(close, open) exceeds the channel boundary. This filters out wick-only breaks.
Any Touch Mode: Breakout occurs when the close price exceeds the boundary.
When price closes above the upper channel boundary, a bullish breakout signal generates. When price closes below the lower boundary, a bearish breakout signal generates. The channel is then removed from the chart.
ATR-Based Risk Management:
The strategy uses request.security() to fetch ATR values from a specified timeframe, which can differ from the chart timeframe. For example, on a 5-minute chart, you can use 1-minute ATR for more responsive calculations. The ATR is calculated using ta.atr(length) with a user-defined period (default 14).
Exit levels are calculated at the moment of breakout:
Long Entry Price = Upper channel boundary
Long TP1 = Entry + (ATR × TP1 Multiplier)
Long TP2 = Entry + (ATR × TP2 Multiplier)
Long SL = Entry - (ATR × SL Multiplier)
For short trades, the calculation inverts:
Short Entry Price = Lower channel boundary
Short TP1 = Entry - (ATR × TP1 Multiplier)
Short TP2 = Entry - (ATR × TP2 Multiplier)
Short SL = Entry + (ATR × SL Multiplier)
Trade Execution Logic:
When a breakout occurs, the strategy checks if trading hours filter is satisfied (if enabled) and if position size equals zero (no existing position). If volume confirmation is enabled, it also verifies that current volume exceeds 1.2 times the 20-period simple moving average.
If all conditions are met:
strategy.entry() opens a position using the user-defined number of contracts
strategy.exit() immediately places a stop loss order
The code monitors price against TP1 and TP2 levels on each bar
When price reaches TP1, strategy.close() closes the specified number of contracts (e.g., if you enter with 3 contracts and set TP1 close to 1, it closes 1 contract). When price reaches TP2, it closes all remaining contracts. If stop loss is hit first, the entire position exits via the strategy.exit() order.
Volume Analysis System:
The strategy uses ta.requestUpAndDownVolume(timeframe) to fetch up volume, down volume, and volume delta from a specified timeframe. Three display modes are available:
Volume Mode: Shows total volume as bars scaled relative to the 20-period average
Comparison Mode: Shows up volume and down volume as separate bars above/below the channel midline
Delta Mode: Shows net volume delta (up volume - down volume) as bars, positive values above midline, negative below
The volume confirmation logic compares breakout bar volume to the 20-period SMA. If volume ÷ average > 1.2, the breakout is classified as "confirmed." When volume confirmation is enabled in settings, only confirmed breakouts generate trades.
INPUT PARAMETERS:
Strategy Settings:
Number of Contracts: Fixed quantity to trade per signal (1-1000)
Require Volume Confirmation: Toggle to only trade signals with volume >120% of average
TP1 Close Contracts: Exact number of contracts to close at first target (1-1000)
Use Trading Hours Filter: Toggle to restrict trading to specified session
Trading Hours: Session input in HHMM-HHMM format (e.g., "0930-1600")
Main Settings:
Normalization Length: Lookback bars for high/low calculation (1-500, default 100)
Box Detection Length: Period for volatility peak/trough detection (1-100, default 14)
Strong Closes Only: Toggle between body midpoint vs close price for breakout detection
Nested Channels: Allow multiple overlapping channels vs single channel at a time
ATR TP/SL Settings:
ATR Timeframe: Source timeframe for ATR calculation (1, 5, 15, 60, etc.)
ATR Length: Smoothing period for ATR (1-100, default 14)
Take Profit 1 Multiplier: Distance from entry as multiple of ATR (0.1-10.0, default 2.0)
Take Profit 2 Multiplier: Distance from entry as multiple of ATR (0.1-10.0, default 3.0)
Stop Loss Multiplier: Distance from entry as multiple of ATR (0.1-10.0, default 1.0)
Enable Take Profit 2: Toggle second profit target on/off
VISUAL INDICATORS:
Channel boxes with semi-transparent fill showing consolidation zones
Green/red colored zones at channel boundaries indicating breakout areas
Volume bars displayed within channels using selected mode
TP/SL lines with labels showing both price level and distance in points
Entry signals marked with up/down triangles at breakout price
Strategy status table showing position, contracts, P&L, ATR values, and volume confirmation status
HOW TO USE:
For 2-Minute Scalping:
Set ATR Timeframe to "1" (1-minute), ATR Length to 12, TP1 Multiplier to 2.0, TP2 Multiplier to 3.0, SL Multiplier to 1.5. Enable volume confirmation and strong closes only. Use trading hours filter to avoid low-volume periods.
For 5-15 Minute Day Trading:
Set ATR Timeframe to match chart or use 5-minute, ATR Length to 14, TP1 Multiplier to 2.0, TP2 Multiplier to 3.5, SL Multiplier to 1.2. Volume confirmation recommended but optional.
For Hourly+ Swing Trading:
Set ATR Timeframe to 15-30 minute, ATR Length to 14-21, TP1 Multiplier to 2.5, TP2 Multiplier to 4.0, SL Multiplier to 1.5. Volume confirmation optional, nested channels can be enabled for multiple setups.
BACKTEST CONSIDERATIONS:
Strategy performs best during trending or volatility expansion phases
Consolidation-heavy or choppy markets produce more false signals
Shorter timeframes require wider stop loss multipliers due to noise
Commission and slippage significantly impact performance on sub-5-minute charts
Volume confirmation generally improves win rate but reduces trade frequency
ATR multipliers should be optimized for specific instrument characteristics
COMPATIBLE MARKETS:
Works on any instrument with price and volume data including forex pairs, stock indices, individual stocks, cryptocurrency, commodities, and futures contracts. Requires TradingView data feed that includes volume for volume confirmation features to function.
KNOWN LIMITATIONS:
Stop losses execute via strategy.exit() and may not fill at exact levels during gaps or extreme volatility
request.security() on lower timeframes requires higher-tier TradingView subscription
False breakouts inherent to breakout strategies cannot be completely eliminated
Performance varies significantly based on market regime (trending vs ranging)
Partial closing logic requires sufficient position size relative to TP1 close contracts setting
RISK DISCLOSURE:
Trading involves substantial risk of loss. Past performance of this or any strategy does not guarantee future results. This strategy is provided for educational purposes and automated backtesting. Thoroughly test on historical data and paper trade before risking real capital. Market conditions change and strategies that worked historically may fail in the future. Use appropriate position sizing and never risk more than you can afford to lose. Consider consulting a licensed financial advisor before making trading decisions.
ACKNOWLEDGMENT & CREDITS:
This strategy is built upon the channel detection methodology created by AlgoAlpha in the "Smart Money Breakout Channels" indicator. Full credit and appreciation to AlgoAlpha for pioneering the normalized volatility approach to identifying consolidation patterns and sharing this innovative technique with the TradingView community. The enhancements added to the original concept include automated trade execution, multi-timeframe ATR-based risk management, partial position closing by contract count, volume confirmation filtering, and real-time position monitoring.

Dizzy HOLO🚀 Dizzy HOLO is an all-in-one professional trading suite designed for serious traders.
It combines Pivot Points, Opening Range Breakout (ORB), HOLO (High of Low / Low of High), Weekly Levels, SMA Thresholds, and Real-Time Alerts into a single lightweight indicator.
🔑 Key Features:
✅ Pivot Points (Fibonacci & Camarilla) – Automatic support & resistance with labels.
✅ Opening Range Breakout (ORB) – Custom session ORB with historical data and breakout alerts.
✅ HOLO Strategy – Daily High/Low, Highest H1 Open, Lowest H1 Close with dynamic buy/sell zones.
✅ Weekly Levels – Previous Week High/Low/Open/Close with extended dotted projections.
✅ SMA Threshold Zones – Dynamic SMA with gray zone filter and trend-based candle coloring.
✅ Multi-Timeframe Analysis – Auto-switching pivots & real-time confirmation.
✅ Smart Alerts – Pivot breakouts, ORB levels, HOLO crosses, and Weekly breaks.
🎯 Why Use Dizzy HOLO?
This indicator is built for breakout, reversal, and trend traders. It provides clear market structure, liquidity zones, and actionable alerts so you never miss important setups.
🛠️ Best Suited For:
Intraday scalpers
Swing traders
Breakout traders
HOLO strategy followers
Multi-timeframe traders

Apex Edge Sentinel - Stop Loss HUDApex Edge – ATR Sentinel Stop Loss HUD
The Apex Edge – ATR Sentinel is a complete stop-loss intelligence system built as a clean, always-on HUD.
It delivers institutional-level risk guidance by calculating and displaying live ATR-based stop levels for both long and short trades at multiple risk tolerances.
Forget cluttered charts and repainting lines — Sentinel gives you a clear stop-loss reference panel that updates dynamically with every bar.
✅ Features
• Triple ATR Multipliers
User-defined (e.g. x1.5 / x2.0 / x2.5). Compare tight, medium, and wide stops instantly.
• Dual-Side SL Levels
Both Long and Short safe stop prices displayed side by side. No more guessing trend
bias.
• ATR Transparency
HUD shows ATR(length) so you always know the calculation basis. Default = 14, adjustable
to your style.
• ATR Regime Meter
Detects volatility conditions (LOW / NORMAL / HIGH) by comparing ATR to its SMA. Helps
you avoid over-tight stops in high-volatility markets.
• Tick-Aware Rounding
Stop levels auto-rounded to the instrument’s tick size (Gold = 0.10, FX = 0.0001, indices =
whole points).
Custom HUD Design
• Location: Top/Bottom, Left/Right
• Sizes: Compact / Medium / Large (desktop or mobile)
• Opacity control (25% default Apex styling)
How to Use
1. Load Sentinel on your chart.
2. Check the HUD:
• ATR(14): 2.6 → base volatility measure.
• x1.5 / x2.0 / x2.5 → instant SL levels for both long & short trades.
3. Before entering a trade → decide which multiplier matches your style (tight scalper vs wider swing).
4. Manually place your SL at the level displayed in the HUD.
Sentinel works as both:
• A pre-trade check (is ATR stop too wide for my RR?).
• A live risk compass (updated stop levels every bar).
Why Apex Sentinel?
Most ATR stop indicators clutter charts with lagging lines or repainting trails. Sentinel strips it back to what matters:
• The numbers.
• The risk levels.
• The context.
It’s a pure stop-loss HUD, designed for serious traders who want clarity, discipline, and instant reference points across any market or timeframe.
Notes
• This is a HUD-only system (no automatic SL line). Traders manually apply the SL level
shown in the panel.
• Defaults: ATR(14), multipliers 1.5 / 2.0 / 2.5. Adjust to your trading style.
• Best used on intraday pairs like XAUUSD, EURUSD, indices, but works universally.
Apex Edge Philosophy: Clean. Smart. Institutional.
No clutter. No gimmicks. Just precision tools for modern markets.

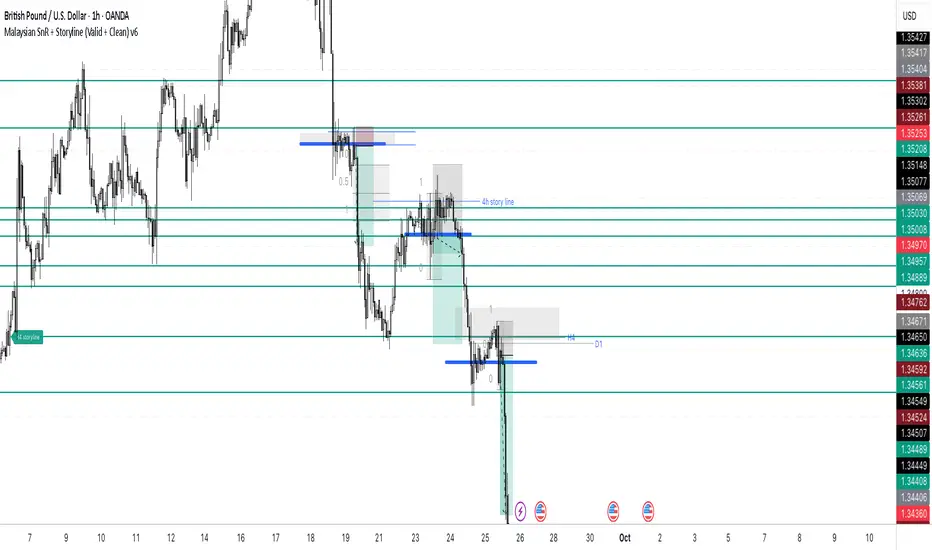
Malaysian SnR + Storyline This indicator combines the Malaysian Support & Resistance (SnR) method with a Multi-Timeframe Storyline view.
🔹 Malaysian SnR (A/V levels)
Plots Support & Resistance using candlestick bodies only (close → open).
“A” shape = Resistance (bullish close → bearish open).
“V” shape = Support (bearish close → bullish open).
Supports Fresh/Unfresh logic with wick-touch validation.
🔹 Storyline (W/D/H4/H1 bias lines)
Weekly = Big map / macro bias.
Daily = Medium trend / retracement.
H4 = Intraday bias confirmation.
H1 = Execution bias (entry filter).
Lines extend forward and only update when a new pivot confirms.
🔹 Extra Features
Alignment Rule: option to hide A/V levels when TF biases don’t align (e.g. W=D=H4=H1).
Story Labels: optional text labels describing each TF storyline.
History filter: show storyline for the last X days only, for cleaner charts.
This script is designed for price action traders who want to combine body-based SnR levels with a clear multi-timeframe bias storyline, making it easier to align intraday execution with higher timeframe context.
Session AnchorsDescription
This indicator highlights the four main global trading sessions — London, New York AM, New York PM, and Asia — as color-coded boxes on the chart. Each session is defined by fixed start/end times (New York time) and dynamically updates with the evolving high and low during that interval. This provides a clear view of how volatility and structure shift as trading activity passes from one region to another.
How to use
• Works on any timeframe.
• Toggle sessions on/off based on your trading hours.
• Observe price behavior as one session closes and another opens.
• Use session boxes as context for liquidity, volatility, and structure analysis.
Originality
This script delivers a clean, customizable visualization of global market hours and session ranges, avoiding extra overlays so traders can isolate session-based behavior without distraction.
⚠️ Disclaimer
This indicator does not generate signals. It provides a structural mapping of global sessions for contextual analysis only.

KILLZONE & CHECK LIST ICAKILLZONE & CHECK LIST ICA | The Inner Circle Alchemist
✨ Features:
Display of precise trading killzones on the chart
Marking the high, low, and mid-level of each killzone
Option to show/hide killzone names
Daily separators at custom times (e.g. 17:00 or 00:00)
Highlighting Midnight Open, 8:30 Open, and New York Stock Exchange Open
Display of previous day, week, and month highs & lows (optional)
A clean and practical trading checklist on the bottom-right of the chart
Visual customization, such as showing your name/brand on the chart
Clear indication of weekdays
⚡️ A perfect mix of professional tools & visual style to keep you one step ahead!
ID on All Platforms: TheInnerCircleAlchemist
#Forex #Trading #Indicator #Killzone #TradingChecklist #PriceAction #DayTrading #SwingTrading #SmartMoney #MarketStructure #TradingTools #ChartAnalysis #TechnicalAnalysis #ForexStrategy #TraderLife #ForexTrading


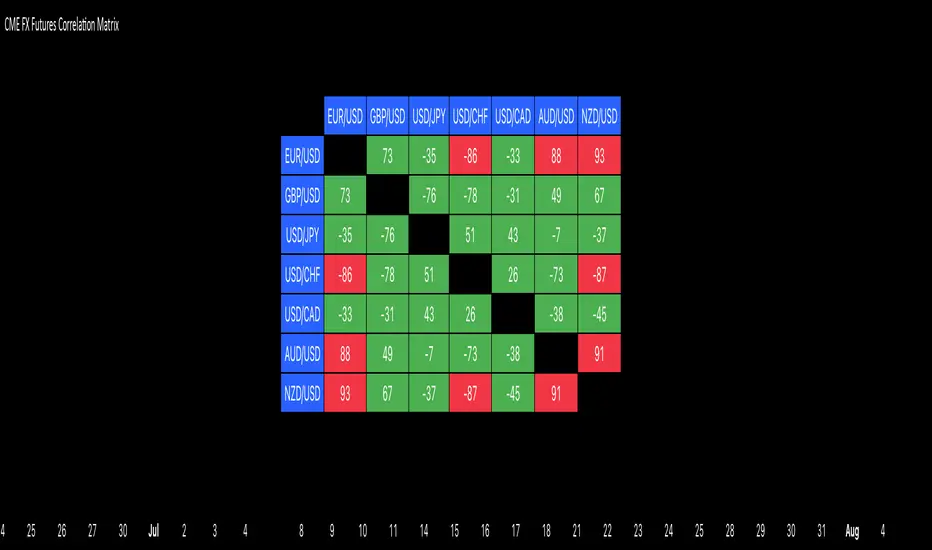
CME FX Futures Correlation MatrixThis indicator calculates the correlation between major CME FX futures and displays it in a visual table. It shows how closely pairs like EUR/USD, GBP/USD, USD/JPY, USD/CHF, USD/CAD, AUD/USD, and NZD/USD move together or in opposite directions.
The indicator inherits the timeframe of the chart it’s applied to.
Color coding:
Red: strong correlation (absolute value > 80%), both positive and negative
Green: moderate/low correlation
How to launch it
Apply the indicator to a CME chart (e.g., EUR/USD futures).
Set Numbers of Bars Back to the desired lookback period (default 100).
The table appears in the center of the chart, showing correlation percentages between all major FX futures.
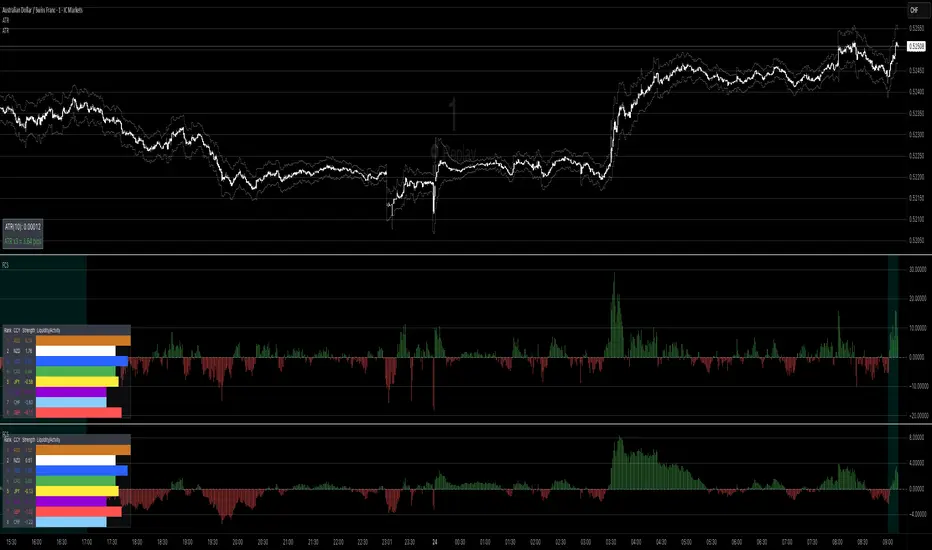
Forex Currency Strength What this indicator does
It compares the relative strength of the 8 major currencies (USD, EUR, GBP, JPY, AUD, CAD, NZD, CHF) by looking at all 28 currency pairs. Each currency is smoothed (averaged) with a moving average to reduce noise.
From this it shows:
• Currency strength lines → how each major currency is performing over time (optional view).
• Pair divergence histogram → the difference in strength between the two currencies of the chart pair (e.g. EUR vs USD on an EURUSD chart). Green means the base currency is stronger, red means the quote currency is stronger.
• Ranking table → shows the strongest to weakest currency at the current moment. The strongest is highlighted green, the weakest red.
• Session highlighting → shows your chosen trading session on the chart (background shading, optional vertical line at the session start).
• Alerts → you can set TradingView alerts when:
• the pair divergence crosses above or below zero
• the divergence strength gets big enough (above your threshold)
• the difference between the strongest and weakest currency becomes large
⸻
👉 In plain words:
This indicator helps you quickly see which currencies are strong, which are weak, and whether the pair you are trading has a clear directional bias. It also highlights trading sessions and can notify you when strong moves or imbalances appear.
// ─────────────────────────────────────────────────────────────
// Forex Currency Strength (8 Majors, %R) + Divergence + Ranking
// ─────────────────────────────────────────────────────────────
//
// === Inputs ===
//
// exchPrefix → Broker/feed prefix (e.g. "OANDA:", "FX:", or "" for ICMarkets)
// tf → Data timeframe (empty = chart timeframe)
// smoothLen → Smoothing length (MA) for currency strength (default = 14)
// smoothMethod → MA method (SMA, EMA, WMA, DEMA)
// viewMode → Display mode: "Strength Lines", "Pair Divergence", "Both"
// (Tip: set to "Pair Divergence" to hide lines by default)
// barsLimit → Number of bars to display
//
// sessionStr → Trading session time (e.g. "0800-1700"); session is highlighted on chart
//
// alertDivAbs → Threshold for alerts on |divergence|
// alertGapTF → Threshold for alerts on Top–Flop ranking gap
//
// scaleK → Scaling factor (here ×1000)
//
// rankPos → Position of the ranking table (top/bottom left/right)
// rankTextSize → Font size for the ranking table (tiny, small, normal, large, huge)
//
// === Outputs ===
//
// • 8 currency strength lines (optionally visible)
// • Divergence (current pair) as histogram
// • Ranking table (top & flop highlighted)
// • Session highlighting (background color + optional vertical line)
// • Alerts on divergence crosses, |divergence| thresholds & top–flop gaps
//
// === Alert Conditions ===
//
// longDivCross → Divergence (current pair) crosses above 0
// shortDivCross → Divergence (current pair) crosses below 0
// divAbsUp → |Divergence| exceeds alertDivAbs threshold
// gapUp → Top–Flop ranking gap exceeds alertGapTF threshold
//
// ─────────────────────────────────────────────────────────────
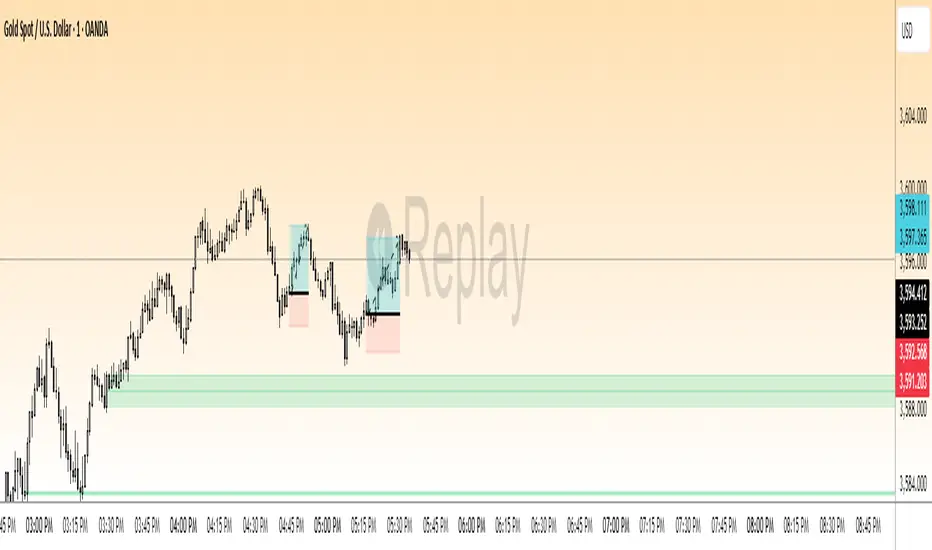
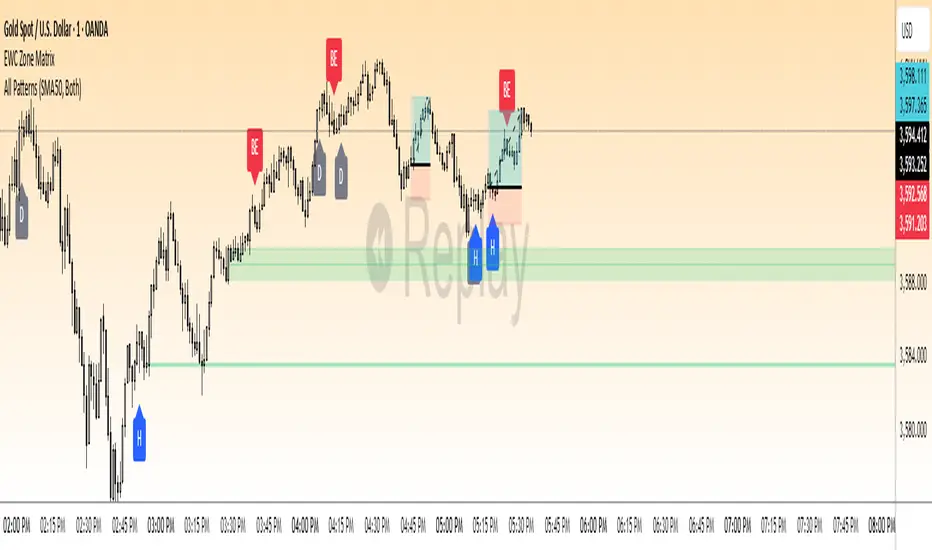
EWC Zone Matrix📌 EWC Precision Blocks
🔎 Overview
EWC Precision Blocks is a professional market analysis tool designed to highlight high-probability trading zones on the chart. Instead of relying on lagging signals, this indicator maps out Alpha Zones (bullish) and Beta Zones (bearish), allowing traders to identify potential market reaction areas with clarity.
The algorithm is built to adapt across Scalp, Swing, and Position trading modes, making it flexible for short-term intraday traders as well as long-term investors.
⚡ Key Features
Multi-Mode Detection – Switch between Scalp, Swing, or Position modes depending on your trading style.
EWC Alpha Zone (Bullish Detection) – Highlights areas where the market may find strong upward momentum.
EWC Beta Zone (Bearish Detection) – Highlights areas where the market may face downward pressure.
Zone Break Tracking – Visualizes when a zone has been invalidated or broken.
Body-Based Detection – Option to base calculations on candle bodies instead of wicks for precision.
Zone Flips – Displays polarity shifts when zones transition from supportive to resistive behavior (and vice versa).
Custom Styling – Full control of zone and break colors for clear chart visualization.
🎯 How to Use
Select Your Mode
Scalp → Designed for fast intraday moves.
Swing → Medium-term setups, ideal for session trading.
Position → Long-term outlook, suitable for investors.
Watch the Alpha Zones
Highlighted bullish areas can serve as potential support or accumulation zones.
Watch the Beta Zones
Highlighted bearish areas may act as resistance or distribution zones.
Monitor Breaks & Flips
Alpha Breaks → Bullish zones failing.
Beta Breaks → Bearish zones failing.
Zone Flips → Polarity changes, often powerful signals.
🛠 Inputs & Customization
EWC Mode → Choose Scalp, Swing, or Position.
Show Last Alpha Zone → Set how many bullish zones to display.
Show Last Beta Zone → Set how many bearish zones to display.
Body-Based Detection → Toggle candle body vs. wick calculation.
EWC Alpha Zone / Beta Zone Styling → Customize zone colors.
Alpha Break / Beta Break Colors → Adjust break visuals.
Show Zone Flips → Enable/disable historical polarity labels.
Status Bar → Display inputs directly in the chart status line.
📈 Best Practices
Works across all timeframes and markets (forex, crypto, indices, stocks).
Combine with your existing strategy for confirmation.
Use in alignment with higher timeframe structure for maximum accuracy.
⚠ Disclaimer
EWC Precision Blocks is a market visualization tool provided for educational purposes only. It does not provide financial advice, signals, or guaranteed results. Always do your own research and manage risk responsibly.
🔹 About EWC
EWC (EastWave Capital) is dedicated to developing professional-grade trading tools and strategies for traders across forex, crypto, commodities, and indices. With over a decade of combined market experience, our mission is to empower traders with precision, clarity, and confidence in their decision-making.
EWC Precision Blocks is one of our flagship tools, reflecting our commitment to innovation, transparency, and trader-focused solutions.
📌 Published by Usama Manzoor — Founder of EastWave Capital (EWC)
1 minute ago
Release Notes
EWC Precision Blocks
The EWC Alpha-Beta Zone Detector is designed for traders who value clarity, precision, and flexibility in their chart analysis.
By mapping out Alpha (strength) and Beta (weakness) zones, this script provides a structured way to understand how price reacts to key levels in the market.
This indicator is built on price action principles and market structure analysis, avoiding clutter and focusing on the essentials traders need. Whether you are scalping on lower timeframes or analyzing swing opportunities, the Alpha-Beta Zone Detector adapts to your style.
🔹 Core Features
Alpha & Beta Zones → Detects bullish and bearish strength zones in real time.
Highlight Last Zone → Focus on the most recent Alpha/Beta zone for clarity.
Zone Flip Detection → Identifies polarity changes when zones shift from support to resistance or vice versa.
Body-Based Detection → Option to base calculations on candle bodies instead of wicks for more accuracy.
Flexible Timeframe Sensitivity → Switch between short, intermediate, and long-term detection modes.
Custom Zone Styling → Adjust colors, opacity, and line thickness for both Alpha and Beta zones.
Break Visualization → Display breaks of Alpha and Beta zones for additional confirmation.
Market Versatility → Works seamlessly on Forex, Crypto, Indices, Commodities, and Stocks.
🔹 Why Traders Use It
Provides a clear visual guide to market decision zones.
Helps traders refine entries, stop-loss placement, and take-profit levels.
Adapts to multiple trading styles → scalpers, intraday traders, and swing traders.
Keeps charts clean and professional without overloading with unnecessary signals.
⚠️ Disclaimer:
This script is created for educational and informational purposes only. It does not provide financial advice. Trading involves risk; always manage your risk responsibly and conduct your own analysis before entering any position.
EWC Precision Blocks📌 EWC Precision Blocks
🔎 Overview
EWC Precision Blocks is a professional market analysis tool designed to highlight high-probability trading zones on the chart. Instead of relying on lagging signals, this indicator maps out Alpha Zones (bullish) and Beta Zones (bearish), allowing traders to identify potential market reaction areas with clarity.
The algorithm is built to adapt across Scalp, Swing, and Position trading modes, making it flexible for short-term intraday traders as well as long-term investors.
⚡ Key Features
Multi-Mode Detection – Switch between Scalp, Swing, or Position modes depending on your trading style.
EWC Alpha Zone (Bullish Detection) – Highlights areas where the market may find strong upward momentum.
EWC Beta Zone (Bearish Detection) – Highlights areas where the market may face downward pressure.
Zone Break Tracking – Visualizes when a zone has been invalidated or broken.
Body-Based Detection – Option to base calculations on candle bodies instead of wicks for precision.
Zone Flips – Displays polarity shifts when zones transition from supportive to resistive behavior (and vice versa).
Custom Styling – Full control of zone and break colors for clear chart visualization.
🎯 How to Use
Select Your Mode
Scalp → Designed for fast intraday moves.
Swing → Medium-term setups, ideal for session trading.
Position → Long-term outlook, suitable for investors.
Watch the Alpha Zones
Highlighted bullish areas can serve as potential support or accumulation zones.
Watch the Beta Zones
Highlighted bearish areas may act as resistance or distribution zones.
Monitor Breaks & Flips
Alpha Breaks → Bullish zones failing.
Beta Breaks → Bearish zones failing.
Zone Flips → Polarity changes, often powerful signals.
🛠 Inputs & Customization
EWC Mode → Choose Scalp, Swing, or Position.
Show Last Alpha Zone → Set how many bullish zones to display.
Show Last Beta Zone → Set how many bearish zones to display.
Body-Based Detection → Toggle candle body vs. wick calculation.
EWC Alpha Zone / Beta Zone Styling → Customize zone colors.
Alpha Break / Beta Break Colors → Adjust break visuals.
Show Zone Flips → Enable/disable historical polarity labels.
Status Bar → Display inputs directly in the chart status line.
📈 Best Practices
Works across all timeframes and markets (forex, crypto, indices, stocks).
Combine with your existing strategy for confirmation.
Use in alignment with higher timeframe structure for maximum accuracy.
⚠ Disclaimer
EWC Precision Blocks is a market visualization tool provided for educational purposes only. It does not provide financial advice, signals, or guaranteed results. Always do your own research and manage risk responsibly.
🔹 About EWC
EWC (EastWave Capital) is dedicated to developing professional-grade trading tools and strategies for traders across forex, crypto, commodities, and indices. With over a decade of combined market experience, our mission is to empower traders with precision, clarity, and confidence in their decision-making.
EWC Precision Blocks is one of our flagship tools, reflecting our commitment to innovation, transparency, and trader-focused solutions.
📌 Published by Usama Manzoor — Founder of EastWave Capital (EWC)
Forex Sessions(IST)📌 Forex Sessions (IST Version)
This indicator highlights the four major Forex market sessions — Asia, Frankfurt, London, and New York — automatically adjusted to Indian Standard Time (IST).
Session Timings in IST:
Asia: 02:30 – 10:30
🇩🇪 Frankfurt: 11:30 – 12:30
🇬🇧 London: 12:30 – 21:30
🇺🇸 New York: 17:30 – 02:30 (next day)
Trading Advantages:
Asia session → Spot the range high/low
Frankfurt → Detect inducement moves
London → Identify the main push/trend move
New York → Catch reversals & profit taking
Features:
Clean session highlights with custom colors
Optional tools: range, trendlines, mean, VWAP, max/min levels
Adjustable transparency and display settings
With this, you can easily track session overlaps, volatility shifts, and trade setups — all aligned with IST Forex timings.
Standardized Cumulative Deltas [LuxAlgo]The Standardized Cumulative Deltas tool allows traders to compare the cumulative standardized open-close difference for up to 10 different tickers, allowing them to visualize the general sentiment for all selected tickers.
These results allow the construction of two areas showing the average or extreme bullish and bearish cumulative change for all enabled tickers, providing a summarized view of the overall ticker group sentiment.
🔶 USAGE
This tool is meant to give a full picture of the individuals and/or overall selected tickers, and unlike classical indicators, the displayed series of values is not meant to be directly interpreted over time.
Given the selected lookback period, a majority of observations being above 0 indicate an overall bullish market for the asset.
By default, the auto lookback period feature is enabled, allowing the tool to use all the visible bars for its calculations. Traders can also set the lookback period manually. The above chart uses a fixed lookback period of 500.
Up to 10 tickers can be used. While major cryptocurrencies are set by default, the users can set a specific basket of assets, such as US equities, forex pairs, commodities, etc.
🔹 Densities
The provided areas, here called densities, can be used to get an overall sentiment of the selected tickers. The upper density (bullish) processes positive deltas, while the lower one (bearish) processes negative ones.
Interpretation is subject to the selected "Density Mode".
Average: Densities track the average bullish/bearish cumulative deltas for the selected tickers. For example, a more prominent bullish density would indicate that, on average, cumulative deltas were positive across the tickers.
Envelope: Densities track the extreme values made by bullish/bearish cumulative deltas for the selected tickers. Here, a more prominent density would indicate more volatile bullish/bearish movements, depending on the density.
🔹 Dashboard
The tool features a dashboard with active tickers and their respective colors for traders' convenience.
🔶 DETAILS
🔹 Densities
Densities are obtained by applying a forward-backward exponential moving average on the average, or the highest/lowest cumulative series, depending on the selected Density Mode.
The resulting densities are smoothed by the "Smoothing" parameter located in the Settings panel, with higher values returning smoother envelopes with less variability.
Do note that the smoothing method used here is subject to repainting.
🔶 SETTINGS
Lookback: Select the lookback period and enable/disable the Auto Lookback feature
Tickers: Enable/disable and select up to 10 tickers and their colors
Density Mode: Determine how densities are calculated
🔹 Dashboard
Show Dashboard: Enable/disable the dashboard
Position: Select the dashboard position
Size: Select the dashboard size
🔹 Style
Density: Enable/disable the density areas
Bullish Density: Select the color of the top density area
Bearish Density: Select the color of the bottom density area
Smoothing: Select the smoothing constant for the EMA calculation

DEE's Indicator v2 — Daily Range, Averages & Previous High/Low🇺🇸 English
This indicator is designed to help traders analyze market volatility and daily price ranges.
It includes the following features:
• 5-bar analysis: Shows high-low ranges and percentage changes of the last 5 bars.
• Daily Average Range: Calculates daily average ranges based on the last 5 bars.
• Daily AVG Lines: Plots expected top and bottom range levels based on the daily average.
• Previous Day High/Low: Automatically draws lines from the previous day's high and low.
• Timeframe Separators: Adds visual separators between days, months, and years.
• Optional arrows: Displays arrow markers for the last detected bars used in the calculation.
Use cases:
● Intraday traders can quickly measure daily progress compared to the average daily range.
● Swing traders can identify support/resistance levels from previous daily highs and lows.
● Risk managers can monitor when current volatility deviates significantly from the average.
⚠️ Notes:
The script does not generate buy/sell signals; it provides analytical tools only.
All displayed information is for visual/educational purposes and should be combined with your own trading strategy.
👉 Don’t forget to adjust the settings to suit your needs.
If you are using a multi-chart layout with different timeframes and apply this indicator to each chart, the 5-bar data will be calculated separately based on each chart’s TF. However, the “Daily AVG” section will always show the same value for the 1D timeframe.
🇺🇿 O‘zbekcha
Ushbu indikator treyderlarga bozor volatilligi va kundalik narx diapazonlarini tahlil qilishda yordam berish uchun mo‘ljallangan.
Unda quyidagi funksiyalar mavjud:
• 5-bar tahlili: So‘nggi 5 ta bar diapazoni (high–low) va foiz o‘zgarishini ko‘rsatadi.
• Kundalik o‘rtacha diapazon: So‘nggi 5 ta bar asosida o‘rtacha kundalik diapazonni hisoblaydi.
• AVG Lines: Daily AVGning yuqori va pastki diapazon darajalarini chizadi.
• Oldingi kunning High/Low darajalari: Avtomatik ravishda oldingi kunning high va low darajalarini chizadi.
• Vaqt ajratgichlari: Kunlar, oylar va yillar orasiga vizual ajratgich qo‘shadi.
• Ixtiyoriy strelkalar: Hisoblash uchun foydalanilgan so‘nggi barlarda strelka belgilarini ko‘rsatadi.
Qo‘llanilishi:
● Intraday treyderlar kundalik natijani o‘rtacha kundalik diapazon bilan tezda solishtira olishadi.
● Swing treyderlar oldingi kunning high va low darajalaridan qo‘llab-quvvatlash/qarshilik darajalarini aniqlashlari mumkin.
● Risk-menejerlar hozirgi volatillik o‘rtachadan sezilarli darajada og‘ib ketganini kuzatishlari mumkin.
⚠️ Eslatma:
Ushbu indikator sotib olish/sotish signallarini bermaydi; u faqat tahliliy vosita sifatida ishlatiladi.
Ko‘rsatilgan barcha ma’lumotlar vizual/ta’limiy maqsadlarda mo‘ljallangan bo‘lib, o‘z strategiyangiz bilan birgalikda qo‘llanilishi lozim.
👉 Sozlamalarni ehtiyojlaringizga qarab moslashtirishni unutmang.
Agar siz multi-chart rejimida turli timeframelar bilan ishlasangiz va ushbu indikatorni har bir grafikda qo‘llasangiz, 5 ta bar haqidagi ma’lumotlar har bir grafikning o‘z TFiga qarab hisoblanadi. Ammo “Daily AVG” bo‘limida esa faqat 1D timeframe uchun bir xil qiymat ko‘rsatiladi.
🇷🇺 Русский
Этот индикатор предназначен для помощи трейдерам в анализе волатильности рынка и дневных ценовых диапазонов.
Он включает в себя следующие функции:
• Анализ 5 свечей: Показывает диапазон high–low и процентные изменения последних 5 свечей.
• Средний дневной диапазон: Рассчитывает средний дневной диапазон на основе последних 5 свечей.
• Линии среднего диапазона (AVG Lines): Строит ожидаемые верхние и нижние уровни диапазона на основе среднего дневного значения.
• Максимум/минимум предыдущего дня: Автоматически наносит линии с уровнями high и low предыдущего дня.
• Разделители временных интервалов: Добавляет визуальные разделители между днями, месяцами и годами.
• Опциональные стрелки: Показывает стрелки на последних свечах, использованных в расчётах.
Применение:
● Интрадей-трейдеры могут быстро измерять дневное движение по сравнению со средним дневным диапазоном.
● Свинг-трейдеры могут определять уровни поддержки/сопротивления по максимумам и минимумам предыдущего дня.
● Риск-менеджеры могут контролировать ситуации, когда текущая волатильность значительно отклоняется от среднего.
⚠️ Примечания:
Этот индикатор не генерирует сигналы на покупку/продажу; он предоставляет только аналитические инструменты.
Вся отображаемая информация предназначена для визуальных/образовательных целей и должна использоваться совместно с вашей торговой стратегией.
👉 Не забудьте настроить параметры под свои нужды.
Если вы работаете в режиме мульти-графика с разными таймфреймами и применяете этот индикатор на каждом графике, данные по 5 барам будут рассчитываться отдельно для каждого ТФ. Однако в разделе “Daily AVG” всегда отображается одно и то же значение для таймфрейма 1D.
© Dilshod Nurmatov Shuhratovich | deetradesonline | 2025

MATEOANUBISANTIDear traders, investors, and market enthusiasts,
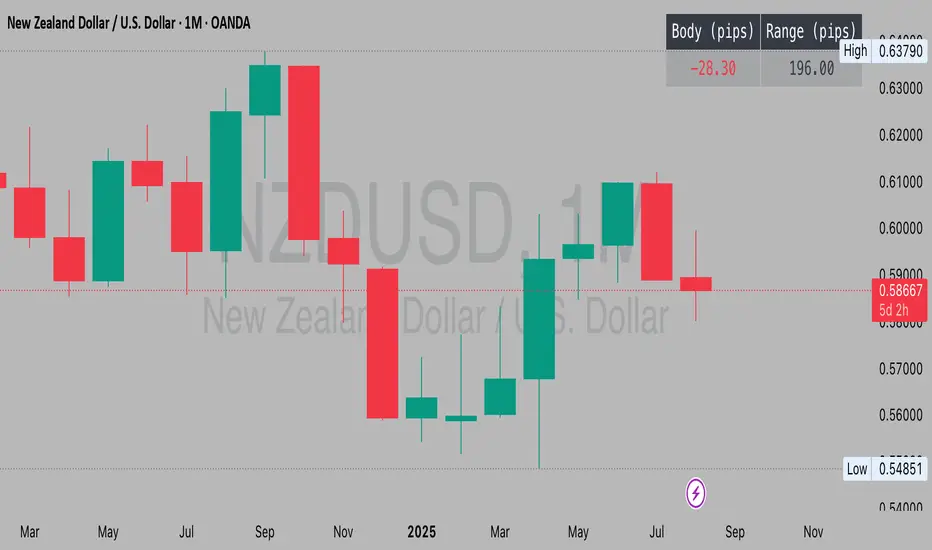
We are excited to share our High-Low Indicator Range for on . This report aims to provide a clear and precise overview of the highest and lowest values recorded by during this specific hour, equipping our community with a valuable tool for making informed and strategic market decisions.

Current Bar Pips — Upper Right Quick pip counter for the active candle that shows the pip change in green if positive and red if negative. Also shows the range from wick to wick for the candle.

Current Bar Pips — Upper Right Quick pip counter for Forex pairs. Adds an indicator to top right to show the current candle's pip count in red if negative, green if positive. It will also show the total range of pips for the candle from wick to wick.