ORB Pro - NY Opening Range Breakout by Elev8+ORB Pro - NY Opening Range Breakout | Smart Support & Resistance
ORB Pro is a comprehensive, professional-grade toolkit designed for intraday traders who rely on the Opening Range Breakout (ORB) strategy.
Unlike standard ORB indicators that simply draw lines, this suite offers a complete dashboard-driven system that monitors four distinct sessions simultaneously, providing real-time status updates and precision alerts.
— — —
🎯 What is the Opening Range Breakout (ORB)?
The Opening Range is the price range established during the first period of the trading session (e.g., the first 15 or 30 minutes). This period represents the initial balance between buyers and sellers. A breakout from this range often signals the likely trend direction for the remainder of the session.
— — —
🚀 Key Features
1. Multi-ORB Monitoring
Stop switching settings constantly. This suite monitors four key ranges at once:
Pre-Market 15m (08:00 – 08:15 ET)
Pre-Market 30m (08:00 – 08:30 ET)
NY Cash Open 15m (09:30 – 09:45 ET)
NY Cash Open 30m (09:30 – 10:00 ET)
2. Smart Status Dashboard
A compact panel in the bottom-right corner gives you the live state of every session:
⏳ Waiting: The session has not started yet.
⚡ Forming: The range is currently being built.
↔️ Range: The range has formed, but price is still contained within the range.
🚀 BULL / 📉 BEAR: A confirmed breakout has occurred.
⛔ OFF: The session is disabled in settings.
3. "Dynamic Resolution" Technology
This is a unique pro feature.
Precision: The script always calculates the High/Low levels using 1-minute data , ensuring your support/resistance lines are pixel-perfect regardless of your chart timeframe.
Flexibility: Breakout signals (Alerts/Labels) are triggered based on your current chart timeframe. This allows you to trade a 5m or 15m breakout strategy while keeping 1m-level precision on your levels.
4. Visual Clarity
Breakout Labels: Automatically plots "BULL" or "BEAR" labels on the exact candle that confirms a breakout.
Profit Targets: Optional toggle to show 1x and 2x profit targets projected from the breakout level.
Time-Bound Signals: Signals are strictly time-bound to the active window to prevent late, low-quality alerts.
— — —
🛠️ How to Use
Add to Chart: Works best on intraday timeframes (1m, 5m, 15m).
Configure: Enable the sessions you trade (e.g., NY 15m) in the settings.
Wait for Forming: Watch the box form live. The dashboard will show "⚡ Forming".
Trade the Break: Wait for a candle Close outside the range. The dashboard will flip to "BULL" or "BEAR" and a label will appear.
Manage Risk: Use the opposite side of the range or the midline as your stop loss.
— — —
⚙️ Settings Overview
Global Settings: Toggle forming boxes, dashboard, and label visibility.
Breakout Method: Choose between Close (safer) or Wick (aggressive) for signal triggers.
Session Groups: Individually enable/disable the 4 distinct sessions and customize their colors/styles.
— — —
📝 Update Notes (Recent)
New PDH/PDL Levels: Added the ability to display Previous Day High and Previous Day Low lines on the chart.
Auto-Update & Cleanup: The PDH/PDL lines now automatically update daily and erase historical lines, ensuring only the current day's levels are visible to keep the chart clean.
Dashboard Positioning: Added a new setting to move the Status Dashboard to any corner of the screen.
Enhanced Customization: Added full styling options in settings for PDH/PDL lines and Dashboard positioning.
— — —
Disclaimer: This tool is for educational and analytical purposes only. Past performance of a strategy does not guarantee future results. Always manage your risk.
30m

Prev/Current Day Open & Close (RamtinFX)Draws three transparent vertical lines marking the previous day’s close, the current day’s open, and the current day’s close.

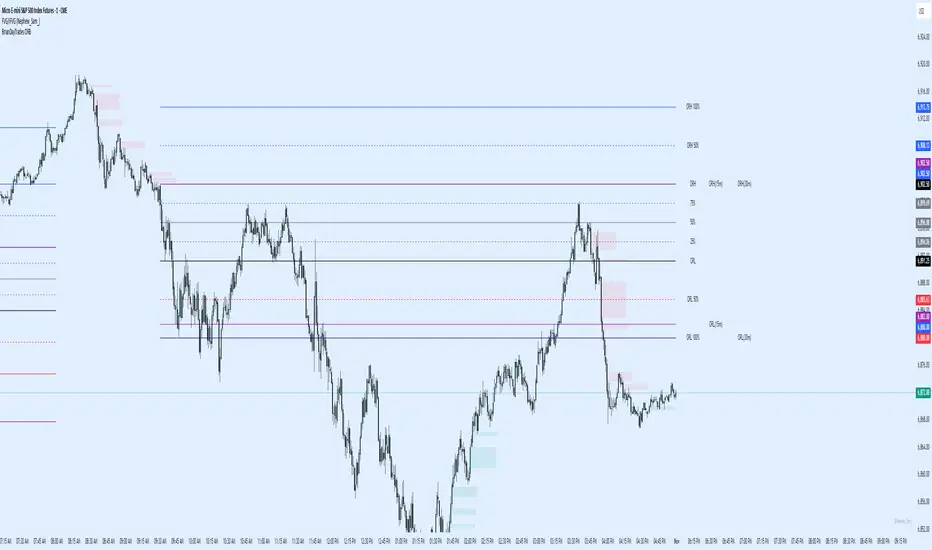
BrianDayTrades ORBThis script enables you to trade the 5m, 15m, or 30m ORB or any combination. You can select the main one you want, and see 25%, 50%, 75% lines as well as 50% and 100% extension lines above and below.
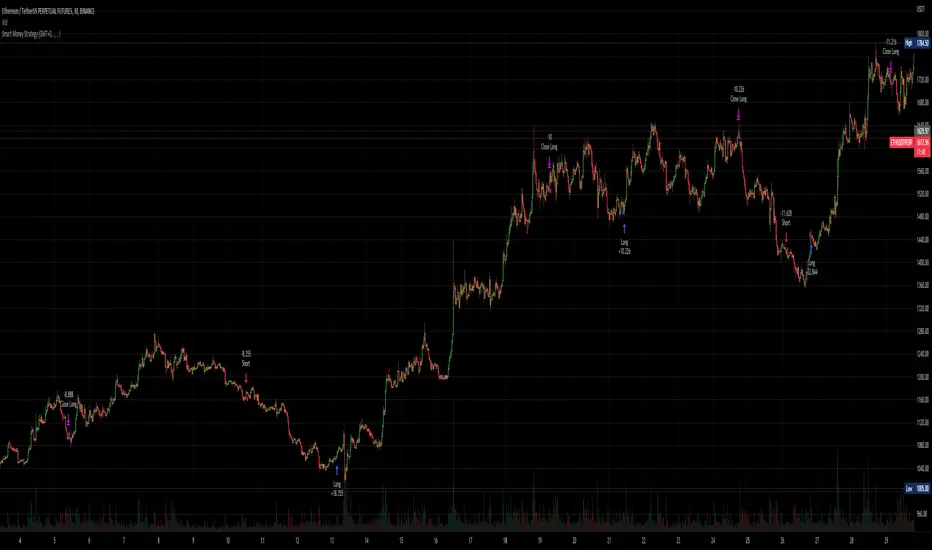
Smart Money - Oscillator and Volume StrategyOverview
This is a no-repaint strategy that is highly optimized for BINANCE:ETHUSDTPERP 30m, normal candles. It is a long/short strategy that is based on CMF, ADX/DMI, Keltner Channels, and other oscillators to identify smart money.
The overall idea of the strategy is to effectively capture the beginnings and ends of trends in price action, and go long/short accordingly. To achieve this, potential entry points are identified with various oscillators and these are then filtered using a variety of moving averages and strength/momentum indicators.
Short and sell inflections are found when ADX, DMI, and/or CMF oscillate below a specified threshold, and Keltner Channels are also used to indicate potential trades.
The indicator will continue to be updated and optimized for current and future market conditions.
If purchased, access to the indicator will be available within 24 hours.
Backtest Results
Parameters:
- 2021-01-01 to present (19 months)
- 100% equity order size
- 0.04% commission fees
- No leverage
17,089% net profit through 296 trades with 60.47% of trades being profitable.
Profit factor of 2.862, Sharpe Ratio of 1.158
Parameters:
- 2021-01-01 to present (19 months)
- $1,000 initial capital
- $1,000 order size
- 0.04% commission fees
- No leverage
584% net profit through 296 trades with 60.47% of trades being profitable.
Parameters:
- 2021-01-01 to present (19 months)
- 500% equity order size
- 0.04% commission fees
- 5x leverage
8,587,557% net profit through 299 trades with 59.87% of trades being profitable.
Sideways Money - Bitcoin BeatsHello, Hello, Hello,
And welcome back to Bitcoin Beats.
This is another version of my previous script, "Range Indicator - Bitcoin Beats".
Designed initially for breakouts but shows adaptive ranges and consolidation in XBTUSD(Haven't tested other assets but should do the same thing).
If we are consolidating (which is most of the time) a good strategy to trade would be to trade ranges. However, as soon as you spot the range it can feel like the range has changed so you lose out on making the monies.
This indicator plots out the average range in a consolidation.
It also shows you when the range has broken in a direction that it previously hasn't broken in. This essentially signifies the the trend changing and gives warning that trading the range may no longer be valid.
There are a few ways to trade this indicator and I will explain 2 of them here.
PLEASE TRADE AT YOUR OWN RISK. YOUR FUNDS ARE YOUR RESPONSIBILITY.
IF YOU TRADE WITH THESE STRATEGIES, YOU ARE TO BLAME FOR YOUR OWN LOSSES.
BY USING THIS INDICATOR YOU AGREE THAT I WILL NOT BE HELD LIABLE IN THE CASE OF YOU LOSING FUNDS.
Strategy 1:
- Have 2 bitmex accounts open.
- Use on the 30m, 1h, 3h or 12h.
- Long AND Short on both accounts when we hit the middle area. This is called the "Reload Zone".
- When we hit the edge of each side of the plotted range, close the positions in profit.
- You will then have 1 trade underwater.
- If the range is solid, the price will move back to the Reload Zone in which you reload you position that you took profit with.
- You then have both a Long AND Short open after 1 profitable trade.
- Rinse and repeat until you get the "STRATEGY CAUTION" message signifying that the range will most likely break soon.
Strategy 2(least profitable):
- When the "STRATEGY CAUTION" Message appears, you can long or short depending on which side it breaks toward.
- If we break down, short.
- If we break up, Long.
I wouldn't advise this second strategy if you are a beginner as the results are inconclusive and it's more of a hybrid trading strategy, meaning you have to know how to trade with price action flowing.
Usually if it is appearing volatile, you can go to a higher time frame and find the exact range it's catering to, adjusting your strategy accordingly.
See you soon,
Goodbye, from Bitcoin Beats.

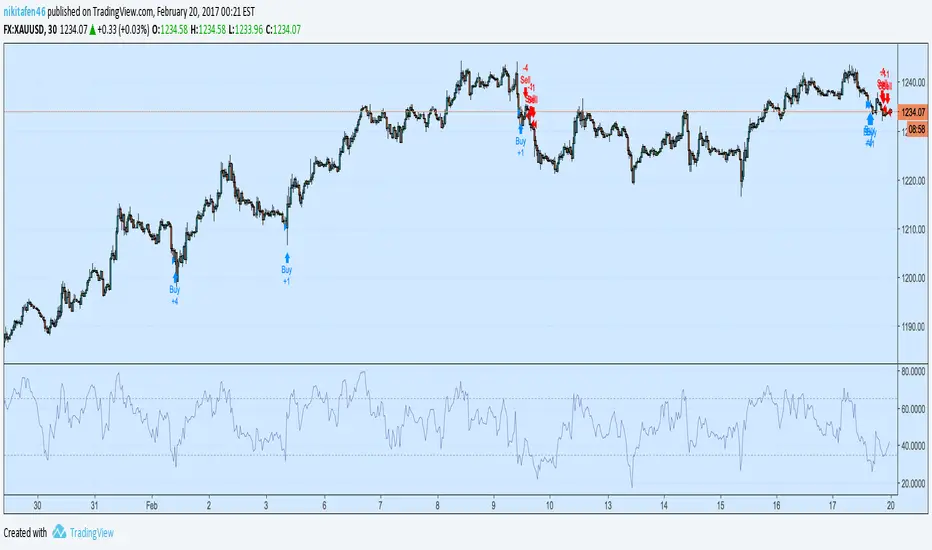
Updated Gold Strategy - Trend Following Script v4.0This strategy improves on the latest one that I posted in several ways.
the %profit is reduced by 3%
Success rate reduced by 2%
Drawdown decreased by half (from 40% to 20%)
Average trade $ increased by $500

Upgraded XAUUSD 30m only Strategy V2.0So i've been fiddling around with this once more
The result is increased net profit, same time frame as previous strategy, more drawdown, but that comes with the net profit.
1 pip = 1$
Pyramiding of 3 orders.
Commission included.
More trades
Profitability rate is about the same.