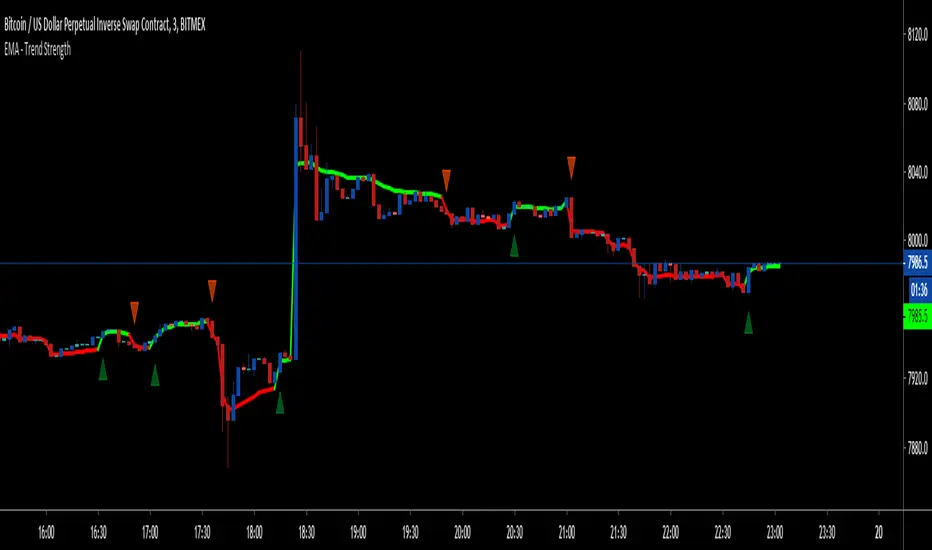
EMA - Trend Strength - 1m ScalperThis is a very special script based on volume, supertrend and ATR which works successfully on a 1m chart for bitmex.
ETH/USD
LTCM19
XRPM19
EOSM19
ADAM19
BCHM19
*private use only
ATR
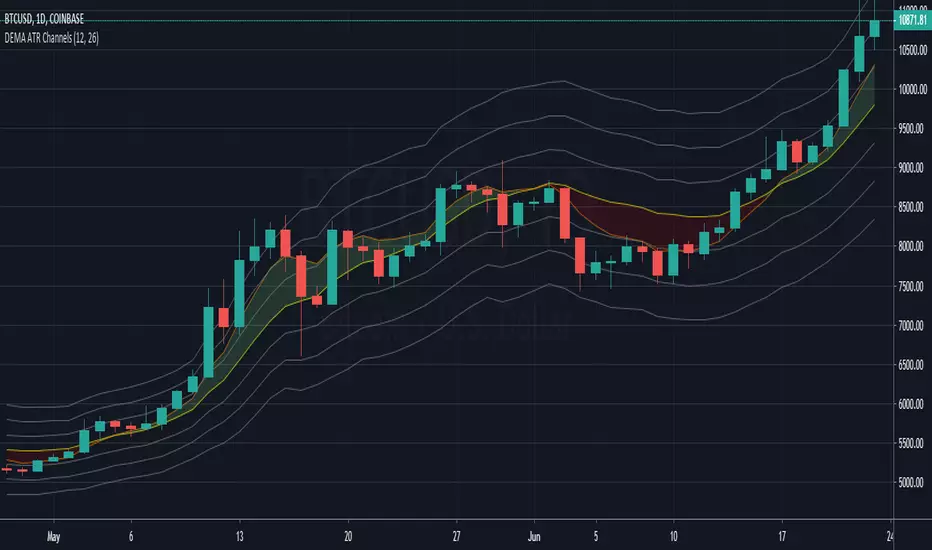
DEMA ATR Channels - New IndicatorA Double Exponential Moving Average (DEMA) with three sets of channel lines each one Average True Range (ATR) apart, above and below the DEMA.
Similar to my "ATR Channels" indicator, but using a DEMA instead of an EMA for the base. In addition, this indicator also plots a fast DEMA as well as a fill between the two. Fully customizable, you can toggle both DEMAs, the fill, and each set of ATR Channels.
ATR channel idea from Kerry Lovvorn as mentioned in Elder's "New Trading for a Living", page 93: "Kerry Lovvorn likes to plot 3 sets of lines around a moving average: at one, two, and three ATRs above and below an EMA . These can be used for setting up entry points and stops, as well as profit targets."
Multiple MA's & ATR-MultiplesPossibly useful to users that do not have a paid subscription. (multiple indicators in one script)
Exponential and simple moving average options with an option for a time frame other than current chart time frame combined with multiples of the average true range plotted as a chart overlay.

ATR ChannelsAn Exponential Moving Average (EMA) with three sets of channel lines each one Average True Range (ATR) apart, above and below the EMA. Fully customizable, you can toggle the EMA and ATR set visibility, line colors, etc.
Inspired by Elder's 'The New Trading For a Living' , page 93: "Kerry Lovvorn likes to plot 3 sets of lines around a moving average: at one, two, and three ATRs above and below an EMA. These can be used for setting up entry points and stops, as well as profit targets."

ATR and RSI Buy / Sell Signal Beta 1.0This has been a long time coming for me.
I need to clean it up and add inputs for others to customize it that's why its protected.
This is configured for US securities.
Goal: Signal when to enter a trade on either side
Method: ATR and 2 RSI signals using:
3 Minute Chart Resolution
MUST have an active (can be hidden) BUILT-IN ATR ; length = 4 and set to RMA smoothing
MUST add the script; THEN go to the scripts settings and change the source to ATR. TV does not allow this to be set to default (that I know of)
I have default settings how I use them but you can modify:
ATR period (Length) =4
ATR multiplier = 0.9 (can edit by 0.1 increments.
The 1st Length/offset/resolution is defaulted to the 1 minute RSI.
The 2nd Length/offset/resolution is defaulted to the 3 minute RSI.
1)
OVERBOUGHT or OVERSOLD
*Please understand I use a length of 4 for this script, that is why the RSI OB/OS limits are so high/low.
Overbought conditions will light yellow if the 1m RSI > 90 and the 3min RSI > 85 and the time is between 09:42am and 16:00
Oversold conditions will light yellow if the 1m RSI < 10 and the 3min RSI < 10 and the time is between 09:42am and 16:00
The script ensures that if it is OB/OS under these conditions than it will not signal a buy or sell.
2)ATR
The script identifies reversals via the close breaking past the previous ATR on the preceding candle. ATR will not move UP on a short and will not move down on a long. It trails the last candle it was not broken.
The script plots labels up and down to identify the start of a reversal. Each start will have an accompanying line to display the continuation of the trend in one direction.
The script displays the value of the STOP as it trails price action. One could continue to mirror this value if you chose to. I use the fib tool for my targets and manage it as P/A demands.
3) RSI SIGNALLING
The script identifies a trend by analyzing BOTH RSI (1m and 3m) measures and requires that the current bar's readouts for BOTH measures are either greater or lower than the preceding candle.
The script also requires that both measures are above or below 50 to signal a trend.
The script will plot the trend as arrows up or down, it will display a (-) when the these conditions are not met.
Requirements to signal a BUY (LIME GREEN) or SELL (BRIGHT RED):
**Ensure your chart candle colors are faded so you can see the signal.**
**Precision is set to 0; remember TV rounds up or down for the visual measure but uses the exact measure for the script**
During the first 12 minutes:
----------------------------------
There are no OB/OS conditions as informed in section 1.
ATR stop line must be present OR the current bar close is higher than the ATR stop of the preceding candle whether it is a long or short stop signal. Quick whips are accounted for.
The current bar close MUST be higher or lower than the preceding candle's HIGH or LOW.
The script MUST identify the RSI signalling as detailed above in section 3.
The candle will light LIME or BRIGHT RED when these conditions are met and will not deceive the statements I have made.
It is important to understand that the signal may become null if the conditions do not persist through the final close of the candle. This means that a snapshot of the indicator does not accurately represent
what it will display at different times during each countdown of EACH 3 minute candle. Sometimes it signals to go long and once RSI gets too high it no longer signals. This is a good thing. Limits FOMO entries.
@ 09:42 until 16:00
-----------------------------------
OB/OS yellow candles will now occur as detailed in section 1.
Candles MUST clear the HIGH or LOW of the TWO preceding candles.
Candles MUST be trending as defined in section 3.
Candles MUST conform the conditions of the ATR stop.
I want to thank;
@pinescripters
@freedom_trader_
and I will even thank the manual lol
I have manually back tested this because I am working on the proper coding to have TV do it for me.
My strategy requires me to cover 25% of my position at 0.5 of the TV ATR 4 length RMA indicator.
Once the first target is hit than the STOP is moved to break-even.
If the target is not hit than my maximum loss is also 0.5 of the TV ATR 4 length RMA indicator.
I tested 3 full days, always on the 3min chart.
I tested 96 trades. All occurring immediately upon signal.
85 were wins and 9 were losses, 88.5% profitable.
Please understand that my intend is to cover enough quickly to cover commission costs and limit losses.
The remaining 75% of my position are sold off in the following pattern unless P/A demands that I override the FIB tool. Let them run when you can.
Position ENTRY
25% cover @ 0.5 x ATR
25% of remaining position cover @ 1.75 x ATR
25% of remaining position cover @ 2.5 x ATR
25% of remaining position cover @ 3.5 x ATR (APX 40% of the initial position)
I will further back test in the near future with an expanded risk.

SFL Daily ATR levelsAn indicator that plots the daily ATR upper and lower levels on a chart.
This is a TradingView re-write from Trader Dante's dATR indicator.

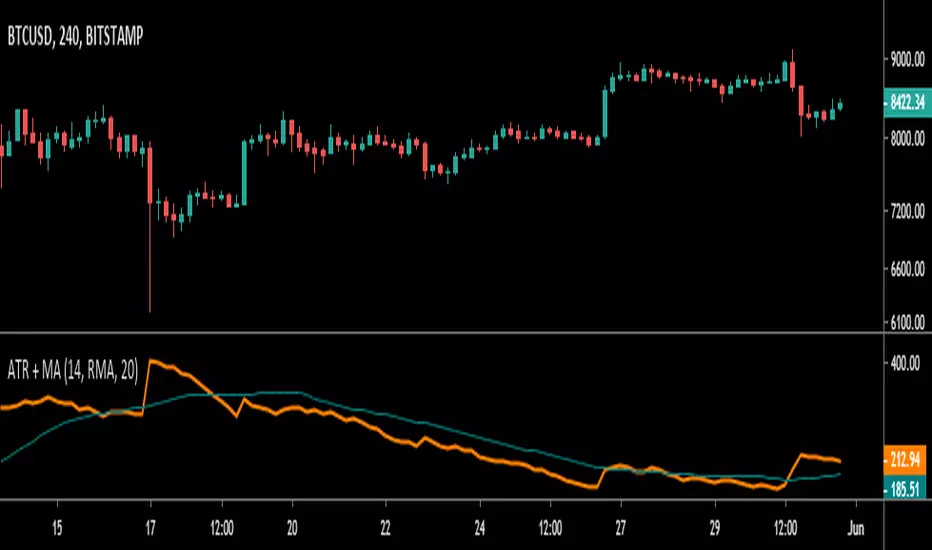
ATR and MA/ATR in one indicatorThis indicator combine ATR and MA of ATR in one. Multiple options for ATR source of calculation and MA type.
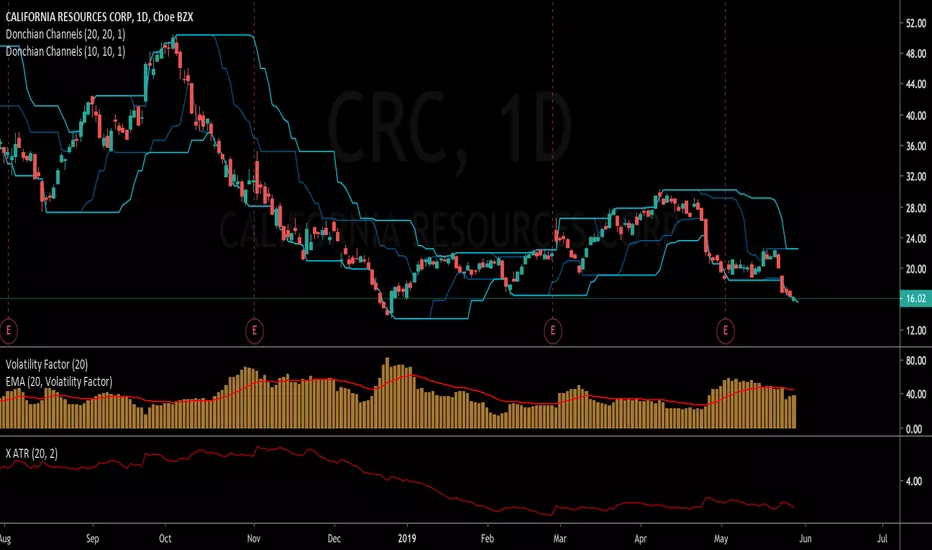
X ATRCustom Multiplier of the Average True Range
Specify your look back period and multiplier, and plot it below the chart.
Highs Lows (with offset) + Median with ATR bandsScript shows Highest and Lowest values (default 10) for given bars back with possible offset on time assis (default 3) with their Median Line + ATR bands around it (no offset here).

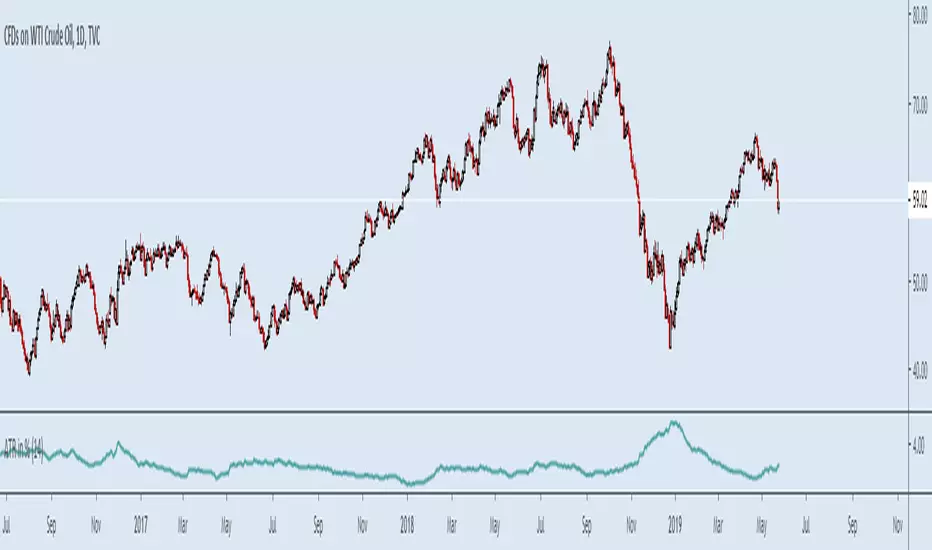
ATR in %Muh indicator :)
Simple but so useful little script. I work in percents because this is what makes sense not "pips" and "ticks" my account grows or diminishes a certain percentage I risk "1%" for example not ticks, ticks is what bad dogs have.
Was tired of calculating manually every time.
Makes it easier to set stop losses, get an idea of what to expect, risk in a kind of worse case scneario, backtest strategies, compare charts etc quickly. More quick now.
Example.
Bitcoin and NatGas, you do NOT need leverage...
optionsellers.com that somehow got surprised by Natgas volatility and squeezed, I think he did not bother doing this...
Happens all the time on NatGas, that "short seller catastrophy" that made the headlines was not even that big of a spike...
Plenty of way worse ones not long ago
HMA ATR Range v2In Alan Hull's books he talks about his 'range indicator' which is the HMA and ATR to give buy / hold / sell signals.
It is the HMA with the ATR SL with the Trend and (ATR multiplier * Period) + HMA for the TP (upper range)

HMA ATR RangeIn Alan's books he talks about his 'range indicator' which is the HMA and ATR to give buy / hold / sell signals. This is my version as he doesnt give the formula.
It is the HMA with the ATR added and subtracted and plotted above & below the HMA to create a range.
According to Alan's terminology: HMA = Central Cord, SL = Lower deviation, TP = Upper deviation

Combo Strategy 123 Reversal & Average True Range Trailing Stops This is combo strategies for get
a cumulative signal. Result signal will return 1 if two strategies
is long, -1 if all strategies is short and 0 if signals of strategies is not equal.
First strategy
This System was created from the Book "How I Tripled My Money In The
Futures Market" by Ulf Jensen, Page 183. This is reverse type of strategies.
The strategy buys at market, if close price is higher than the previous close
during 2 days and the meaning of 9-days Stochastic Slow Oscillator is lower than 50.
The strategy sells at market, if close price is lower than the previous close price
during 2 days and the meaning of 9-days Stochastic Fast Oscillator is higher than 50.
Secon strategy
Average True Range Trailing Stops Strategy, by Sylvain Vervoort
The related article is copyrighted material from Stocks & Commodities Jun 2009
WARNING:
- For purpose educate only
- This script to change bars colors.

ATR by ElecAverage True Range Trailing Stops Strategy
Typically, the Average True Range (ATR) is based on 14 periods and can be calculated on an intraday, daily, weekly or monthly basis. For this example, the ATR will be based on daily data. Because there must be a beginning, the first TR value is simply the High minus the Low, and the first 14-day ATR is the average of the daily TR values for the last 14 days. After that, Wilder sought to smooth the data by incorporating the previous period's ATR value.
Current ATR = / 14
- Multiply the previous 14-day ATR by 13.
- Add the most recent day's TR value.
- Divide the total by 14

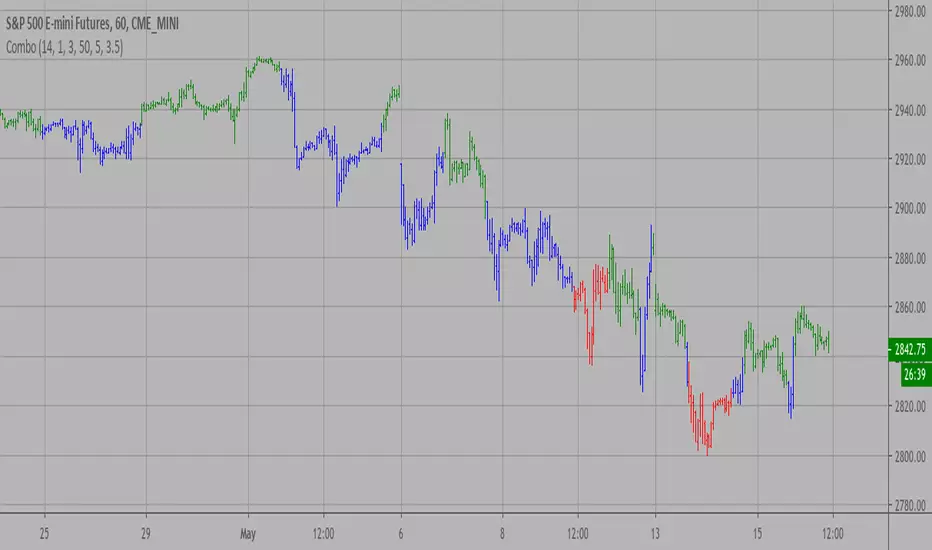
Super Moving Average
Plots one of several types of moving average types
Supports ATR/Kelter Channels
Supports Bollinger Bands
Velocity squeezes shown on the moving average to identify possible turning points
Supports ATR based stop for MA Trend Reversals
MA Trend reversal alert conditions
See related Moving Average Ribbon script.

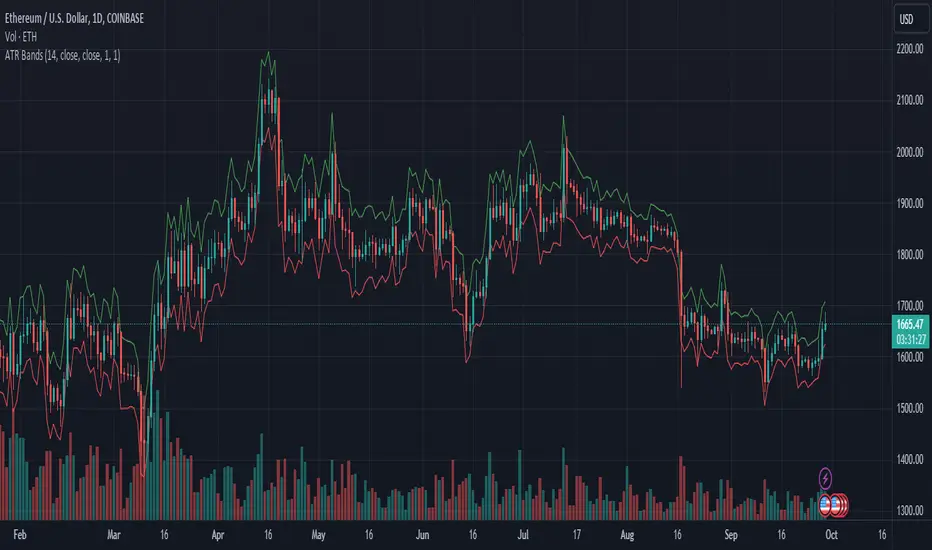
ATR BandsDisplays two bands above and below the source using the ATR. Comes with ATR multipliers for upper and lower bands.
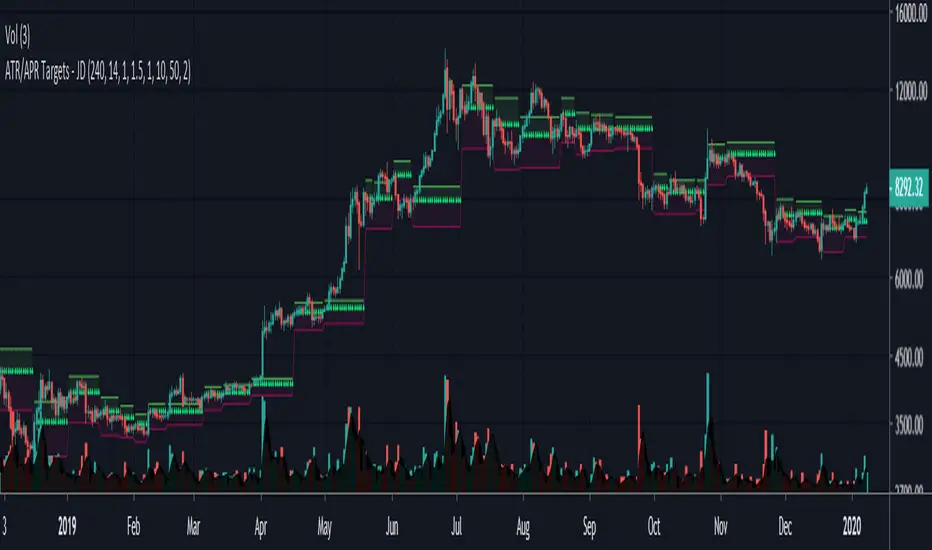
ATR Targets - JDA simple visual representation of ATR trading targets.
The indicator shows ATR targets (TP and SL) from the last swing points (if you entered there)
There is an option to chose targets for a long or short position.
JD.
#NotTradingAdvice #DYOR
I build these indicators for myself and provide them open source, to use for free to use and improve upon,
as I believe the best way to learn is toghether.


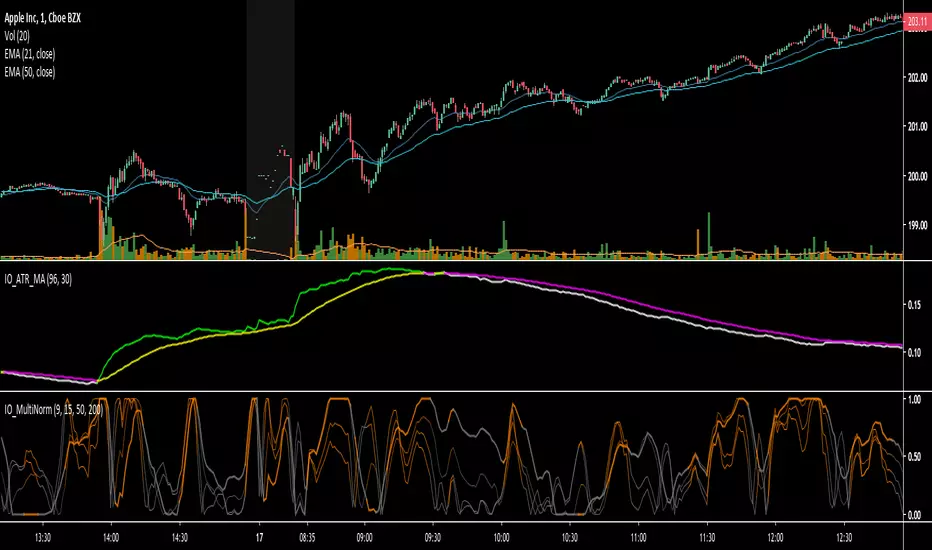
IO_ATR_MAThis is an ATR+MA indicator.. the general idea is:
- when ATR is higher than MA, volatility is high
- when ATR is lower than MA, volatility is low
ATR based Pivots mcbwHey everyone this is an exciting new script I have prepared for you.
I was reading an old forex bulletin article some time ago when I came across this: solar.murty.net (or you can download the full bulletin with lots of other good articles here: www.forexfactory.com).
You can already buy this for metatrader (www.mql5.com) so I figured to make it for free for tradingview.
This bulletin suggested that you can reasonably predict daily volatility by adding or subtracting multiples of the daily ATR to the daily opening. Using this you can choose multiples to use as price targets and alternatively as stop losses. For example, if you already have a sense of market direction you can buy at market open place a stop loss at - 1 daily ATR and a profit target at + 3 ATRs for a risk to reward ratio of 3. If you are looking for smaller/quicker moves with a ratio of 3 you can have a stop loss at -0.25 ATR and a take profit at +0.75 ATR.
Alternatively this article also suggests to use this method to catch volatility breakouts. If price is higher than the + 1 ATR area then you can safely assume it will be going to the +2 ATR area so you can put a buy stop at + 1 ATR with a profit target at + 2 ATR with a stop loss at +0.5 ATR to catch a volatility breakout with a risk to reward ratio of 2!
Even further there are methods that you can use with ATRs of multiple window sizes, for example by opening two copies of this indicator and measuring recent volatility with a 1 week window and long term volatility within a 1 month window. If the short term volatility is crossing the long term volatility then there is a high probability chance that even more price movement will occur.
However I have found that this method is good for more than daily volatility , it can also be used to measure weekly volatility , and monthly volatility and use these multiples as good long term price targets.
To select if you want daily, weekly, or monthly values of the ATR of volatility you're using go to the settings and click on the options in the "Opening period". The default window of the ATR here is 14 periods, but you can change this if you want to in "ATR period". Most importantly you are able to select which multiples of the ATR you would like to use in the settings in "ATR multiple 1" which is the green line, "ATR multiple 2" which is the blue line, and "ATR multiple 3" which is the purple line. You can select any values you want to put in these, the choice of 0.25, 0.5, and 1 is not special, some people use fibonacci numbers here or simply 0.33, 0.66, and 0.99.
Repainting issue: This script uses the daily value of the Average True Range (ATR), which measures the volatility that is happening today. If price becomes more volatile then the value of the ATR can increase throughout the day, but it can never decrease. What this means is that the ATR based pivots are able to expand away from the opening price, which should not affect the trades that you take based on these areas. If you base your take profit on one of these ATR multiples and the daily volatility increase this means that your take profit area will be closer to your entry than the ATR multiple. Meaning that your trades will be more conservative.
While this all may sound very technical it is super intuitive, throw this on your chart and play around with it :)
Happy trading!

Average True Range ShiftThis indicator builds on the idea of the Average True Range (ATR) as a way of measuring volatility. It uses two different ATRs to show a shift in market volatility.
It is mainly composed of two moving averages of ATR. One fast moving, which looks back at the previous 5 periods. One slow moving, which looks back at the previous 21 periods. Both ATRs have been normalized (show percentage instead of an absolute amount). The third component of this indicator is the histogram that is created by subtracting the slow moving average, from the fast moving average.
By having two ATRs of different lengths, traders can see how short term volatility compares to long term volatility, and how it is shifting over time. When the fast-moving crosses above the slow-moving, it will show a positive value on the histogram, meaning that short term volatility is increasing and higher than normal. When it crosses below, it will show a negative value on the histogram, meaning that short term volatility is decreasing, and lower than normal.
There are a variety of ways to utilize this indicator, and it will work in most markets. I find it is best to analyze macro market conditions on daily charts and above, rather than micro intraday moves.
