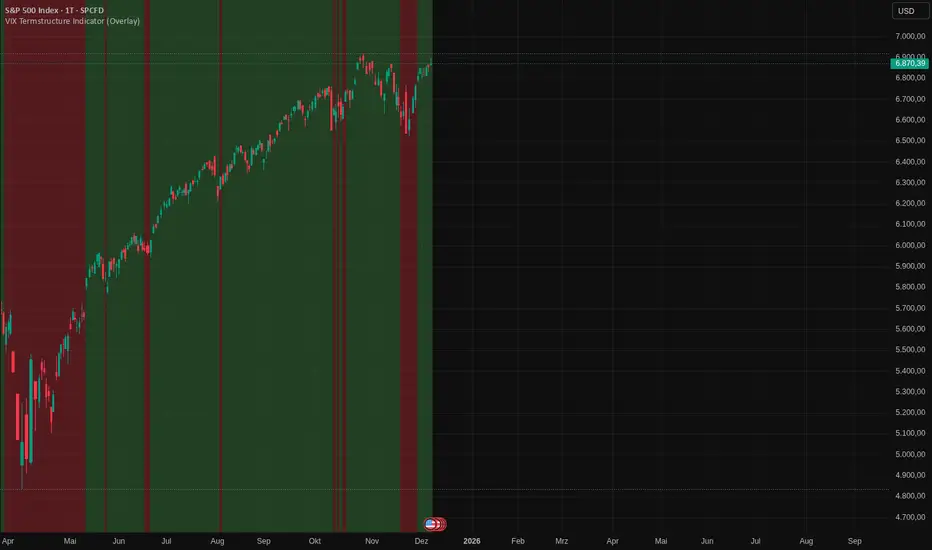
VIX Termstructure Indicator (Overlay)This indicator visualizes the VIX futures term structure directly on your chart background and highlights three key volatility regimes using color coding. It helps identify when the volatility curve is in normal contango, inverted (backwardation), or undergoing a curve flip between the front-month VIX futures.
What the indicator does
The script pulls and compares:
VIX spot index: VIX
Front-month VIX futures: VX1!
Second-month VIX futures: VX2!
All data is requested on the daily timeframe and used to classify the current volatility environment. The indicator then colors the background of your chart according to the detected VIX term structure:
Green background – Contango:
VIX spot is below the front-month futures (VIX < VX1!).
This is typically associated with more “normal” market conditions and lower perceived short-term stress.
Red background – Inverted curve (Backwardation):
VIX spot is above the front-month futures (VIX > VX1!).
This often signals elevated fear, stress, or risk-off conditions in the market.
Yellow background – Curve flip between VX1! and VX2!:
The front-month futures are trading above the second-month futures (VX1! > VX2!).
This can indicate a transition phase in the volatility term structure and may precede or accompany shifts in market sentiment.
How it works
The script fetches the daily close values of VIX, VX1!, and VX2!. It checks whether the front-month futures are above the second-month futures to detect a curve flip. It compares VIX with VX1! to determine if the curve is contango or inverted. Based on these conditions, the chart background is colored with a semi-transparent overlay:
Red has priority when VIX is above VX1! (inverted curve).
If not inverted, yellow is shown when a curve flip VX1! > VX2! is detected.
Otherwise, the background is green (normal contango).
Use cases
This overlay is designed as a context tool for indices, ETFs, Options, or individual stocks that are sensitive to volatility and risk sentiment. Typical applications include:
Identifying periods of heightened risk (red / inverted curve) to adjust position sizing or risk exposure.
Confirming risk-on environments (green / contango) where volatility is more contained.
Monitoring yellow curve-flip phases as potential early warnings of changing volatility regimes.
The indicator does not generate buy/sell signals on its own, but it can be a valuable regime filter or confirmation layer alongside other technical tools.
Notes
This is an overlay indicator: it colors the background of your active chart.
All VIX-related data is evaluated on the daily timeframe, regardless of the chart timeframe.
Make sure that the symbols VIX, VX1!, and VX2! are available on your broker/data feed in TradingView.
Backwardation
Contango/Backwardation Monitor
This is an indicator to display the spread difference between two products. I designed it around VX1! and VX2! but any other two products can be chosen. It is a simple subtraction of VX2-VX1. I will go through the options first and what they do followed by what contango/backwardation is in my own words. You will need the data package for VX futures for the default version to work.
INPUTS
-Apply Smoothing: choose to apply smoothing or not.
-Smoothing Method: choose between SMA,EMA,WMA, etc.
-Line Width: Width of line if line is chosen style(can be changed in style section)
-Threshold 1-5: This is the level at which the line will change colors(defaults are for VX)
-Color 1-5: The color the line will change to when crossing threshold.
Towards Backwardation: Background color change when line is slanted down
Towards Contango: Background color change when line is slanted up
Bars to Confirm Trend: This is my method to cut down on background color changes. It is how many bars consecutive going back needed to change color.
STYLE
-All colors and whatnot can be changed here(threshold colors can be changed here or on the input page).
T1 Line-T5 line: These are simple horizontal lines that can be used to denote threshold areas or whatever you want.
Contango/Backwardation-These terms are used mostly with futures to define the calendar spread between two contracts. Contango is when that spread is is getting longer and backwardation is when that spread is closing. In terms of VIX futures, Contango would imply that volatility is stabilizing and the S and P will likely gain. Backwardation, woudl eb the opposite.
The most simple way to read this indicator with default settings- If the line is up, red, and the background is red, then you can assume S and P prices are going down. And if the opposite is true, then prices are likely going up.
Please feel free to ask any questions and I will do my best to answer them.

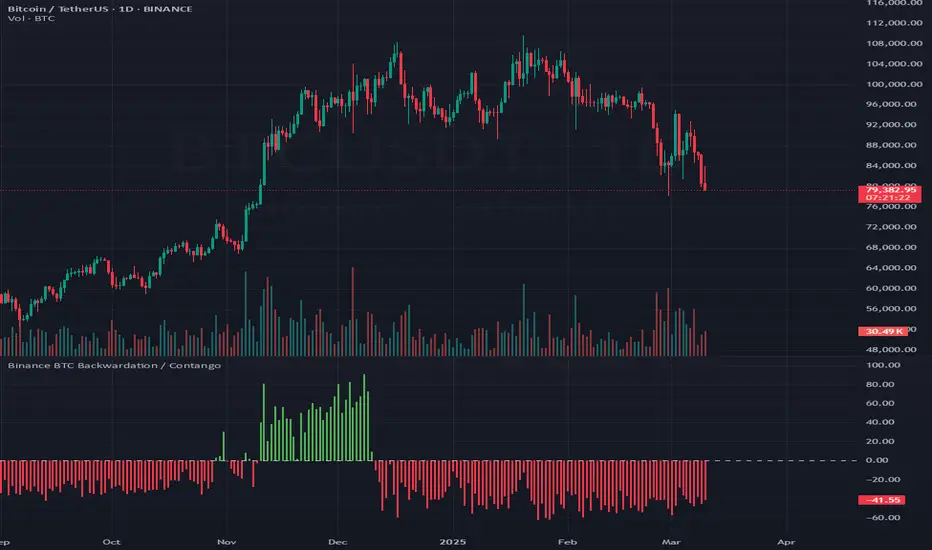
Binance BTC Backwardation / ContangoThis indicator calculates difference between price of Binance BTCUSDT, and Binance BTCUSDT.P.
If the difference is negative, then it is backwardation.
If the difference is positive, then it is contango.
Celestial Pair Spread Hello friends, after a very long time!
Today, I tried to put into code an idea that came to my mind spontaneously and suddenly.
Note :
This script is experimental and improvable.
I haven't had a chance to try it yet.
TIMEFRAME : 1D (Daily Bars)
CELESTIAL SPREAD
The spread moves in a very limited area and is consistent within itself, especially on days far from the end of the contract.
That's why there is a reassuring sky atmosphere. That's why this name was given completely improvised.
Basic logic of the script
We enter the name of the CME Futures contract we want to enter:
Ex : CL1! , ES1! , ZC1! , NQ1!
The script creates us a pair trade parity divided into secondary contracts.
Example : ES1!/ES2!
What is pair trading?
I will explain briefly here.
For users who are wondering:
www.investopedia.com
Let's get back to our topic.
Now we have created a parity that does not actually exist.
This parity is the manifestation of the relative movements of two contracts.
When the parity rises, ES1! increased,ES2! has fallen.
In the opposite case, We can say: ES1! Contract has been dropped ES2! has increased.
Pair trading is generally a trade that needs to be kept in mind from time to time.
It is a method preferred by professionals who can process very quickly.
Market risk is minimal, but since 2 contracts are purchased, more money is paid and very low percentage profits are made.
It is very expensive to do pair trading, especially with oil and its derivatives and interest security derivatives.
The contract we are considering has micros. (small-item contracts tied to the same value)
So when we switch to our broker MES1!/MES2! We will trade.
For all CME futures :
www.cmegroup.com
Anyway, let's continue:
The script created the parity showing its relationship with the next contract and plotted it as bars.
Celestial bands are just like Bollinger bands, but they consist of 3 bands based on percentage changes rather than standard deviation.
The middle band is obtained from moving averages.
The upper and lower bands are the middle band subjected to a threshold value.
The threshold value can be changed.
0.15 percent was charged for this script.
CAUTION :
As can be seen in the example below;
The most important thing is not to make any transactions when the contract switch dates are approaching.
Therefore, it is recommended to use it just below the main chart.
The blue bars in the parity are
Values that outside the upper and lower threshold values are colored blue.
For this condition
Alerts has been added.
Don't forget to add alert and edit.
MAIN PURPOSE
It is aimed to start a pair trade when such conditions come and to quickly close the trades when the parity basis reaches the value.
OTHER IMPORTANT POINTS
Other issues are broker related issues.
Difference between initial margins and maintanence margins of contracts (between 1! and 2!)
It shouldn't be too high.
The commission should not be too high.
Leverage must be high because the profit percentage is very low.
To calculate leverage you must divide your contract size by the relevant margin requirement.
Sample margin requirement table:
www.interactivebrokers.com
RISKS
It is an experimental and intellectual script,
the risk of contract price differences (maybe it will not leave a profit except for very extreme values)
I remind you of the quickness risk that comes from a two-legged trade.
Alerts definitely synchronized with an audible alert sent to a smartphone as an e-mail notification and displayed on the locked screen for quick action.
Best regards!

Forward Curve Visualization ToolProvide the spot symbol and the futures product root, and the script automatically scans all relevant contracts for you—no more tedious manual searches. The result is a clean, intuitive chart showing the live forward curve in real time.
It also detects contango or backwardation conditions (based on spot < F1 < F2 < F3).
Future Features:
Plot historical snapshots of the curve (1 day, 1 week, or 1 month ago) to understand market trends over time.
Display additional metrics such as annualized basis, cost of carry (CoC), and even volume or open interest for deeper insights.
If you trade futures and watch the forward curve, this script will give you the actionable data you need and get more ideas or features you’d like to see. Let’s build them together!
Disclaimer
Please remember that past performance may not be indicative of future results.
Due to various factors, including changing market conditions, the strategy may no longer perform as well as in historical backtesting.
This post and the script don’t provide any financial advice.

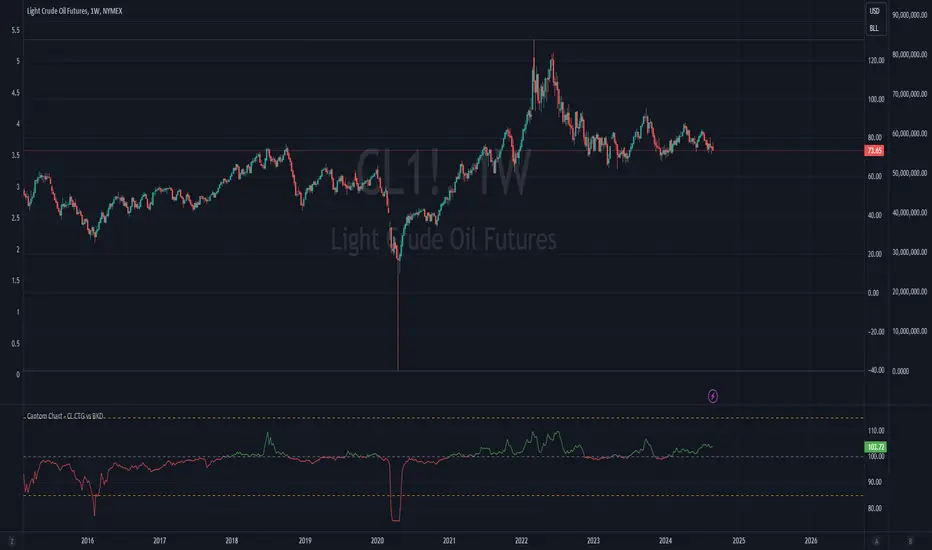
Cantom Chart - CL CTG vs BKDEnglish : This Pine Script indicator, named "Cantom Chart - CL CTG vs BKD," uniquely analyzes the immediate state of oil futures contracts to determine if they are in contango or backwardation. The script uses the price ratio between the nearest (CL1) and the next nearest (CL2) NYMEX crude oil futures contracts. It multiplies this ratio by 100 for clarity and scales fluctuations for enhanced visibility.
Key Features:
Dynamic Ratio Calculation: Computes the ratio (CL1/CL2 * 100) to determine the immediate market state.
Market State Interpretation: A ratio above 100 indicates backwardation, suggesting higher demand than supply, while a ratio below 100 indicates contango, suggesting higher supply than demand.
Volatility Adjustment: Amplifies market state changes by tripling the deviation from the baseline of 100, making it easier to observe subtle shifts.
Anomaly Detection: Caps the adjusted ratio at 125 for highs and 75 for lows, maintaining these limits until the ratio returns to normal levels.
Usage: This indicator is especially useful for traders analyzing supply-demand dynamics and inflationary pressures in the oil market. To apply it, simply add the script to your TradingView chart and adjust the 'Lower Threshold' and 'Upper Threshold' lines as needed based on your trading strategy.
-----
日本語 : この「Cantom Chart - CL CTG vs BKD」Pine Scriptインジケーターは、直近の原油先物契約がコンタンゴまたはバックワーデーションにあるかを特定するための独自の分析を提供します。最近の(CL1)と次の(CL2)NYMEX原油先物契約間の価格比を使用し、この比率に100を掛けて明確性を高め、変動の視認性を向上させます。
主要機能:
動的比率計算: 市場の即時状態を判断するために比率(CL1/CL2 * 100)を計算します。
市場状態の解釈: 比率が100を超える場合はバックワーデーション(需要が供給を上回る)、100未満の場合はコンタンゴ(供給が需要を上回る)を示します。
変動調整: 基準値100からの偏差を3倍にして、微妙な変化を容易に観察できるようにします。
異常値検出: 調整された比率を高値で125、低値で75に制限し、通常のレベルに戻るまでこれらの限界を維持します。
使用方法: このインジケーターは、原油市場における需給ダイナミクスとインフレ圧力を分析するトレーダーにとって特に有用です。使用するには、このスクリプトをTradingViewチャートに追加し、トレーディング戦略に基づいて「Lower Threshold」と「Upper Threshold」のラインを必要に応じて調整します。
Binance Auto Spot-Futures Premium/Discount -CheThis Script is based in the 2020 @Plumptoiletduck script
Special thanks to @tartigradia for the Auto Detect code for the Binance pair.
It tells us the difference in price between Spot and Perpetual Futures.
Now I incorporated the function that automatically detects the pair we are in to show the premium/discount of that pair.
You never need to select the currency you are in the script anymore!
It is specially designed for Binance coins, it includes all perpetuals.
How to use it?
Usually if the Futures are higher than the Spot it indicates that we are in an over exposure zone of longs in futures.
If the spot is cheaper than the futures it means that the futures are more fearful.
You can use this script with an Open Interest script to get an idea of what is going on.
Other examples:
Cash VIX Term StructureLet’s first start with some definitions:
VIX9D: The CBOE S&P 500 9-Day Volatility Index estimates the expected 9-day volatility of S&P 500® stock returns.
www.cboe.com
VIX: The CBOE Volatility Index® (VIX® ) is considered by many to be the world's premier barometer of equity market volatility. The VIX Index is based on real-time prices of options on the S&P 500® Index (SPX) and is designed to reflect investors' consensus view of future (30-day) expected stock market volatility. The VIX Index is often referred to as the market's "fear gauge".
www.cboe.com
VIX3M: The CBOE 3-Month Volatility Index is designed to be a constant measure of 3-month implied volatility of the S&P 500® (SPX) Index options.
www.cboe.com
VIX6M: The CBOE S&P 500 6-Month Volatility Index is an estimate of the expected 6-month volatility of the S&P 500® Index.
www.cboe.com
VIX1Y: The CBOE S&P 500 1-Year Volatility Index is an estimate of the expected 1-Yeaer volatility of the S&P 500® Index.
www.cboe.com
This indicator visually displays the relationship between all the above products (short term vol vs long term vol). It also displays the current value and daily percentage change.
The shape of the term structure can tell us a lot about the market:
When the slope of the term structure is upward sloping (longer term VIX are higher than shorter term VIX), we say the term structure is in contango. This usually means that market is stable.
When the slope of the term structure is downward sloping (longer term VIX are lower than shorter term VIX), we say the term structure is in backwardation. This usually happens in periods of extreme market volatility.
Sometimes VIX9D will be higher than VIX but the rest of the curve is in contango. This means that there might be some event in the next 9 days that we need to pay attention to.
I also added a few ratios that I personally track like VIX9D/VIX, VIX/VIX3M and VIX/VIX6M.
When trading short term, I tend to focus on the front end of the curve. When trading long term, I tend to look at VIX/VIX6M.
In addition to the ratios, I added some historical parameters (lookback date can be set from the indicator’s settings) like Highest Value, Lowest Value, Percentile Rank, Average, Median and Mode.
Percentile ranks are displayed for both individual products and their ratios (that’s how I like to see them).
I hope you guys like this indicator.
Happy trading!

Crude Oil: Backwardation Vs ContangoCrude Oil, CL
Plots Futures Curve: Futures contract prices over the next 3.5 years; to easily visualize Backwardation Vs Contango(carrying charge) markets.
Carrying charge (contract prices increasing into the future) = normal, representing the costs of carrying/storage of a commodity. When this is flipped to Backwardation(As the above; contract prices decreasing into the future): it's a bullish sign: Buyers want this commodity, and they want it NOW.
Note: indicator does not map to time axis in the same way as price; it simply plots the progression of contract months out into the future; left to right; so timeframe DOESN'T MATTER for this plot
TO UPDATE (every year or so): in REQUEST CONTRACTS section, delete old contracts (top) and add new ones (bottom). Then in PLOTTING section, Delete old contract labels (bottom); add new contract labels (top); adjust the X in 'bar_index-(X+_historical)' numbers accordingly
This is one of several similar Futures Curve indicators: Meats | Metals | Grains | VIX | Crude Oil
If you want to build from this; to work on other commodities; be aware that Tradingview limits the number of contract calls to 40 (hence the multiple indicators)
Tips:
-Right click and reset chart if you can't see the plot; or if you have trouble with the scaling.
-Right click and add to new scale if you prefer this not to overlay directly on price. Or move to new pane below.
-If this takes too long to load (due to so many security calls); comment out the more distant future half of the contracts; and their respective labels. Or comment out every other contract and every other label if you prefer.
--Added historical input: input days back in time; to see the historical shape of the Futures curve via selecting 'days back' snapshot
updated 20th June 2022
© twingall

VIX: Backwardation Vs ContangoVIX: Backwardation Vs Contango
Quickly visualize Contango vs Backwardation in the S&P 500 Volatility Index by plotting the prices of the futures contracts over the next 9 months
Note: indicator does not map to time axis in the same way as price; it simply plots the progression of contract months out into the future; left to right; so timeframe DOESN'T MATTER for this plot
TO UPDATE(every few months recommended): in REQUEST CONTRACTS section, delete old contracts (top) and add new ones (bottom). Then in PLOTTING section, Delete old contract labels (bottom); add new contract labels (top); adjust the X in 'bar_index-(X+_historical)' numbers accordingly
This is one of several similar indicators: Meats | Metals | Grains | VIX
Tips:
-Right click and reset chart if you can't see the plot; or if you have trouble with the scaling.
-Right click and pin to Scale A to plot on the same scale as price
--Added historical input: input days back in time; to see the historical shape of the Futures curve via selecting 'days back' snapshot
updated 15th June 2022
© twingall

Metals:Backwardation/ContangoMETALS: Gold , Silver , Copper ( GC , SI, HG)
Quickly visualize carrying charge market vs backwardized market by comparing the price of the next 2 years of futures contracts.
Carrying charge (contract prices increasing into the future) = normal, representing the costs of carrying/storage of a commodity. When this is flipped to Backwardation (contract prices decreasing into the future): its a bullish sign: Buyers want this commodity, and they want it NOW.
Note: indicator does not map to time axis in the same way as price; it simply plots the progression of contract months out into the future; left to right; so timeframe DOESN'T MATTER for this plot
There's likely some more efficient way to write this; e.g. when plotting for Gold ( GC ); 21 of the security requests are redundant; but they are still made; and can make this slower to load
TO UPDATE(once a year will do): in REQUEST CONTRACTS section, delete old contracts (top) and add new ones (bottom). Then in PLOTTING section, Delete old contract labels (bottom); add new contract labels (top); adjust the X in 'bar_index-(X+_historical)' numbers accordingly
This is one of three similar indicators: Meats | Metals | Grains
-If you want to build from this; to work on other commodities ; be aware that Tradingview limits the number of contract calls to 40 (hence the 3 seperate indicators)
Tips:
-Right click and reset chart if you can't see the plot; or if you have trouble with the scaling.
-Right click and add to new scale if you prefer this not to overlay directly on price. Or move to new pane below.
--Added historical input: input days back in time; to see the historical shape of the Futures curve via selecting 'days back' snapshot
updated 15th June 2022
© twingall

Grains:Backwardation/ContangoGRAINS: Wheat , Soybeans , Corn (ZW, ZS, ZC )
Quickly visualize carrying charge market vs backwardized market by comparing the price of the next 2 years of futures contracts.
Carrying charge (contract prices increasing into the future) = normal, representing the costs of carrying/storage of a commodity. When this is flipped to Backwardation (contract prices decreasing into the future): its a bullish sign: Buyers want this commodity, and they want it NOW.
The above chart shows a nice example of backwardation.
Note: indicator does not map to time axis in the same way as price; it simply plots the progression of contract months out into the future; left to right; so timeframe DOESN'T MATTER for this plot
There's likely some more efficient way to write this; e.g. when plotting for Wheat (ZW); 15 of the security requests are redundant; but they are still made; and can make this slower to load
TO UPDATE(once a year will do): in REQUEST CONTRACTS section, delete old contracts (top) and add new ones (bottom). Then in PLOTTING section, Delete old contract labels (bottom); add new contract labels (top); adjust the X in 'bar_index-(X+_historical)' numbers accordingly
This is one of three similar indicators: Meats | Metals | Grains
-If you want to build from this; to work on other commodities ; be aware that Tradingview limits the number of contract calls to 40 (hence the 3 seperate indicators)
Tips:
-Right click and reset chart if you can't see the plot; or if you have trouble with the scaling.
-Right click and add to new scale if you prefer this not to overlay directly on price. Or move to new pane below.
--Added historical input: input days back in time; to see the historical shape of the Futures curve via selecting 'days back' snapshot
updated 15th June 2022
© twingall

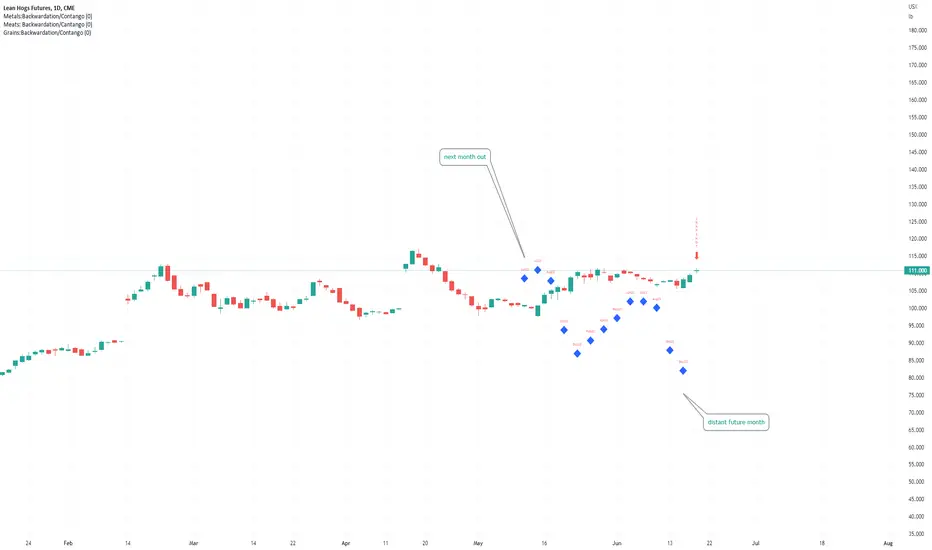
Meats: Backwardation/CantangoMEATS: Live Cattle , Feeder Cattle, Lean Hogs (LE, GF , HE)
Quickly visualize carrying charge market vs backwardized market by comparing the price of the next 2 years of futures contracts.
Carrying charge (contract prices increasing into the future) = normal, representing the costs of carrying/storage of a commodity. When this is flipped to Backwardation (contract prices decreasing into the future): its a bullish sign: Buyers want this commodity, and they want it NOW.
Note: indicator does NOT map to time axis in the same way as price; it simply plots the progression of contract months out into the future; left to right; so timeframe DOESN'T MATTER for this plot
There's likely some more efficient way to write this; e.g. when plotting for Live Cattle (LE); 8 of the security requests are redundant; but they are still made; and can make this slower to load
TO UPDATE(once a year will do): in REQUEST CONTRACTS section, delete old contracts (top) and add new ones (bottom). Then in PLOTTING section, Delete old contract labels (bottom); add new contract labels (top); adjust the X in 'bar_index-(X+_historical)' numbers accordingly
This is one of three similar indicators: Meats | Metals | Grains
-If you want to build from this; to work on other commodities ; be aware that Tradingview limits the number of contract calls to 40 (hence the 3 seperate indicators)
Tips:
-Right click and reset chart if you can't see the plot; or if you have trouble with the scaling.
-Right click and add to new scale if you prefer this not to overlay directly on price. Or move to new pane below.
--Added historical input: input days back in time; to see the historical shape of the Futures curve via selecting 'days back' snapshot
updated 15th June 2022
© twingall
BTC Weighted Agg. Basis [Overlay] [Moto]Hello traders,
This script shows the exchange volume-weighted aggregate basis for Bitcoin. This is the accompanying overlay version of the script which shows plotshapes according to the specified levels of aggregate contango or backwardation.
Exchanges have differing significance to the traded price of BTC and so this script calculates the respective volume and price of the major exchanges to more accurately represent the difference between the markets spot price and the markets perpetual future/swap price.
Spot references:
Coinbase
Bitfinex
Binance
Bitstamp
FTX
OKex
Huobi
Bybit
Perp references:
Bitfinex
Binance
FTX
OKex
Huobi
Bybit
Deribit
There are options in the settings to use either basis point scaling or %, though the color bracketing is set to basis points by default.
Users can change the candle close resolution to see a larger/smaller time frame data set.
An important feature is the ability to filter the barcolor on the chart to filter only for basis increase or decrease depending on the influence of spot buying or selling.
As of publishing, the barcoloring is set to only display when you're on a common BTC spot or BTC perp chart. This is to avoid confusion.
Thanks

BTC Weighted Agg. Basis [Osc] [Moto]Hello traders,
This script shows the exchange volume-weighted aggregate basis for Bitcoin.
Exchanges have differing significance to the traded price of BTC and so this script calculates the respective volume and price of the major exchanges to more accurately represent the difference between the markets spot price and the markets perpetual future/swap price.
Spot references:
Coinbase
Bitfinex
Binance
Bitstamp
FTX
OKex
Huobi
Bybit
Perp references:
Bitfinex
Binance
FTX
OKex
Huobi
Bybit
Deribit
There are options in the settings to use either basis point scaling or %, though the color bracketing is set to basis points by default.
Users can change the candle close resolution to see a larger/smaller time frame data set.
An important feature is the ability to filter the barcolor on the chart to filter only for basis increase or decrease depending on the influence of spot buying or selling.
As of publishing, the barcoloring is set to only display when you're on a common BTC spot or BTC perp chart. This is to avoid confusion.
Thanks

BTC Futures BasisShows various basis percentages in a table and plots historical basis. Also has an alert function for backwardation events. Useful for tracking bullish/bearish sentiment in BTC futures markets.
*Currently displays March and June futures for the following exchanges: Bitmex, Binance, Deribit, Okex, and FTX
Also displays CME Continuous Next Contract. All of the symbols are customizable.
-----------
Market-wide backwardation usually occurs during a heavy sell-off (such as a liquidation cascade).
**For getting alerts of backwardation events, I recommend creating an alert on the 1 minute chart with the condition "Any alert() function call". Alert level is customizable as well.
-----------
*NOTE!! : Futures contracts expire (obviously), so the contract symbols will need to be updated periodically. I will try to keep them updated going into the future.
**NOTE2!! : The alert() function does not track the CME contract. This is to avoid false triggers.

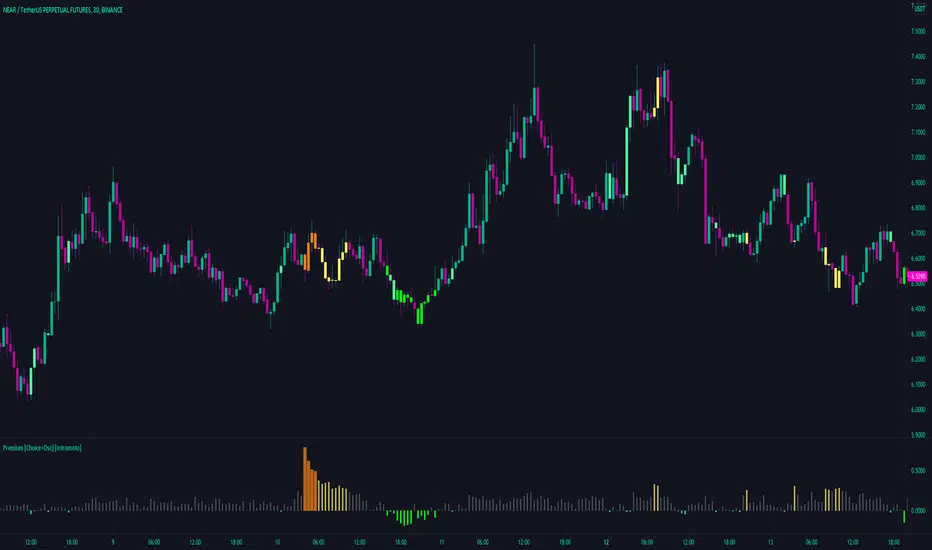
Premium [Choice+Osc] [Intromoto]This indicator shows the % premium between spot and index price of any two assets.
There are both a true and false overlay version of this indicator, this is the oscillator version.
IMPORTANT: This oscillator is different from the other related oscillator, because this does not automatically change the assets for premiums, you will have to MANUALLY type in the tickers for the comparison. i.e BINANCE:ETHUSDTPERP/BINANCE:ETHUSDT. This allows you to play potential correlations between assets via premium/funding, regardless of exchange. The underlying asset should to be in the first text field, otherwise the readings will be reversed. Assets with large price differences will not have actionable readings on the oscillator.
The histogram simply plots the percent difference, either positive, "Contango", or negative, "Backwardation" between any two assets. The colors are traditionally self explanatory, green is bullish /buy, red is bearish /sell . These values can be used real time to help in determining the predicted funding rate of the perpetual, which in turn may affect sentiment.
I've included user input capabilities so that the user can change the bracketing of which values the colors appear for the barcolors and plotshapes. These are broken up into uber backwardation, backwardation, low premium, regular premium, medium premium, high premium, and uber high premium.
Tweaks or changes may need to be made if trading altcoins for more actionable settings, as the default are designed for mainly BTC premium, but others will work well enough as is for the most part.
If the derivative is slightly above the spot price, funding is likely to be positive, i.e. "normal", if spot is above the derivative, it's usually bullish , but as always, market structure and confluence should be found for better outcomes.
An important feature I've added is the ability to change the resolution of the candle closes in the premium calculations. For example, if you want to take trades based on 5, 15, 60, etc closes, you can set the indicator to show those specific time frame premium values.
This oscillator will automatically change the candles whichever color is set to each of the relevant premium bracket values. I've also included the Binance funding periods as background colors, which may aid in confluence.
DM for access.
Thanks
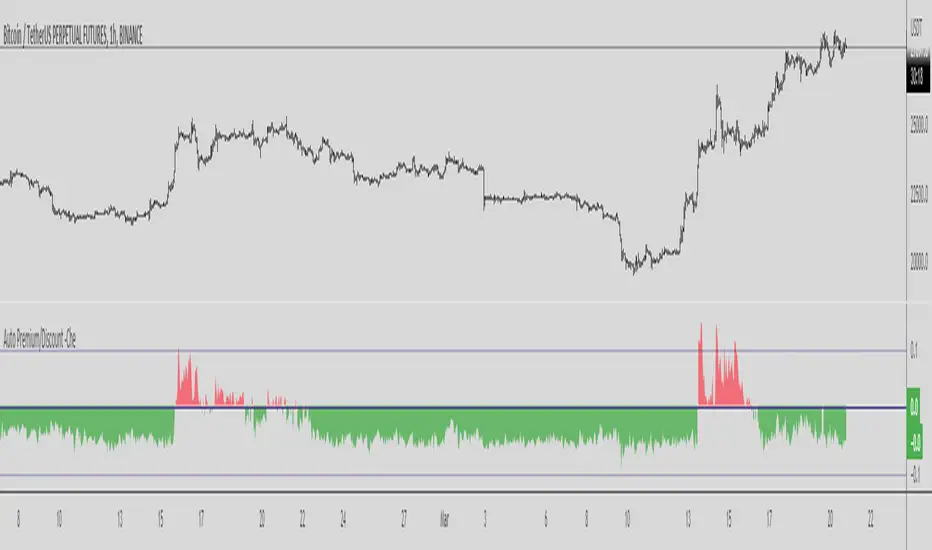
Premium [Auto+Overlay] [Intromoto]This indicator shows the premium between spot and index price, specifically on Binance USDT pairs against Binance USDT Perpetual contracts.
There are both a true and false overlay version of this indicator, as seen in the pic.
IMPORTANT: This indicator will automatically change to the appropriate asset, but ONLY if the observed chart is a Binance PERP. For example: If my chart is on BINANCE:ETHUSDTPERP the indicator knows that you want to compare it to the BINANCE:ETHUSDT spot value. No need to manually change anything. Other pairs will be added as they are listed on Binance. I'll also be updating this indicator as I see fit.
The histogram simply plots the percent difference, either positive, "Contango", or negative, "Backwardation". The colors are traditionally self explanatory, green is buy, red is bearish. These values can be used real time to help in determining the predicted funding rate of the perpetual, which in turn may affect the price.
I've included user input capabilities so that the user can change the bracketing of which values the colors appear for the barcolors and plotshapes. These are broken up into backwardation, low premium, regular premium, medium premium, and high premium.
Tweaks or changes will likely need to be made if trading altcoins for more actionable settings, as the default are designed for mainly BTC premium, but others will work well enough as is for the most part.
If the perpetual is above the spot price, funding will be positive, i.e. "normal", if spot is above the perpetual, it's usually bullish, but as always, market structure and confluence should be found for better outcomes.
An important feature I've added is the ability to change the resolution of the candle closes in the premium calculations. For example, if you want to take trades based on 5, 15, 60, etc closes, you can set the indicator to show those specific time frame premium values.
Plotshapes have been included in this true overlay version, which will change color and placement accordingly. I've also included the Binance funding periods as background colors, which may aid in confluence.
I may be making a version for bybit and other exchange soon, including a version that allows the user to manually type in any two assets for premium comparison.
DM for access.
Thanks

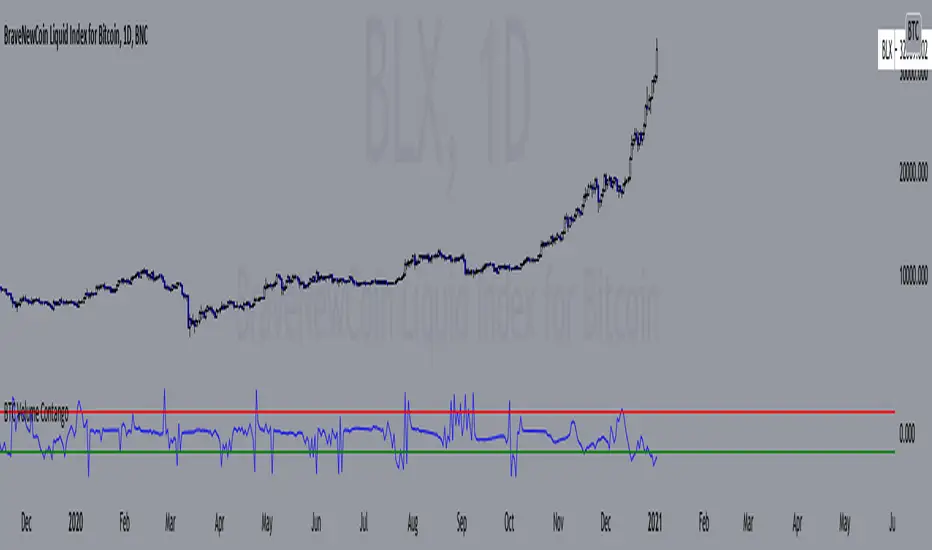
BTC Volume Contango IndexBased on my previous script "BTC Contango Index" which was inspired by a Twitter post by Byzantine General:
This is a script that shows the contango between spot and futures volumes of Bitcoin to identify overbought and oversold conditions. When a market is in contango, the volume of a futures contract is higher than the spot volume. Conversely, when a market is in backwardation, the volume of the futures contract is lower than the spot volume.
The aggregate daily volumes on top exchanges are taken to obtain Total Spot Volume and Total Futures Volume. The script then plots (Total Futures Volume/Total Spot Volume) - 1 to illustrate the percent difference (contango) between spot and futures volumes of Bitcoin. This data by itself is useful, but because aggregate futures volumes are so much larger than spot volumes, no negative values are produced. To correct for this, the Z-score of contango is taken. The Z-score (z) of a data item x measures the distance (in standard deviations StdDev) and direction of the item from its mean (U):
Z-score = (x - U) / StDev
A value of zero indicates that the data item x is equal to the mean U, while positive or negative values show that the data item is above or below the mean (x Values of +2 and -2 show that the data item is two standard deviations above or below the chosen mean, respectively, and over 95.5% of all data items are contained within these two horizontal references). We substitute x with volume contango C, the mean U with simple moving average ( SMA ) of n periods (50), and StdDev with the standard deviation of closing contango for n periods (50), so the above formula becomes: Z-score = (C - SMA (50)) / StdDev(C,50).
When in contango, Bitcoin may be overbought.
When in backwardation, Bitcoin may be oversold.
The current bar calculation will always look incorrect due to TV plotting the Z-score before the bar closes.
BTC Contango IndexInspired by a Twitter post by Byzantine General:
This is a script that shows the contango between spot and futures prices of Bitcoin to identify overbought and oversold conditions. Contango and backwardation are terms used to define the structure of the forward curve. When a market is in contango, the forward price of a futures contract is higher than the spot price. Conversely, when a market is in backwardation, the forward price of the futures contract is lower than the spot price.
The aggregate prices on top exchanges are taken and then averaged to obtain a Spot Average and a Futures Average. The script then plots (Futures Average/Spot Average) - 1 to illustrate the percent difference (contango) between spot and futures prices of Bitcoin.
When in contango, Bitcoin may be overbought.
When in backwardation, Bitcoin may be oversold.

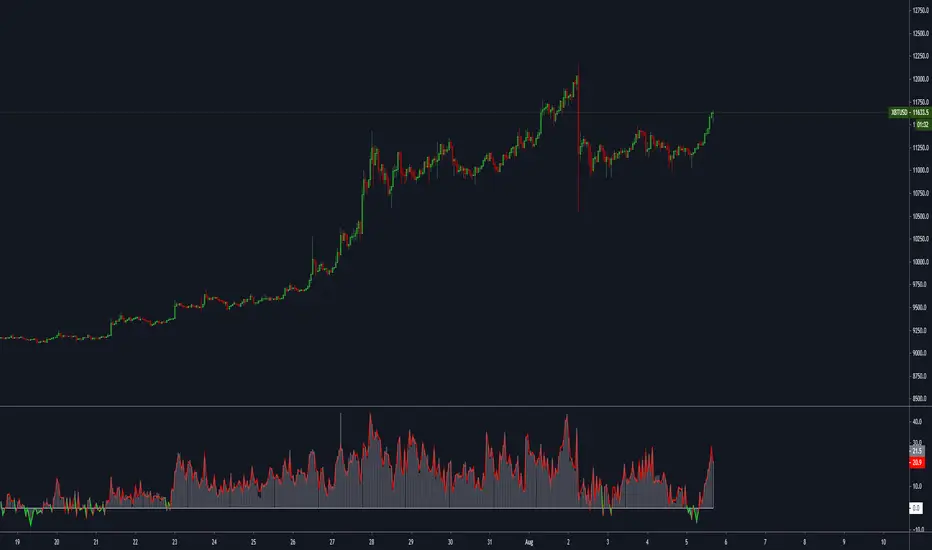
Discount/Premium that actually mattersOKEX/HUOBI compared to XBT price, discount and premium indicates reversals in price dependent on market phase.
DM for access.
VIX futures Backwardation/Contango strategyVery basic strategy that goes long on a VIX ETF whenever the futures curve shows signs of backwardation and gets out when it shows signs of contango. Makes no effort whatsoever to avoid getting faked out by monthly futures rollover.
Surprisingly good at not incinerating money while still providing diversification benefits in a long SPY portfolio. Useful for demonstrating the benefits of including VIX futures to hedge an actively managed portfolio.
Can be set to get out if the VIX goes below the lowest value of the last 3 candles, in which case it spends less time in the market but seems to actually make a bit of money over the past decade, though the only intent of this script is to make it not lose money.

Futures/Perpetuals DeltaBackwardation/Contango of OKEX, HUOBI, BITMEX, DERIBIT futures compared to XBTUSD.
Results indicate that backwardation can mark bottoms in price action.
