Băng tần và kênh

AutoTrader v3.0[by Irum]1. 스크립트 목적 / 정의
1-1. 한글 설명
이 스크립트의 목적
15분봉 BTC/USDT 같은 레버리지/선물 환경에서,
“EMA 재돌파 + BB 스퀴즈 국면”에서만 진입하고,
상위 추세(레짐 필터) + ATR 기반 리스크/수량 + ATR 트레일링 + 부분청산을 한 번에 관리하는 “올인원 자동 전략”입니다.
핵심 특징:
진입 로직
EMA(기본 9) 를 기준으로
종가가 EMA를 위로 돌파(골든크로스) & BB 폭이 좁을 때 → Long 진입 후보
종가가 EMA를 아래로 돌파(데드크로스) & BB 폭이 좁을 때 → Short 진입 후보
이걸 “Re-break + Squeeze” 구조로 설계해서,
변동성이 줄었다가 방향이 다시 나오려는 시점만 노립니다.
레짐 필터(Regime Filter)
상위 타임프레임(기본 1시간봉 HTF EMA 200)의 기울기와
ATR 빠른 선/느린 선으로
상승 추세 + 변동성 살아있는 구간만 Long 허용
하락 추세 + 변동성 살아있는 구간만 Short 허용
즉, 역추세 매매를 최대한 차단하고, 추세 방향만 따라갑니다.
Pivot 기반 손절 + ATR 리스크 기반 수량(ATR Sizing v2.1)
최근 swing low/high(피벗) 또는 일정 구간 fallback low/high를 기준으로 기술적 손절선을 잡고,
그 손절까지의 거리를 이용해,
“한 번의 손절 시 계좌의 riskPct%만 잃도록” 수량을 자동 계산합니다.
ATR 스파이크(갑작스러운 변동성 폭발) 구간은 진입 자체를 피하려고 합니다.
R-multiple 기반 TP + 부분 청산 + ATR Ladder 트레일링
진입 시점의 위험(R = Entry - SL) 을 기준으로
R 배수 기준 부분청산(예: 1R에서 50% 청산)
R 배수 기준 최종 TP(예: 2R)
포지션이 잘 가면 ATR 기반 트레일링 스탑(ATR Ladder) 을 적용해서,
이익 구간에서 손절선을 점점 끌어올려 BE(본전 이상) → 수익 보호 모드로 전환합니다.
세션 필터 / 뉴욕 뉴스피크 회피용 세션 회피
사용자가 정한 세션 안에서만 매매하거나,
특정 뉴스 타임(예: CPI, FOMC 근처 시간대)을 회피하도록 시간대를 차단할 수 있습니다.
1-2. English Description
Purpose
This strategy is an all-in-one auto-trading system designed mainly for leveraged/futures markets (e.g., BTC/USDT 15m) that:
Enters only on EMA re-break + Bollinger Band squeeze
Uses higher timeframe regime filter for trend direction
Sizes positions with ATR-based risk (v2.1)
Manages exits with R-multiple partial TP + final TP + ATR ladder trailing stop
Key points:
Entry Logic
Uses a fast EMA (default 9).
When price crosses above EMA and BB width is below threshold (squeeze) → Long signal.
When price crosses below EMA and BB width is below threshold → Short signal.
So it focuses on volatility contraction → re-expansion setups.
Regime Filter
Uses HTF EMA (default 200 EMA on 60m) slope + fast vs slow ATR:
Only allow long trades in uptrend + active volatility
Only allow short trades in downtrend + active volatility
This is to avoid counter-trend trading and align with macro trend.
Pivot-based SL + ATR Sizing v2.1
Sets SL using recent pivot highs/lows with a minimum buffer.
Computes risk per unit and chooses quantity so that riskPct % of equity is lost at SL.
Filters out trades during ATR spikes (abnormally large volatility).
R-multiple TP + Partial + ATR Ladder Trailing
Uses the initial risk (R) to:
Take partial profit at partialRR R (e.g., 1R at 50% size).
Set final TP at finalRR R or a fixed % TP.
Uses ATR ladder trailing to progressively tighten stops as price moves in favor.
Session / News Avoidance
Optionally trade only inside a custom session,
Or avoid specific time windows (e.g., high-impact news).

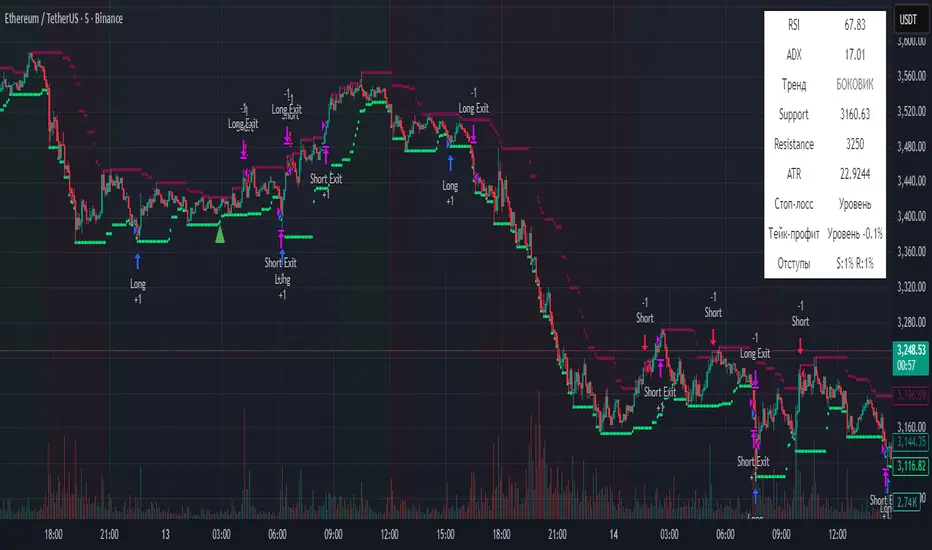
Seawolf Pivot Hunter [Strategy]Overview
Seawolf Pivot Hunter is a practical trading strategy that enhances the classic pivot-box breakout system with a structured risk-management framework. Using ATR-based stop loss and take-profit calculations, position sizing, multi-layer filtering, and daily loss-limit protection, it provides a stable and sustainable trading environment. It preserves the strengths of the original version while adding systems designed to manage real-market risks more effectively.
Core Philosophy
The most important element in trading is not generating profits but controlling losses. Even the best entry signals cannot compensate for a single large loss that wipes out accumulated gains. This strategy precisely calculates the risk exposure for every trade and includes multiple layers of protection to safeguard the account under worst-case scenarios.
Indicator Setup Link
kr.tradingview.com
Example of Optimal Parameter Settings
Asset (Exchange): ETH/USDT (Binance)
Timeframe: 15-minute chart
Pivot Detection Length: 5
Upper Box Width: 2
Lower Box Width: 2
Enable Risk Management: False
Use Trailing Stop: False
Use Volume Filter
-Min Buy Volume % for Long: 50
-Min Sell Volume % for Short: 50
Use Trend Filter (EMA): False
Enable Max Loss Protection
-Max Daily Loss ($): 200
-Max Trades Per Day: 10
Calculated Bars: 50,000
Risk-Management System
Every trade automatically receives a stop-loss level at the moment of entry. The stop is calculated using ATR, adjusting dynamically to market volatility. When volatility increases, the stop widens; in stable conditions, it tightens to reduce unnecessary exits. The default distance is set to twice the ATR.
The standard take-profit level is set to four times the ATR, providing a 1:2 risk-reward structure. With this ratio, even a 50 percent win rate can produce profitability—while the typical trade structure aims for small losses and larger gains to support long-term performance.
A trailing-stop option is also available. Once the trade moves into profit, the stop level automatically trails behind price action, protecting gains while allowing the position to expand when momentum continues.
Position size is calculated automatically based on the selected risk percentage. For example, with a 2 percent risk setting, each stop-loss hit would result in exactly 2 percent of the account balance being lost. This ensures a consistent risk profile regardless of account size.
The daily loss-limit function prevents excessive drawdown by halting new trades once a predefined loss threshold is reached. This helps avoid emotional decision-making after consecutive losses.
A daily trade-limit feature is included as well. The default is 10 trades per day, protecting traders from overtrading and unnecessary fees.
Filtering System
The volume filter analyzes buying and selling pressure within the pivot box. Long trades are allowed only when buy volume exceeds a specified percentage; shorts require sell-volume dominance. The default threshold is 55 percent.
The trend filter uses an EMA to determine market direction. When price is above the 200-EMA, only long signals are permitted; when below, only shorts are allowed. This ensures alignment with the broader trend and reduces counter-trend risk.
Each filter can be toggled independently. More filters generally reduce trade frequency but improve signal quality.
Real-Time Monitoring
A real-time statistics panel displays daily profit/loss, the number of trades taken, the maximum allowed trades, and whether new trades are currently permitted. When daily limits are reached, the panel provides clear visual warnings.
Entry Logic
A trade is validated only after a pivot-box breakout occurs and all active filters—volume, trend, daily loss limit, and daily trade limit—are satisfied. Position size, stop loss, and take-profit levels are then calculated automatically. Entry arrows and labels on the chart help with later review and analysis.
Setup Guide
Risk percentage is the most critical setting. Beginners should start at 1 percent. Anything above 3 percent becomes aggressive.
ATR stop-loss multipliers should reflect asset volatility.
ATR take-profit multipliers determine reward ratio; 4.0 is the standard.
Volume thresholds are typically set between 50–60 percent depending on market conditions.
Daily loss limits are typically 2–5 percent of the account.
Trading Strategy
This strategy performs best in trending environments and works especially well on the 4-hour and daily charts. New users should begin with all filters enabled and trade conservatively. A minimum of one month of paper trading is recommended before committing real capital.
Suitable Users
The strategy is ideal for beginners who lack risk-management experience as well as advanced traders seeking a customizable structure. It is particularly helpful for traders who struggle with emotional decision-making, as pre-defined limits and rules enforce discipline.
Backtesting Guide
Use at least 2–3 years of historical data that includes bullish, bearish, and sideways conditions.
Target metrics:
Sharpe ratio: 1.5 or higher
Maximum drawdown: below 25 percent
Win rate: 40 percent or higher
Total trades: at least 100 for statistical relevance
Optimization Precautions
Avoid over-fitting parameters. Always test values around the “best” setting to verify stability.
Out-of-sample testing is essential for confirming robustness.
Test across multiple assets and timeframes to ensure consistency.
Live Deployment Roadmap
After successful backtesting, follow a gradual rollout:
Paper trading for at least one month
Small-account live testing
Slow scaling as performance stabilizes
Continuous Improvement
Keep a detailed trading journal and evaluate performance each quarter using recent data.
Adapt settings as market conditions evolve.
Conclusion
Seawolf Pivot Hunter aims to provide more than simple trade signals—it is designed to create a stable and sustainable trading system built on disciplined risk management. No strategy is perfect, and long-term success depends on consistency, patience, and strict adherence to rules. Start small, verify results, and scale progressively.
Disclaimer
This strategy is for educational and research purposes only. Past performance does not guarantee future results. All trading decisions are the responsibility of the user.
개요
Seawolf Pivot Hunter는 기본 피봇 박스 브레이크아웃 전략에 전문적인 리스크 관리 시스템을 더한 실전형 트레이딩 전략입니다. ATR 기반의 손절매와 목표가 설정, 포지션 사이징, 다층 필터링 시스템, 일일 손실 제한 기능을 통해 안정적이고 지속 가능한 트레이딩 환경을 제공합니다. 기본 버전의 장점은 유지하면서 실제 시장에서 발생할 수 있는 위험을 체계적으로 관리할 수 있도록 설계되었습니다.
핵심 철학
트레이딩에서 가장 중요한 것은 수익이 아니라 손실 관리입니다. 아무리 훌륭한 진입 조건이 있어도 한 번의 큰 손실로 모든 수익이 사라질 수 있습니다. 이 전략은 각 거래마다 감수할 리스크를 명확히 계산하고, 최악의 상황에서도 계좌를 보호하기 위한 다양한 안전장치를 제공합니다.
지표 적용 링크 공유
kr.tradingview.com
최적 조건값 설정(예시)
"종목(거래소): ETH/USDT(Binance)", "15 분봉 기준"
-Pivot Detection Length: 5
-Upper Box width: 2
-Lower Box width: 2
-Enable Risk Management: False
-Use Trailing Stop: False
-Use Volume Filter
-Min Buy Volume % for Long: 50
-Min Buy Volume % for Long: 50
-Use Trend Filter(EMA): False
-Enable Max Loss Protection
-Max Daily Loss($): 200
-Max Trades Per Day: 10
-Calucated bars: 50000
리스크 관리 시스템
모든 거래는 진입과 동시에 손절매 주문이 자동 설정됩니다. 손절가는 ATR을 기준으로 계산되며, 시장의 변동성에 따라 자동으로 조정됩니다. 변동성이 큰 시장에서는 넓은 손절폭을, 안정적인 시장에서는 좁은 손절폭을 사용해 불필요한 청산을 줄입니다. 기본값은 ATR의 2배입니다.
목표가는 ATR의 4배를 기본값으로 설정하여 손익비 1:2 구조를 유지합니다. 승률이 50퍼센트만 되어도 수익성이 가능하며, 실제로는 손절은 짧고 이익은 길게 가져가는 방식으로 장기 성과를 확보합니다.
트레일링 스톱 기능도 제공됩니다. 포지션이 수익 구간에 들어서면 손절가가 자동으로 함께 움직이며 수익을 보호합니다. 이 기능은 사용자가 켜거나 끌 수 있습니다.
포지션 크기는 리스크 퍼센트 기반으로 자동 계산됩니다. 예를 들어 리스크를 2퍼센트로 설정하면 손절 시 계좌 자산의 2퍼센트만 잃도록 수량이 조절됩니다. 계좌 크기와 무관하게 항상 일정한 비율의 리스크만 감수하게 되는 방식입니다.
일일 손실 제한 기능은 하루에 허용 가능한 최대 손실을 초과하지 않도록 합니다. 지정 금액에 도달하면 당일 거래는 더 이상 실행되지 않습니다. 감정적 거래를 막고 일정한 규율을 유지하도록 돕습니다.
일일 거래 횟수 제한 기능도 제공됩니다. 기본값은 하루 10회로, 과매매와 수수료 증가를 방지합니다.
필터링 시스템
볼륨 필터는 박스 구간 내 매수·매도 압력을 분석해 진입 신호를 검증합니다. 롱은 매수 볼륨이 일정 비율 이상일 때, 숏은 매도 볼륨이 우세할 때만 진입합니다. 기본값은 55퍼센트입니다.
추세 필터는 EMA를 사용하며, 가격이 200EMA 위에 있을 때는 롱 신호만, 아래에서는 숏 신호만 허용합니다. 큰 추세 방향에만 거래하여 역추세 리스크를 줄입니다.
필터는 독립적으로 켜고 끌 수 있으며, 필터가 많을수록 거래 횟수는 줄지만 신호 품질은 향상됩니다.
실시간 모니터링
화면에 실시간 통계 테이블이 표시되며, 일일 손익, 거래 횟수, 최대 허용 횟수, 현재 거래 가능 여부가 즉시 확인됩니다. 손실 제한 또는 거래 제한 도달 시 시각적으로 표시됩니다.
진입 로직
피봇 박스 브레이크아웃 발생 후 볼륨 필터, 추세 필터, 일일 손실·거래 제한을 모두 통과하면 포지션 크기를 계산하고 손절·목표가를 설정한 뒤 진입합니다. 진입 지점에는 화살표와 레이블이 표시되어 분석에 도움을 줍니다.
설정 가이드
리스크 퍼센트는 가장 중요한 설정입니다. 초보자는 1퍼센트를 추천하며 3퍼센트 이상은 위험합니다.
손절 ATR 배수는 자산 특성에 맞게 조절합니다.
목표가 ATR 배수는 손익비를 결정하며 기본값은 4.0입니다.
볼륨 비율은 시장 상황에 따라 50~60퍼센트 내외로 조정합니다.
일일 손실 제한은 계좌의 2~5퍼센트 수준이 적절합니다.
사용 전략
추세가 명확한 시장에서 가장 효과적이며, 4시간봉 또는 일봉을 추천합니다. 초반에는 모든 필터를 켜고 보수적으로 시작하며, 최소 한 달간 페이퍼 트레이딩을 권장합니다.
적합한 사용자
리스크 관리 경험이 부족한 초보자부터, 커스터마이징을 원하는 경험자까지 폭넓게 적합합니다. 감정적 트레이딩을 억제하는 기능이 있어 규율 유지가 어렵던 트레이더에게 특히 유용합니다.
백테스트 가이드
최소 2~3년 데이터로 테스트하며, 상승·하락·횡보 모두 포함해야 합니다.
샤프비율 1.5 이상, 최대 낙폭 25퍼센트 이하를 목표로 합니다.
승률은 40퍼센트 이상이면 충분합니다.
최소 100회 이상 거래가 있어야 통계적으로 의미가 있습니다.
최적화 주의사항
과최적화를 피하고 주변 값도 테스트해야 합니다.
샘플 외 기간 검증은 필수입니다.
여러 자산·여러 시간대에서 테스트하여 일관성을 확인해야 합니다.
실전 적용 로드맵
백테스트 후 바로 실전 투입하지 말고, 한 달 이상의 페이퍼 트레이딩 → 소액 실전 → 점진적 확대 순으로 진행합니다.
지속적 개선
일지를 기록하고 분기마다 최신 데이터로 점검합니다.
시장 변화에 따라 유연하게 조정해야 합니다.
마치며
Seawolf Pivot Hunter는 단순 신호 제공을 넘어, 안전하고 지속 가능한 트레이딩 환경 구축을 목표로 합니다. 어떤 전략도 완벽할 수 없으며, 장기적 성공을 위해서는 규칙 준수와 인내가 가장 중요합니다. 충분한 검증을 거쳐 작은 금액으로 시작하고 점진적으로 확장해나가는 접근을 추천합니다.
면책 조항
이 전략은 교육 및 연구 목적이며, 과거 성과는 미래를 보장하지 않습니다. 모든 투자 결정은 본인의 판단과 책임 하에 이루어져야 합니다.

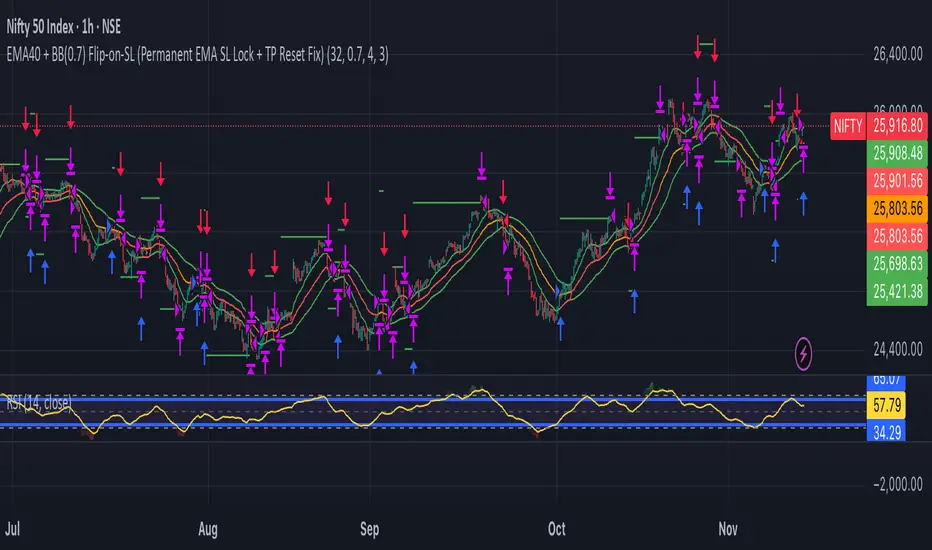
RSI BREAKOUT SIGNALSThis BB + RSI Breakout indicator is designed to help traders identify potential buy and sell opportunities based on price movements relative to the Donchian channel (or Bollinger-type channel) and momentum conditions. It calculates the highest high and lowest low over a user-defined length to form a dynamic channel, and then it checks whether the current price breaks above the upper band (for a buy signal) or below the lower band (for a sell signal). To avoid repeated signals in a row, the indicator uses a state system: after a buy signal occurs, it will not generate another buy until a sell occurs, and vice versa. When a buy signal is triggered, it automatically calculates a take-profit price a certain percentage above the buy candle and displays this price below the candle as a “TP” label. Sell signals are displayed above the candle, and any previous TP label is cleared. The indicator updates in real time, so the signals move with the chart, giving a clear and lag-free visualization of entry points and potential profit targets.

Cognex Fibonacci Breakout StrategyTHE COMPLETE TRADE LOGIC (What We Want):
Step 1: Morning Session (9:30-10:30)
Track session high and low
Step 2: After 10:30 - Wait for Breakout
Bullish: Close above session high
Bearish: Close below session low
Step 3: Track Extreme After Breakout
Keep updating highest_after_breakout or lowest_after_breakout
This continuously updates as price makes new extremes
Step 4: Detect 28% Retracement (THE LOCK)
When price retraces to 28%, set last_extreme_for_retracement to the current extreme
This LOCKS the extreme for fibonacci calculations
fib_100 should use this locked value
Step 5: Place Limit Order EARLY (at 20% retracement)
When price retraces to 20%, place limit order at 28% entry
This is so the order is ready when price hits 28%
Step 6: Cancel & Recalculate if New Extreme
If price makes a NEW extreme AFTER the order is placed
Cancel the old order
Wait for new 20% retracement to place new order
Step 7: One Trade Per Day
Only ONE order placement attempt per day
Even if cancelled, don't try again

TSI.LTA | Base BTC 1DTSI.LTA | Base BTC 1D is a closed‑source trend‑following strategy designed for BTC on the 1D timeframe .
It focuses on participating in the main directional moves of the market while avoiding as much short‑term noise as possible.
📊 The script:
Uses a combination of moving‑average–based filters and volatility bands to define the active trend.
Applies optional volume filters to avoid low‑participation or exhausted moves.
Includes risk‑management controls (Stop Loss, Take Profit, Trailing Stop) that work on a per‑trade basis.
All entries and exits are confirmed at bar close and the script does not repaint .
This makes it suitable for backtesting, alerts and external automation.
█ 💡 CONCEPTS
This strategy is built around a few simple ideas:
1 — Trend first.
Positions are only taken when a group of smoothed trend filters agree on direction.
The goal is to ride larger swings, not to scalp each fluctuation.
2 — Volatility awareness.
Standard‑deviation–based bands help avoid entries in abnormal spikes or during very compressed ranges.
3 — Participation filter.
Optional volume‑based conditions (VWMA, OBV slope, MFI, volume Z‑score) try to ensure that entries occur when the market shows enough activity, not during dead phases.
4 — Risk defined in advance.
Stop‑loss and trailing‑stop inputs are expressed as percentages relative to entry price, so users can align them with their own risk tolerance.
The logic is purposely conservative: it is expected to stay flat during parts of the market where the trend is unclear or participation is weak.
█ ⚙️ FEATURES & INPUTS
This section follows approximately the order of the script’s inputs, so users can read here and then match what they see in the “Inputs” tab.
1 — 📐 Trend filters
These inputs control how the strategy detects the underlying trend:
DEMA / Gaussian / SMMA lengths
Control how fast or slow the trend reacts to price changes.
Shorter lengths → more responsive, more trades, more noise.
Longer lengths → slower reaction, fewer trades, more filtering.
Volatility Bands (SD length & multipliers)
Standard‑deviation bands around the smoothed price series.
They are used to avoid entries during extreme moves or very narrow ranges where a breakout is not yet confirmed.
In practice, these settings let the user choose between a more “aggressive” trend follower (shorter lengths, smaller bands) or a more “patient” one.
2 — 📊 Volume filters (optional)
These filters are meant to restrict trades to periods where the market shows meaningful participation:
VWMA filter
Requires price to be aligned with a Volume‑Weighted Moving Average, which de‑emphasizes moves on very low volume.
OBV slope filter
Uses the slope of On‑Balance Volume to check that net volume flow supports the direction of the trade.
MFI band filter
Uses the Money Flow Index to avoid taking new entries in zones that often correspond to exhaustion (extreme values defined by the user).
Volume Z‑Score
Compares current volume to its recent history. Trades can be restricted when volume is unusually low or out of character for that period.
When any of these filters are turned off, the strategy relies only on price‑based trend and volatility logic.
When they are on, trades are more selective and may be fewer.
3 — 🛡️ Risk management
These inputs define how individual trades are managed once entered.
They do not change the trend logic itself:
Stop Loss (%)
A percentage move against the entry price that will close the position.
Typical values on BTC 1D remain in the single‑digit range so that no single trade risks an unrealistic portion of equity.
Take Profit (%)
An optional fixed target that closes the trade when price has moved a chosen percentage in favor.
This can be disabled if the user prefers to let the trend filters perform the exit.
Trailing Stop (%)
A stop that follows the most favorable price reached since entry.
When the “use lower timeframe peak” option is enabled, peaks can be detected on a lower timeframe for more granular trailing, while decisions still occur at the close of the 1D bar.
Fixed SL/TP Price and Activation Date
Allow defining absolute price levels and a date from which they start applying.
This is useful when the user wants structural protection around known price zones.
The combination of these controls determines how deep a pullback the user is willing to tolerate and how much profit they are prepared to give back in order to stay in trends.
4 — 🚫 Filter failure & cooldown
To avoid over‑trading in difficult environments, the script can:
Automatically exit when filters remain unfavorable for a configurable number of bars.
Enter a cooldown period, during which no new trades are taken, even if some conditions improve.
These mechanisms are intended to protect capital during choppy or low‑quality phases rather than force constant exposure.
█ 📚 HOW TO USE
A suggested process for using this strategy as a study tool:
1 — Start on BTC 1D.
Apply the script to BTCUSD or BTC/USDT on the 1D timeframe, with default inputs.
2 — Open the Strategy Tester.
Choose a time window (for example a full halving cycle, a crash + recovery period, or just the most recent bull leg).
3 — Compare with Buy & Hold.
For the same window, look at:
Net profit of the strategy vs Buy & Hold.
Max drawdown of the strategy vs Buy & Hold.
The goal is not to hit a particular number, but to see whether, in that window, the strategy manages to:
Provide a smoother equity curve (lower drawdown),
While still performing at least as well as, or better than, simply holding the asset.
4 — Experiment with risk inputs.
Vary Stop Loss, Trailing Stop and the volume filters.
After each change, re‑check the same two questions above. This should make clear how each input affects the trade‑off between participation and risk.
5 — Forward‑test.
Before using any configuration with real capital, let it run for a while in paper‑trading or demo conditions.
█ 🚧 LIMITATIONS
The strategy is built and tuned primarily for BTC on 1D.
It can be used on other symbols and timeframes, but behavior may differ and requires new testing.
In very tight ranges or during event‑driven gaps, trend logic may enter later than discretionary trading would. This is expected for a conservative trend‑following approach.
Results from historical backtests depend on data quality, broker settings, fees and slippage configured in the Strategy Tester.
█ 📝 NOTES
Signals are generated on bar close.
The script is closed‑source, but the description explains the main ideas so users and moderators can understand what it does and how to use it.
The HUD on the chart is meant as a compact summary of the same statistics available in the Strategy Tester; it simply makes comparisons quicker.
█ ⚠️ DISCLAIMER
This strategy is provided for educational and research purposes only .
It is not financial advice and does not recommend any specific trades, assets, position sizes, or risk levels.
Users are fully responsible for:
Choosing their own risk parameters (Stop Loss, Take Profit, Trailing Stop, position sizing, etc.).
Testing the script on the markets and timeframes they intend to trade.
Verifying that any configuration is appropriate for their capital, risk tolerance and jurisdiction.
Past performance in backtests or examples does not guarantee future results.
Always test carefully before considering any live deployment.


Moving Average Band StrategyOverview
The Moving Average Band Strategy is a fully customizable breakout and trend-continuation system designed for traders who need both simplicity and control.
The strategy creates adaptive bands around a user-selected moving average and executes trades when price breaks out of these bands, with advanced risk-management settings including optional Risk:Reward targets.
This script is suitable for intraday, swing, and positional traders across all markets — equities, futures, crypto, and forex.
Key Features
✔ Six Moving Average Types
Choose the MA that best matches your trading style:
SMA
EMA
WMA
HMA
VWMA
RMA
✔ Dynamic Bands
Upper Band built from MA of highs
Lower Band built from MA of lows
Adjustable band offset (%)
Color-coded band fill indicating price position
✔ Configurable Strategy Preferences
Toggle Long and/or Short trades
Toggle Risk:Reward Take-Profit
Adjustable Risk:Reward Ratio
Default position sizing: % of equity (configurable via strategy settings)
Entry Conditions
Long Entry
A long trade triggers when:
Price crosses above the Upper Band
Long trades are enabled
No existing long position is active
Short Entry
A short trade triggers when:
Price crosses below the Lower Band
Short trades are enabled
No existing short position is active
Clear entry markers and price labels appear on the chart.
Risk Management
This strategy includes a complete set of risk-controls:
Stop-Loss (Fixed at Entry)
Long SL: Lower Band
Short SL: Upper Band
These levels remain constant for the entire trade.
Optional Risk:Reward Take-Profit
Enabled/disabled using a toggle switch.
When enabled:
Long TP = Entry + (Risk × Risk:Reward Ratio)
Short TP = Entry – (Risk × Risk:Reward Ratio)
When disabled:
Exits are handled by reverse crossover signals.
Exit Conditions
Long Exit
Stop-Loss Hit (touch-based)
Take-Profit Hit (if enabled)
Reverse Band Crossover (if TP disabled)
Short Exit
Stop-Loss Hit (touch-based)
Take-Profit Hit (if enabled)
Reverse Band Crossover (if TP disabled)
Exit markers and price labels are plotted automatically.
Visual Tools
To improve clarity:
Upper & Lower Band (blue, adjustable width)
Middle Line
Dynamic band fill (green/red/yellow)
SL & TP line plotting when in position
Entry/Exit markers
Price labels for all executed trades
These are built to help users visually follow the strategy logic.
Alerts Included
Every trading event is covered:
Long Entry
Short Entry
Long SL / TP / Cross Exit
Short SL / TP / Cross Exit
Combined Alert for webhook/automation (JSON-formatted)
Perfect for algo trading, Discord bots, or automation platforms.
Best For
This strategy performs best in:
Trending markets
Breakout environments
High-momentum instruments
Clean intraday swings
Works seamlessly on:
Stocks
Index futures
Commodities
Crypto
Forex
⚠️ Important Disclaimer
This script is for educational purposes only.
Trading involves risk. Backtest results are not indicative of future performance.
Always validate settings and use proper position sizing.

EMA VIP STRThis strategy works on EMAS and standard deviation on both sides , the tp is decided on RSI levels. the strategy is a systematic trading setup
Fractional Candlestick Long Only Experimental V10Fractional Candlestick Long-Only Strategy – Technical Description
This document provides a professional English description of the "Fractional Candlestick Long Only Experimental V6" strategy using pure CF/AB fractional kernels and wavelet-based filtering.
1. Fractional Candlesticks (CF / AB)
The strategy computes two fractional representations of price using Caputo–Fabrizio (CF) and Atangana–Baleanu (AB) kernels. These provide long-memory filtering without EMA approximations. Both CF and AB versions are applied to O/H/L/C, producing fractional candlesticks and fractional Heikin-Ashi variants.
2. Trend Stack Logic
Trend confirmation is based on a 4-component stack:
- CF close > AB close
- HA_CF close > HA_AB close
- HA_CF bullish
- HA_AB bullish
The user selects how many components must align (4, 3, or any 2).
3. Wavelet Filtering
A wavelet transform (Haar, Daubechies-4, Mexican Hat) is applied to a chosen source (e.g., HA_CF close). The wavelet response is used as:
- entry filter (4 modes)
- exit filter (4 modes)
Wavelet modes: off, confirm, wavelet-only, block adverse signals.
4. Trailing System
Trailing stop uses fractional AB low × buffer, providing long-memory dynamic trailing behavior. A fractional trend channel (CF/AB lows vs HA highs) is also plotted.
5. Exit Framework
Exit options include: stack flip, CF

Трендовые линии с продвинутыми стопамиtrend analysis strategy can work in every trend on the market.
Fractional Candlestick Long Only Experimental V4 Another example of use an idea of Fractional Candlestick , based on mathematical rules of Fractional Calculus , typical kernel Caputo-Fabrizio ( CF ) and Atangana-Baleanu is used, alfa factor ( esential for calculation ) is in range 0,1-0.9.
Let's fun with this script .

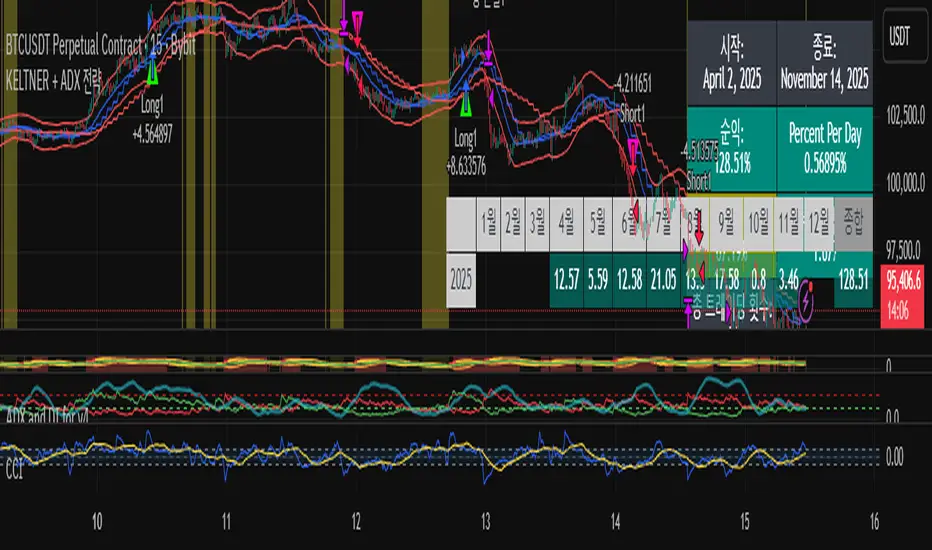
KELTNER + ADX 전략It's a trend strategy based on the Keltner channel and ADX. It's optimized for the Bitcoin Futures 15 Distribution Chart.
Braid Filter StrategyAnother of TradeIQ's youtube strategies. It looks a little messy but it combines all the indicators into one so there are no extra panes. This strategy is like a sophisticated set of traffic lights and speed limit signs for trading. It only allows a trade when multiple indicators line up to confirm a strong move, giving it its "Braid Filter" name—it weaves together several conditions.
The strategy is set up to use 100% of your account equity (your trading funds) on a trade and does not "pyramid" (it won't add to an existing trade).
1. The Main Trend Check (The Traffic Lights)
The strategy uses three main filters that must agree before it considers a trade.
A. The "Braid Filter" (Direction & Strength)
This is the heart of the strategy, a custom combination of three different Moving Averages
These averages have fast, medium, and slow settings (3, 7, and 14 periods).
Go Green (Buy Signal): The fastest average is higher than the medium average, AND the three averages are sufficiently separated (not tangled up, which indicates a strong move).
Go Red (Sell Signal): The medium average is higher than the fastest average, AND the three averages are sufficiently separated.
Neutral (Wait): If the averages are tangled or the separation isn't strong enough.
Key Trigger: A primary condition for a signal is when the Chad Filter changes color (e.g., from Red/Grey to Green).
B. The EMA Trend Bars (Secondary Confirmation)
This is a simpler, longer-term filter using a 34-period Exponential Moving Average (EMA). It checks if the current candle's average price is above or below this EMA.
Green Bars: The price is above the 34 EMA (Bullish Trend).
Red Bars: The price is below the 34 EMA (Bearish Trend).
Trades only happen if the signal direction matches the bar color. For a Buy, the bar must be Green. For a Sell, the bar must be Red.
C. ADX/DI Filter (The Speed Limit Sign)
This uses the Average Directional Index (ADX) and Directional Movement Indicators (DI) to check if a trend is actually in motion and getting stronger.
Must-Have Conditions:
The ADX value must be above 20 (meaning there is a trend, not just random movement).
The ADX line must be rising (meaning the trend is accelerating/getting stronger).
The strategy will only trade when the trend is strong and building momentum.
2. The Trading Action (Entry and Exit)
When all three filters (Chad Filter color change, EMA Trend Bar color, and ADX strength/slope) align, the strategy issues a signal, but it doesn't enter immediately.
Entry Strategy (The "Wait-for-Confirmation" Approach):
When a Buy Signal appears, the strategy sets a "Buy Stop" order at the signal candle's closing price.
It then waits for up to 3 candles (Candles Valid for Entry). The price must move up and hit that Buy Stop price within those 3 candles to confirm the move and enter the trade.
A Sell Signal works the same way but uses a "Sell Stop" at the closing price, waiting for the price to drop and hit it.
Risk Management (Stop Loss and Take Profit):
Stop Loss: To manage risk, the strategy finds a recent significant low (for a Buy) or high (for a Sell) over the last 20 candles and places the Stop Loss there. This is a logical place where the current move would be considered "broken" if the price reaches it.
Take Profit: It uses a fixed Risk:Reward Ratio (set to 1.5 by default). This means the potential profit (Take Profit distance) is $1.50 for every $1.00 of risk (Stop Loss distance).
3. Additional Controls
Time Filter: You can choose to only allow trades during specific hours of the day.
Visuals: It shows a small triangle on the chart where the signal happens and colors the background to reflect the Chad Filter's trend (Green/Red/Grey) and the candle bars to show the EMA trend (Lime/Red).
🎯 Summary of the Strategy's Goal
This strategy is designed to capture strong, confirmed momentum moves. It uses a fast, custom indicator ("Chad Filter") to detect the start of a new move, confirms that move with a slower trend filter (34 EMA), and then validates the move's strength with the ADX. By waiting a few candles for the price to hit the entry level, it aims to avoid false signals.

Dhanesh_CustomTrendlineLogicUsed framma in getting the trades.
You can also define the custom horizontal and an inclined trendline breaking of which can trigger the trade. Enjoy the script.
Algosnipe trading day scalperThe Algosnipe Trading Day Scalper is an intraday trading strategy designed for active traders who aim to capture short-term price movements within the trading session. It blends price action, volatility, and volume-based logic to identify high-probability entry and exit zones while minimizing exposure time in the market.

FVG Session Break Strategy with ATR RR🧠 FVG Session Break Strategy with ATR RR — Timezone-Aware, Session-Savvy, and Risk-Calibrated
This strategy captures high-probability reversals and continuations by combining Fair Value Gap (FVG) imbalances with session-based breakout logic and ATR-calibrated risk management. It’s designed for traders who want to exploit structural inefficiencies during key market sessions — with precision and portability across global exchanges.
🔍 Core Logic:
Fair Value Gap Detection: Identifies bullish and bearish FVGs using a 3-bar displacement pattern.
Session Breakout Engine: Tracks session highs and lows (Asian, London, NY) and triggers trades only when price breaks these levels — ensuring trades occur at meaningful inflection points.
ATR-Based RR Control: Dynamically sizes stop-loss and take-profit levels using ATR × multiplier, maintaining consistent risk across volatility regimes.
🌐 Timezone-Aware Session Logic:
Session boundaries are defined in UTC-5 (e.g., NY: 0930–1600) but automatically converted to the exchange’s local timezone using timestamp("Etc/GMT+5", ...). This ensures:
Accurate session detection across all markets and assets
No manual timezone adjustments needed
Robust performance on crypto, forex, and global equities
📈 Visuals:
Session highs and lows plotted in orange
Bullish and bearish FVGs marked with green and red triangles
Strategy entries and exits shown on chart with full RR logic
This strategy is ideal for traders who want to combine structural edge with session context and disciplined risk.

The Butterfly Elephant EffectStrategy Overview: The Butterfly Elephant Effect
Concept & Philosophy:
Welcome to "The Butterfly Elephant Effect," a sophisticated multi-indicator strategy that operates on the principle that small, precise technical signals (the Butterfly) can trigger significant market moves (the Elephant Effect). This strategy is designed to identify high-probability reversal points by combining three powerful analytical systems into one cohesive framework. It seeks to catch major trend reversals at key support and resistance levels, using a confluence of volume, momentum, and overbought/oversold oscillators.
Core Components:
The strategy intelligently synthesizes three distinct systems:
Lucky Balls System (Volume & Trend):
Utilizes the Negative Volume Index (NVI) and Positive Volume Index (PVI) to understand smart money activity and trend strength.
Plots these indices on the price chart, scaled to the recent price range for actionable signals.
Generates signals when price interacts with a moving average envelope, identifying potential exhaustion points.
Momentum Confirmation System:
Combines RSI, CCI, and PPO momentum oscillators into a single, refined line.
This "Momentum Composite" line is used to confirm the strength of a reversal signal as it crosses the dynamic envelope bands.
Lucky Table System (Market Breadth & Confluence):
This is the heart of the strategy's filtering mechanism. It runs 36 different oscillator readings across 6 different timeframes for Stochastic, Williams %R, RSI, and MACD.
It counts the number of these oscillators that are in extreme overbought or oversold territory.
A "Lucky Table" signal is generated when the number of matching oscillators exceeds your customizable threshold (e.g., 30 out of 36), indicating a massive, multi-timeframe consensus on market exhaustion.
The Ultimate Signals:
The strategy's most powerful entries are the specially named signals that require a perfect storm of conditions:
🐘 Elephant Long Signal: Triggers when the Momentum System gives a buy, the Lucky Table shows extreme oversold consensus, AND the price is at or below the adjusted lower envelope band. This represents a potential major bullish reversal from a support zone.
🦋 Butterfly Short Signal: Triggers when the Momentum System gives a sell, the Lucky Table shows extreme overbought consensus, AND the price is at or above the adjusted upper envelope band. This represents a potential major bearish reversal from a resistance zone.
Key Features:
Visual Clarity: A rich set of plotshapes (🪜, 🐍, 🐸, ✈️, ⚽) makes it easy to identify the contributing signals from each subsystem on the chart.
Comprehensive Dashboard: A real-time table displays all 36 oscillator values from the Lucky Table, color-coded for quick assessment of market conditions.
Flexible Risk Management: Includes optional Profit Target and Stop Loss based on a percentage of entry price.
Highly Customizable: Every parameter—from lookback lengths and scale factors to the crucial match threshold—can be adjusted to fit your trading style and instrument.
How to Use:
Add the strategy to your chart.
Look for the primary Elephant (🐘) or Butterfly (🦋) signals near the envelope boundaries.
Use the Lucky Table on the top-right to confirm the strength of the oversold/overbought conditions.
Manage your trade using the built-in PT/SL or your own discretion.
Ideal For: Swing traders and position traders looking for high-conviction entries at potential market turning points.
Disclaimer: This is a complex strategy designed for educational and research purposes. Always test and forward-test any strategy in a simulated environment before committing real capital. Past performance is not indicative of future results.
PS Look out for the Frog :-)

ETH Short-Term VWAP+EMA/RSI (ATR Risk, <1h) (James Logan)ETH Short-Term VWAP + EMA / RSI Strategy (ATR-based Risk Control)
A short-term (< 1 hour) ETH trading system designed for intraday scalps and momentum swings on 5- to 15-minute charts.
It blends trend confirmation (EMA 50 / 200) with intrabar structure (EMA 21 pullback & VWAP filter) and RSI momentum triggers, managing exits dynamically through ATR-based stop, take-profit, and trailing stop targets.
Core logic
• Long when RSI crosses above the threshold within an up-trend (EMA 50 > EMA 200) and price is above VWAP.
• Short when RSI crosses below threshold within a down-trend (EMA 50 < EMA 200) and price is below VWAP.
• Optional pullback confirmation to the 21-EMA for cleaner entries.
• Risk defined by ATR-multiples for stop-loss, take-profit, and an adaptive trailing stop.
• Automatic flat-out exit after a set number of bars (time-based close).
Best use
• 5 min – 15 min ETH/USDT charts (Binance, Bybit, Coinbase, etc.)
• Works with both spot and perpetual data.
• Tune ATR and RSI thresholds per venue; defaults are balanced for 0.05 % per-side fees.
Key parameters
• ATR SL × 1.6 ATR TP × 2.2 ATR Trail × 2.0
• RSI 50 cross | EMA 50/200 trend filter | VWAP confirmation
• Default position sizing = USD-based (e.g. $1 000 per trade).
Notes
• All orders and exits are simulated at bar close; use 1-minute bar magnifier for finer fill modeling.
• No repainting—uses only confirmed bar data.
• Best validated with ≥ 200 trades and profit factor > 1.25 over multi-month backtests.

Blackflag FTS Strategy – Based on Extremum (Fractional CF/AB)Example of usage concepts of Fractional calculus Math rules, script use two type of kernel (Caputo-Fabrizio and Atangana-Baleanu), basic parametr alpha ( independently for each kernel) could be change in range 0.1-0.9.

XAutoTrade Alert Builder v1.1Automate Your NinjaTrader Trading with TradingView Alerts
The XAutoTrade Alert Builder is a flexible Pine Script strategy that bridges TradingView alerts with
NinjaTrader automated trading. Design custom entry signals, configure exit strategies, and execute trades
automatically on your NinjaTrader account - all from TradingView charts.
Key Features
📊 Flexible Signal Logic
- Configure buy/sell signals independently
- Compare any two indicators or price sources using crossover, crossunder, greater than, or less than
logic
- Visual buy/sell markers on chart for easy signal verification
🎯 Multiple Exit Methods
1. ATM Strategy - Leverage your existing NinjaTrader ATM templates for advanced order management
2. Source Signals - Exit positions based on opposite entry signals
3. Fixed Levels - Set stop loss and profit targets using ticks or percentage
⚙️ NinjaTrader Integration
- Direct webhook integration with XAutoTrade backend service
- Multi-account support (trade multiple accounts simultaneously)
- Position sizing and max position limits
- Market or limit order types with configurable offset
- Time-in-force options (DAY/GTC)
- Active hours filter (US ET timezone) to control when alerts execute
🔐 Secure & Reliable
- Webhook secret authentication
- Symbol override capability
- Real-time status indicator showing configuration readiness
How It Works
1. Configure Entry Signals - Choose your buy/sell logic by comparing any two data sources (price,
indicators, etc.)
2. Set Exit Strategy - Select ATM templates, signal-based exits, or fixed stop/profit levels
3. Connect to NinjaTrader - Enter your XAutoTrade webhook secret and account details
4. Create Alert - Use the strategy's alert system to send formatted JSON payloads to your XAutoTrade
webhook
5. Trade Futures & Stocks Automatically - TradingView alerts trigger real trades in your NinjaTrader account
Perfect For
- Traders wanting to automate TradingView strategies in NinjaTrader
- Users with existing ATM templates who want TradingView signal automation
- Multi-account traders managing several NinjaTrader accounts
- Anyone seeking a no-code bridge between TradingView and NinjaTrader
Requirements
- Active XAutoTrade account and subscription
- NinjaTrader 8 with XAutoTrade AddOn installed
- TradingView Premium/Pro account (for webhook alerts)

Confirmed Momentum QQQ (RSI/MACD Filter)Gemini and Myself,
How This Targets a Higher Win Rate
The key to the win rate increase is the RSI 20/80 filter.
Long Signal: A long entry is now only taken if the trend is up (SMA cross), the MACD is bullish, and the RSI is not overbought (below 80). By only entering when momentum is not yet exhausted, you increase the chance that the price can travel far enough to hit your 4.0 point Take Profit.
Wider SL: The wider Stop Loss of 2.5 points reduces the chance of being stopped out prematurely by routine market movements (whipsaws), which is the number one killer of win rates in high-frequency trading.
After applying these changes, you will need to run the Strategy Tester again to see the new win rate and the new total number of trades.
Would you like me to help you interpret the new Strategy Tester results once you apply these settings?

Bybit BTCUSD.P 자동매매 전략 v12 (Pi Cycle 비율 필터)Abstract
Sigma Trinity Model is an educational framework that studies how three layers of market behavior interact within the same trend: (1) structural momentum (Rasta), (2) internal strength (RSI), and (3) continuation/compounding structure (Pyramid). The model deliberately combines bar-close momentum logic with intrabar, wick-aware strength checks to help users see how reversals form, confirm, and extend. It is not a signal service or automation tool; it is a transparent learning instrument for chart study and backtesting.
Why this is not “just a mashup”
Many scripts merge indicators without explaining the purpose. Sigma Trinity is a coordinated, three-engine study designed for a specific learning goal:
Rasta (structure): defines when momentum actually flips using a dual-line EMA vs smoothed EMA. It gives the entry/exit framework on bar close for clean historical study.
RSI (energy): measures internal strength with wick-aware triggers. It uses RSI of LOW (for bottom touches/reclaims) and RSI of HIGH (for top touches/exhaustion) so users can see intrabar strength/weakness that the close can hide.
Pyramid (progression): demonstrates how continuation behaves once momentum and strength align. It shows the logic of adds (compounding) as a didactic layer, also on bar close to keep historical alignment consistent.
These three roles are complementary, not redundant: structure → strength → progression.
Architecture Overview
Execution model
Rasta & Pyramid: bar close only by default (historically stable, easy to audit).
RSI: per tick (realtime) with bar-close backup by default, using RSI of LOW for entries and RSI of HIGH for exits. This makes the module sensitive to intra-bar wicks while still giving a close-based safety net for backtests.
Stops (optional in strategy builds): wick-accurate: trail arms/ratchets on HIGH; stop hit checks with LOW (or Close if selected) with a small undershoot buffer to avoid micro-noise hits.
Visual model
Dual lines (EMA vs smoothed EMA) for Rasta + color fog to see direction and compression/expansion.
