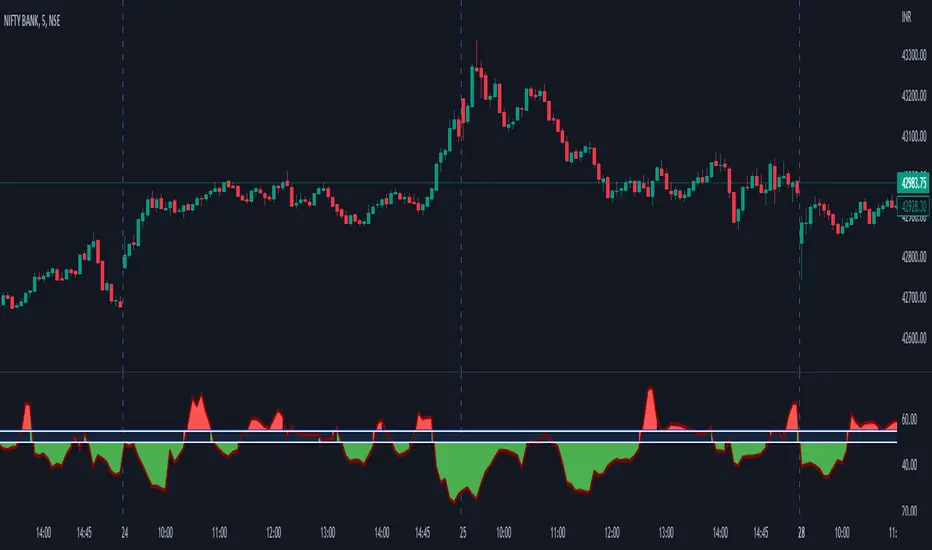
StockCloud_Chopiness This indicator describes the state of the market. If the region is under green shades, you could take trade based on your other criterias and if its red , the market is chopping and it is not advisable to take the trade. This works for BANKNIFTY spot chart and ideally on a 5 min Time frame. Do not use this alone but use it best with Price Action. Also ignonre this indicator values on sudden spike candles, wait for the PA and indicator behaviour to take the trade.
Green signifies the possibility of being in a trend state and doesnt mean a long condition and red in a consolidation / trap state and doesnt mean a short condition.
BANKNIFTY
NSE Sector PerformanceUse this indicator on daily timeframe
This indicator shows the performance of the top NSE Sectors for 4 time periods.
User has the flexibility to define the time periods (ex. Yearly Monthly Quarterly Weekly Daily
indicator shows the performance of the sector for those time periods along with 250d High/Low and distance from the High/Low
User input is provided to drill down into performance of the top stocks in those sectors.

ILM NSE Banknifty DashboardUse this indicator on Daily Timeframe
This indicator shows the important metrics of BANKNIFTY and its top 7 constituent stocks.
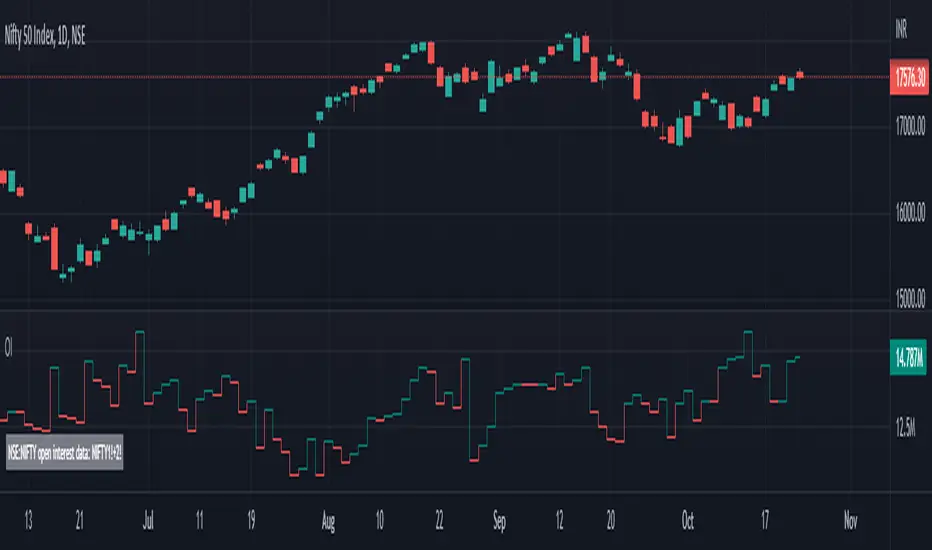
This indicator is similar to Open Interest indicator but consolidates the data for NIFTY stocks
For more information, look at the Open Interest Indicator
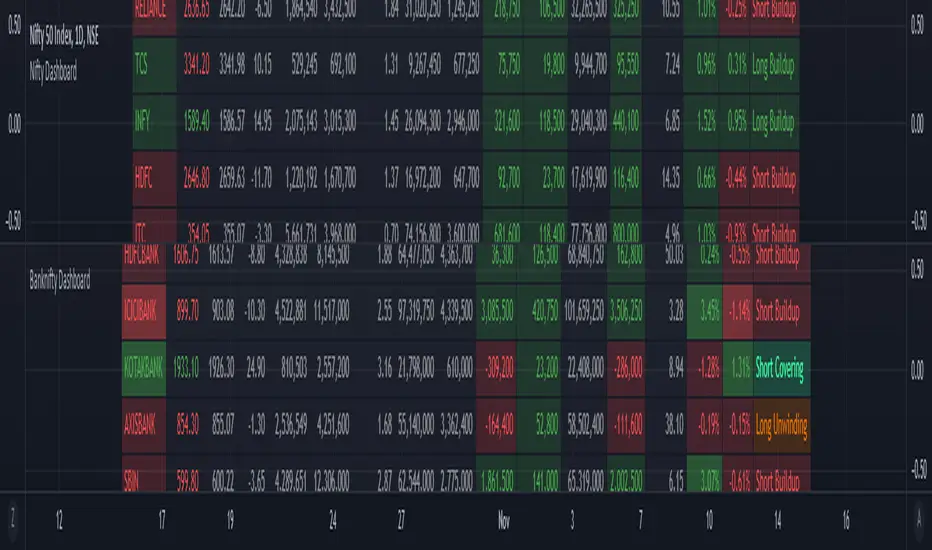
ILM NSE Nifty DashboardUse this indicator on Daily Timeframe
This indicator shows important metrics of NIFTY and its top 7 constituent stocks (Banks are excluded as there is a separate dashboard for BANKNIFTY).
This indicator is similar to Open Interest indicator but consolidates the data for NIFTY stocks
For more information, look at the Open Interest Indicator

ILM NSE Futures - Open Interest Analysis - FnOUse this indicator on Daily Timeframe
This script works only on India NSE Futures (Indices and Fno Stocks)
This script pulls Stock/Index Price/Volume Info + Futures Current/Next Price/Volume/Open Interest Info
Calculates the Combined OI and identifies the OI Buildup based on the Price Change and color codes the info for easy reading
This script also calculates Stock/Futures Volume action to identify if big players are aggressively trading in Futures
Also OI Buildup to Future Volume is calculated to track the presence of big players.
Summary Row is displayed at the bottom which shows Futures Premium/Discount to Index/Stock

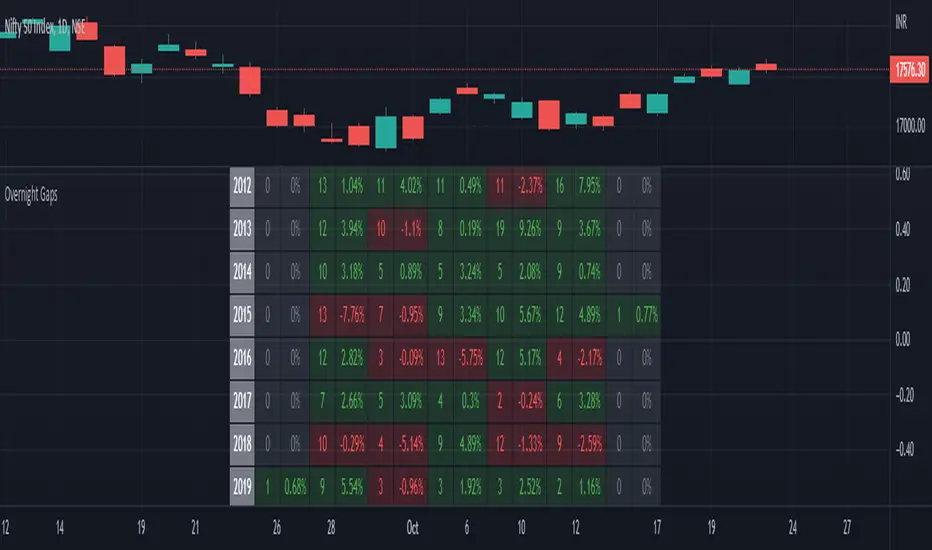
Seasonality Overnight Gaps - Tabular Form Use this indicator on Daily Timeframe
This script calculates the overnight gaps above a specific threshold (that can be set through input parameters) and displays the data in a tabular form with Year in the rows and the day of the week in the columns.
Also a summary row is displayed at the bottom for day of the week.
Detailed Gap info is displayed as tooltip for the cell data
Gap - Open should be outside the previous day's Open and Close
Gap % - open/prev. close - 1 if Gap is there
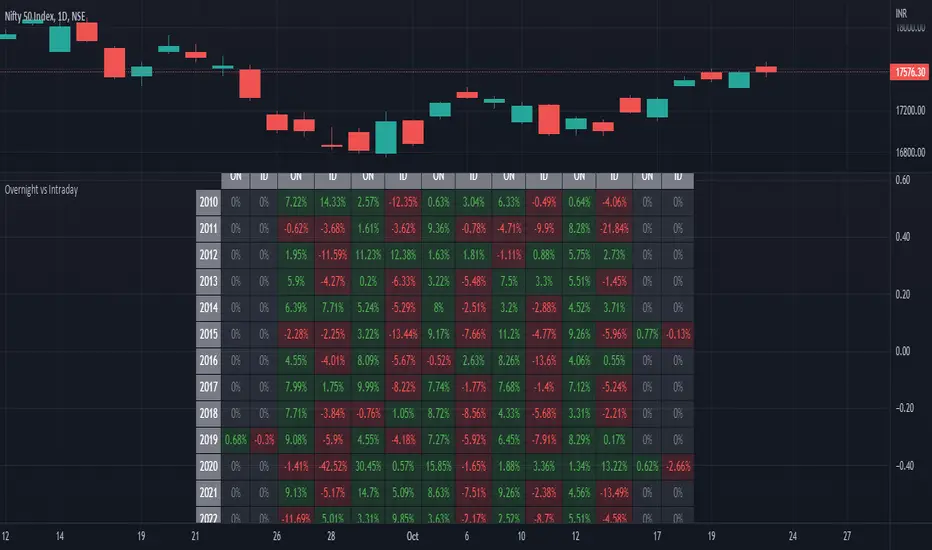
ILM Overnight vs Intraday Performance - Tabular FormUse this indicator on Daily Timeframe
This script compares Overnight vs Intraday Performance based on the Day of the Week (DOW) - Sun - Sat of index/stock/currency/commodity symbols.
ON column indicates Overnight performance = open/close -1
ID column indicates Intraday performance = close-open/1
The calculations are detailed in the tooltips of the individual table cells.
Seasonality DOW - Day Of the Week - Tabular FormUse this indicator on Daily Timeframe
This indicator displays the seasonality data for any instrument (index/stock/ futures /currency) in a tabular data by day of the week - DOW ( Sun - Mon - Tue - Wed - Thu - Fri - Sat ).
User can change the start of the year for analysis from the inputs.
Year is represented in rows and Day of the week (DOW) is represented in cols.
This indicator uses Daily Data feed to calculate the % change
Summary data for DOW displayed as the last row

NSE Open Interest Current + Future Month - OI - COIUse this indicator on Daily Timeframe
This script enhances the standard Open Interest indicator in the following ways
Pulls Current Month and Next Month OI and sums up the data - COI
Works even if input symbol is stock/index and appends Current and Future suffix to pull the data
BankNifty_Component_Stats_StockCloudThis is a summary table for the component top 6 Banks of Banknifty based on the current NSE defined weightage. Explanation of each Column as below:
Price : The current 5 Min close price of the Component mentioned in the rows
Change : The change in terms of number of point wrt to the previous day closing price
Change %: The change in terms of % wrt to previous day closing price
Per Point Chg : How many points Banknifty has moved with 1 point change of the respective component. If HDFC per point chg is shown as 7, it means 1 point move in HDFC has contributed to 7 points move in BankNifty.
Participation : Refers to the total points contributed by the major component. If ICICI participation is shown as 300, it means of the total Banknifty move , a positive 300 points has been contributed by ICICI. if HDFC shows -150. it means HDFC has dragged down Banknifty by 150 points.
TDP : There is a user definable Length "length" in the Input section under settings. If you have given 1 there, this number signifies the number of points contributed by the component bank in the last 5 min. If SBI TDP is shown as 8, it means in the last 5 mins, SBI has added 8 points to Banknifty. If input length is given as 2 , then it means the contribution of that component bank in last 10 mins ( 5*2). TDP= Time Defined Points
Nan : Not applicable
This summary table can be used to know who is actually moving the Banknifty. The current weightage is as follows:
HDFC
ICICI
KOTAK
AXIS
SBI
INDUS
Weightages will be changed as and when NSE changes it.Based on calculated fields above, one can understand how strong the moves are.If the major Banks are contributing more, it means the moves will be stable. If the lower end banks are contributing and top bank are not moving, then the current moves in Banknifty is not strong. It is also recommended to use this stats along with Component Banks charts.
Thanks to Ghanshyam Tech for inspiring to write this script!

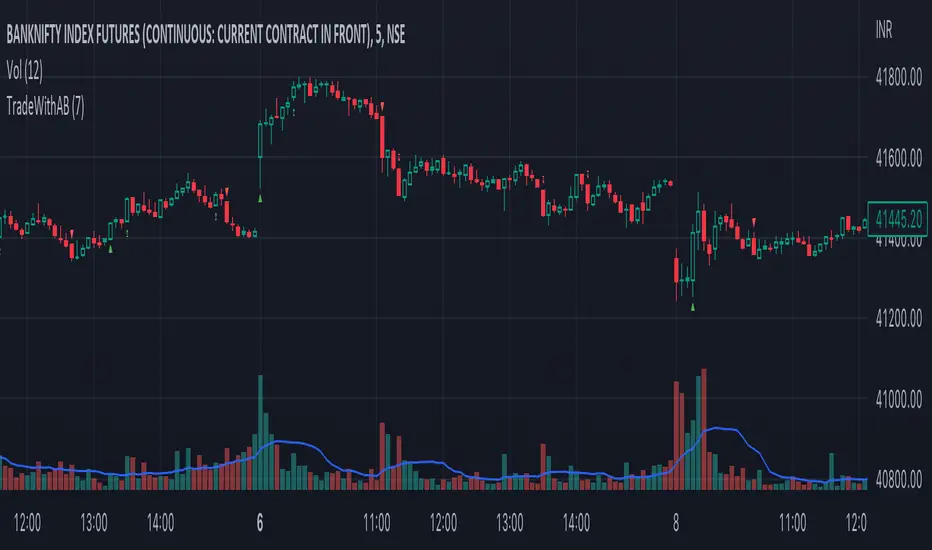
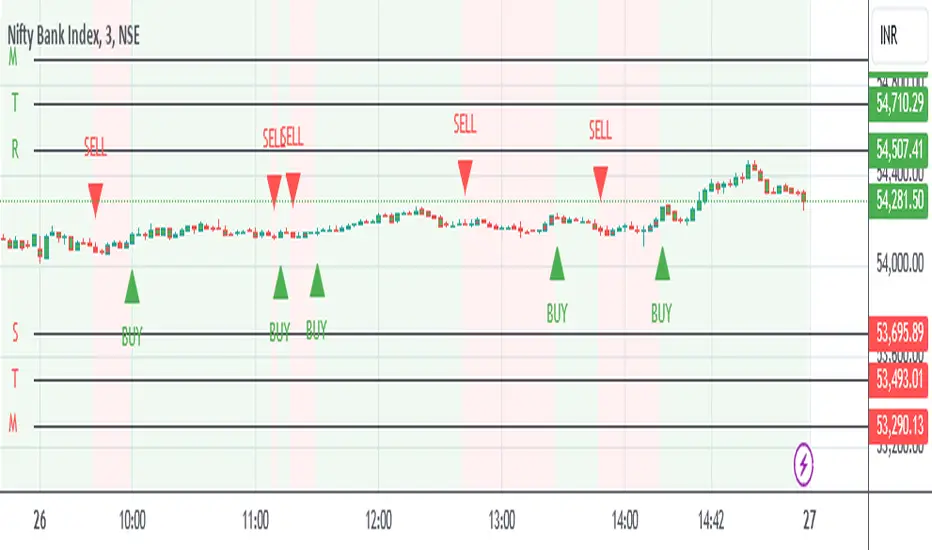
TradeWithAB SignalsThis indicator specifically designed for Momentum trading by an Intraday trader on index( Nifty , BankNifty ) and Equity stocks. This indicator works with DMI and PRICE ACTIONS which gives automated Buy and Sell signals along with Stop loss and Trailing Stop loss when certain criteria are met. It is not a Holy Grail system that gives you continuous profits and it has some limited downfalls also which can be controlled by proper risk Management and position sizing. This is a premium invite only indicator which can be use after given access to you by us. There are some guidelines on how to use this indicator which are given below and you have to follow these guidelines very strictly to get the maximum results.
Guidelines :-
1. Default Timeframe - 5 min
2. You have to take almost all the trade generated by this indicator on a particular stock/index for better results.
3. Signal confirmation is required for enter the trade as it will give you maximum profits.
4. GREEN TRIANGLE is represented as BUY Signal whereas RED TRIANGLE is represented as SELL Signal.
5. GREEN ARROW is considered as BUY TRAILING STOP LOSS as well as BUY RE-ENTRY for some scenarios.
6. RED ARROW is considered as SELL TRAILING STOP LOSS and SELL RE-ENTRY for some scenarios.
7. Ignore the signals(if any) of 1st candle(9:15)and last candle(3:25)of the day for better results.
BUY Trade Management :-
1. Trade should be initiated if and only if there is a buy signal(Green Triangle) is generated.
2. You should only enter the trade at the CLOSE of the signal generated candle.
3. Your Stop loss should be placed at the LOW of the signal generated candle.
4. There is a trailing Stop loss signal (Green Arrow) after the buying signal is generated.
5. You should trail your Stop loss at the LOW of the trailing Stop loss signal generated candle.
6. You should trail your Stop loss repeatedly until your trailing Stop loss got hit and hence Exit your buy trade.
7. After Exiting the trade you always have option to re-enter at the next trailing Stop loss signal(green arrow) generated candle CLOSE and put your Stop loss at LOW of that candle and repeat the same trailing stop loss procedures.
SELL Trade Management :-
1. Trade should be initiated if and only if there is a sell signal(Red Triangle) is generated.
2. You should only enter the trade at the CLOSE of the signal generated candle.
3. Your Stop loss should be placed at the HIGH of the signal generated candle.
4. There is a trailing Stop loss signal (Red Arrow) after the selling signal is generated.
5. You should trail your Stop loss at the HIGH of the trailing Stop loss signal generated candle.
6. You should trail your Stop loss repeatedly until your trailing Stop loss got hit and hence Exit your sell trade.
7. After Exiting the trade you have always option to re-enter at the next trailing Stop loss signal(red arrow) generated candle CLOSE and put your Stop loss at HIGH of that candle and repeat the same trailing stop loss procedures.
Disclaimer :-
*I am not a SEBI Registered Analyst and shall not be liable for any profit, loss or liability resulting, directly or indirectly from the use and results of the indicator. This is not a Holy Grail setup, sometimes the traders hit Stop loss and sometimes it gives amazing results as well.
Instructions to access to this invite-only script:-
*Send us a message if you wish to gain access to this indicator. The subscribers will get benefits of any future development or updates in the current script without any extra charges. Other trading style like swing and positional trading will also available in future updates.
BankNifty ScriptsBank Nifty Script
Indicator provides Daily, Hourly and Weekly EMA's Exponential Moving Averages for different scripts of Bank Nifty Composition. You'll have CMP and % change along with cRSI.
Credit to RozaniGhani-RG for cRSI code.
Default length is 50 you can change as per your choice.
Table display can be set Vertically top, right, bottom and horizontally left, centre, right.
cRSI if above > 70 the label will change to Focus on Sell and less than < 30 label will show Focus on Buy
Basically created this script for my personal use to see in one shot what's happening in Bank Nifty Composition individual scripts.
Hope it helps.

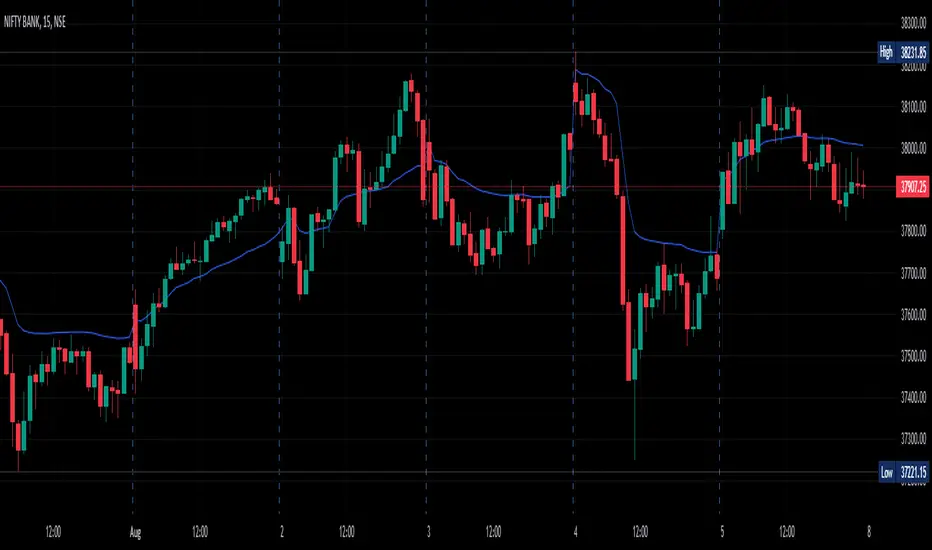
Inside Bar SetupScript Details
- This script plots Inside Bar for given day in selected time-frame (applicable only for Timeframes < Day)
- Basis plotted inside bar, relevant targets are marked on the chart
- Targets can be customised from script settings. Example, if range of mother candle is 10 points, then T1 is 10 * x above/below mother candle and T2 is 10 * y above/below mother candle. This x & y are configured via script settings
How to use this script ?
- This script works well on 10-15 mins timeframe for stocks, 15/30 mins timeframe for nifty index and 30/60 mins time frame for bank nifty index
- If mother candle high is broken, take long trade with SL of mother candle low and if low is broken, take short trade with SL of mother candle high
Remember:
1. Above logic is to be combined with support/resistances i.e. price action. This script is an add-on to price action analysis giving you more conviction.
2. If range of mother candle is very high, it is recommended to avoid the trade.
3. Basis inside bar formed on higher time frame, take trade on basis of lower time frame i.e if inside bar is formed on 60 mins, take trade on the basis of 10-15 mins time frame
Example:
1. As seen in the chart, Nifty is near it's resistance and we are seeing Inside Bar being formed, In such scenario, even if High of Mother Candle is broken, we should be more interested to short as we are near resistance and probability of getting our targets in long side is less.
2. So, if I see breakdown of mother candle i.e. price going below low of mother candle, we will short with SL of high of mother candle.
3. As seen in the chart, both the targets are achieved.
Additional Info:
1. Targets on Long/Short Side can be configured via settings. For indices 1 times/1.5 times the range works well.
2. This script plots targets basis the first inside bar formed in the day for selected time frame.
3. Inside bars formed through out the day are coloured separately but lines are plotted only on the basis of 1st formed inside bar as this strategy works well for the first formed inside bar)
4. Don't forget to check volume in case of breakout/breakdown.
Note:
1. Mother Candle - First Candle of Inside Bar
2. Child Candle - Candle formed inside Mother Candle (Second Candle of Inside Bar)
Happy Trading :)

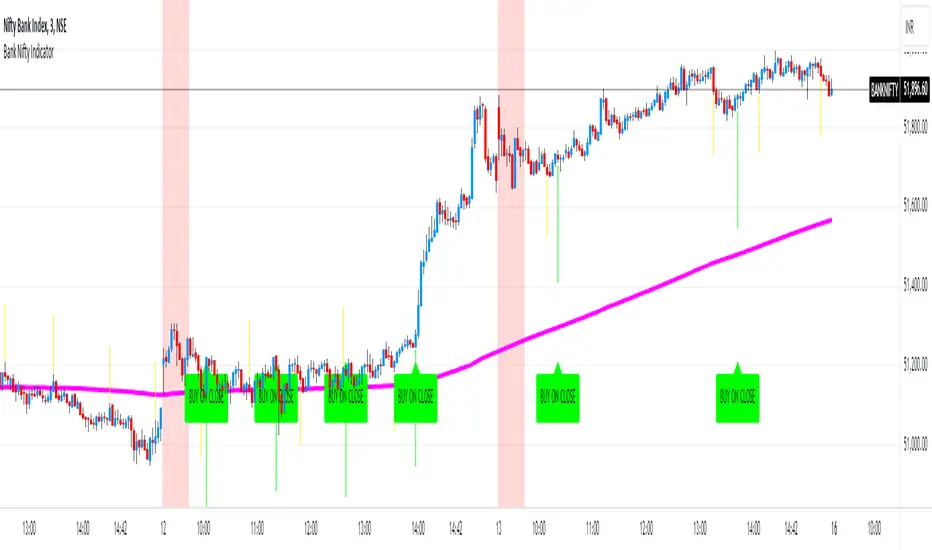
Bank Nifty Indicator by 'Bank Of Nifty'What is this indicator?
The indicator uses a series of Exponential Moving Averages, their directions and crossovers combined with Parabolic Stop And Reverse (SAR) to determine potential intraday entry points on the BANKNIFTY Index. It uses a long-period EMA to filter the direction of trade. For example, when the price is above the long-period EMA, it only generates Buy signals. It generates signals only between 10AM and 02:30PM IST. It has alert conditions for potential Long/Short Entry triggers.
Understanding the indicator plotted on the chart:
- The indicator uses settings that are arrived at after testing multiple conditions. Therefore, it does not allow the user to change these settings as doing so will render the indicator useless.
- EMA Line: One long-period EMA acts as a direction filter for trade signals. If price is above this EMA, only Buy signals are generated and if price is below this EMA, only Sell signals are generated.
- Yellow Arrows: These are early warning signs that a potential entry may be triggering soon. As it uses only some of the entry conditions to predict a potential entry, there can be multiple such signals before an actual signal is generated. These are only meant to be used as alerts and should NEVER be traded individually. Long Warning Alert and Short Warning Alert can be created using the 'Create Alert' dialog box.
- Buy On Close/Sell On Close Signals: These are actual entry triggers that are meant to be traded when confirmed by a candle close.
- Red Background: It indicates the first 30 minutes of the market opening from 9:15AM to 9:45AM.
- Colours for everything appearing on the chart can be customised in settings.
Notes and Usage Guidelines:
- The indicator should only be used on the BANKNIFTY Index for INTRADAY trades .
- For best results, use the 3 Minutes Chart and only trade the day's first signal after a 3 minute candle closes confirming the signal.
- Buy/Sell Signals are only generated between 10AM and 02:30PM .
- These signals work best in trending market conditions. In sideways and range-bound markets, there will be multiple false signals that could lead to losses. Therefore, it is best to limit the number of trades to 1 per day .
Why is this indicator closed source?
This indicator is closed source because it uses a specific combination of settings for indicators that are not available in the public domain, even though the indicators themselves are in the public domain. Keeping it closed source protects these settings from being discovered and as well as preserving them for the indicator to be useful. Without this specific combination of settings and values, the indicator becomes useless.
Disclaimer:
- Trade decisions should NOT be based solely on this indicator. It is meant to aid in confirming a direction bias and act as a confluence to the trader's analysis of the existing market condition.
- The indicator may be updated from time to time to adapt to changed market conditions.
Average Daily Range (ADR) (Multi Timeframe, Multi Period)Average Daily Range (ADR)
(Multi Timeframe, Multi Period, Extended Levels)
Tips
• Narrow Zones are an indication of breakouts. It can be a very tight range as well.
• Wider Zones can be Sideways or Volatile.
What is this Indicator?
• This is Average Daily Range (ADR) Zones or Pivots.
• This have Multi Timeframe, Multi Period (Up to 3 Levels) and Extended Target Levels.
Advantages of this Indicator
• This is a Leading indicator, not Dynamic or Repaint.
• Helps to identify the reversal points.
• The levels are more accurate and not like the old formulas.
• Can practically follow the Buy Low and Sell High principle.
• Helps to keep minimum Stop Loss.
Who to use?
• Highly beneficial for Day Traders
• It can be used for Swing and Positions as well.
What timeframe to use?
• Any timeframe.
When to use?
• Any market conditions.
How to use?
Entry
• Long entry when the Price reach at or closer to the Green Support zone.
• Long entry when the Price retrace to the Red Resistance zone.
• Short entry when the Price reach at or closer to the Red Resistance zone.
• Short entry when the Price retrace to the Green Support zone.
• Long or Short at the Pivot line.
Exit
• Use past ADR levels as targets.
• Or use the Target levels in the indicator for breakouts.
• Use the Pivot line as target.
• Use Support or Resistance Zones as targets in reversal method.
What are the Lines?
Gray Line:
• It the day Open or can be considered as Pivot.
Red & Green ADR Zones:
• Red Zone is Resistance.
• Green Zone is Support.
• Mostly price can reverse from this Zones.
• Multiple Red and Green Lines forms a Zone.
• These lines are average levels of past days which helps to figure out the maximum and minimum price range that can be moved in that day.
• The default number of days are 5, 7 and 14. This can be customized.
Red & Green Target Lines:
• These are Target levels.
What are the Labels?
• First Number: Price of that level.
• Numbers in (): Percentage change and Change of price from LTP (Last Traded Price) to that Level.
General Tips
• It is good if Stock trend is same as that of the Index trend.
• Lots of indicators creates lots of confusion.
• Keep the chart simple and clean.
• Buy Low and Sell High.
• Master averages or 50%.

VWAP For NIFTY & BANKNIFTY [Zero54]NIFTY and BANKNIFTY Being Index do not have VWAP (because there is no volume generated). This is a simple script that displays NIFTY's future VWAP on NIFTY's Spot chart and similarly, displays BANKNIFTY's future VWAP on BANKNIFTY's sport chart. Fast and quick. Just few lines of code. No hefty un-necessary calculations.
No settings necessary. The script automatically detects NIFTY and BANKNIFTY and displays the corresponding VWAP.
Enjoy and share the knowledge. If you love this script, please boost/love this script and add a comment. Cheers!
NSE:NIFTY
NSE:BANKNIFTY
IPB_PBOThis indicator is called Indian Pivot Boss _ Pivot Based Oscillator.
This is an oscillator based on pivot level of each candle. It is based on the concept outlined in the Secrets of Pivot Boss book.
It is the average of mutual differences between fast moving average, medium moving average and slow moving average of the candle pivots. This is then plotted as an oscillator.
When Pivot based oscillator is sloping upwards, it is suggested NOT TO STAY ON THE SHORT SIDE. Staying long side or Keeping quiet are the desirable options.
When Pivot based oscillator is sloping downwards, it is suggested NOT TO STAY ON THE LONG SIDE. Staying short side or Keeping quiet are the desirable options.
This indicator has to be used in conjunction with other indicators and should not be relied on a solo basis.

Banknifty BrahmāstraBanknifty Brahmastra Indicator is a Basic Simulating Indicator.
This indicator is built for capturing trend using average to plot buy / sell signal on chart.
Banknifty Brahmastra Indicator integrates visual labels to easily interpret signal for common people.
This indicator is also provide simple color code while trend continuations into candle colour along with background colour for confronts with trading decisions.
This basic indicator can use as an entry / exit reference points into complex strategies.
This Indicator can be used for any stocks and indexes but Indian traders can use this for especially into bank nifty futures & options to get maximum positive result decisions.
Supply and Demand MultiTimeFrameWhat Is the Law of Supply and Demand?
The law of supply and demand is a theory that explains the interaction between the sellers of a resource and the buyers for that resource . The theory defines the relationship between the price of a given good or product and the willingness of people to either buy or sell it. Generally, as price increases, people are willing to supply more and demand less and vice versa when the price falls. ( -Investopedia )
This Indicator Help's you to find possible Supply and Demand zones formed on chart on MultiTimeFrame.
All the Supply Zones are colored RED and are above the current price. It will vanish once price crosses over it.
All the Demand Zones are colored GREEN and are below the current price. It will vanish once price crosses under it.
Only Untested Zone are plotted on chart.
These zones can be plotted on Chart TimeFrame as well as MultiTimeFrame(Higher). That can be selected from Input Section.
Concept Behind the Zones
1. Rally Base Rally
2. Drop Base Drop
3. Drop Base Rally
4. Rally Base Drop
Drop base rally
Rally base drop
rally base rally
drop base drop
For Supply zones we try to find "Drop Base Drop" and "Rally Base Drop" , and plot RED zones on the width of base. Base can include any number of candle ranging from 1 to 6. This can be controlled from Input Section
For Demand zones we try to find "Rally Base Rally" and "Drop Base Rally" , and plot GREEN zones on the width of base. Base can include any number of candle ranging from 1 to 6. This can be controlled from Input Section
How to Trade
We recommend to use 5-8 time Higher TimeFrame as Supply and Demand Zones. For Example if chart is at 5 min Timeframe then Zones should be plotted on 25 min to 40 min TImeframe.
And when Price reaches closer to Supply/ Demand Zone then use some other indicator to confirm the reversal from that level, like trendline , moving average etc.
Targets should be nearest Supply/ Demand Zone .

BankNifty VWAP VWAP - Volume-Weighted Average price ( VWAP )
The script draws Daily VWAP for BANKNIFTY SPOT , based on Futures Volume or underlying Index Stocks based on user input
BANKNIFTY INDICES IS THE WEIGHTAGE OF 12 STOCKS AS DECIDED BY EXCHANGE.
BANKNIFTY VWAP CALCULATES THE COMBINED VWAP OF THESE 12 STOCKS AND GENERATES VWAP FOR BANKNIFTY
It works with NIFTY as well. Please change the Symbol and Futures Volume symbol to "NSE:NIFTY" and "NSE:NIFTY1!"
NIFTY INDICES IS THE WEIGHTAGE OF 50 STOCKS AS DECIDED BY EXCHANGE.
NIFTY VWAP CALCULATES THE COMBINED VWAP OF THESE 50 STOCKS AND GENERATES VWAP FOR NIFTY
This script is intended for educational purposes only.
03/07/2022 WEIGHT AGE OF INDEX STOCKS (%)
HDFC Bank Ltd. - 27.63
ICICI Bank Ltd. - 22.98
Kotak Mahindra Bank Ltd. - 11.40
State Bank of India - 11.73
Axis Bank Ltd. - 11.6
IndusInd Bank Ltd. - 5.03
AU Small Finance Bank - Ltd. 2.54
Bandhan Bank Ltd. - 1.98
Bank of Baroda - 1.76
Federal Bank Ltd.- 1.76
PNB - 0.84
IDFC First Bank - 0.95

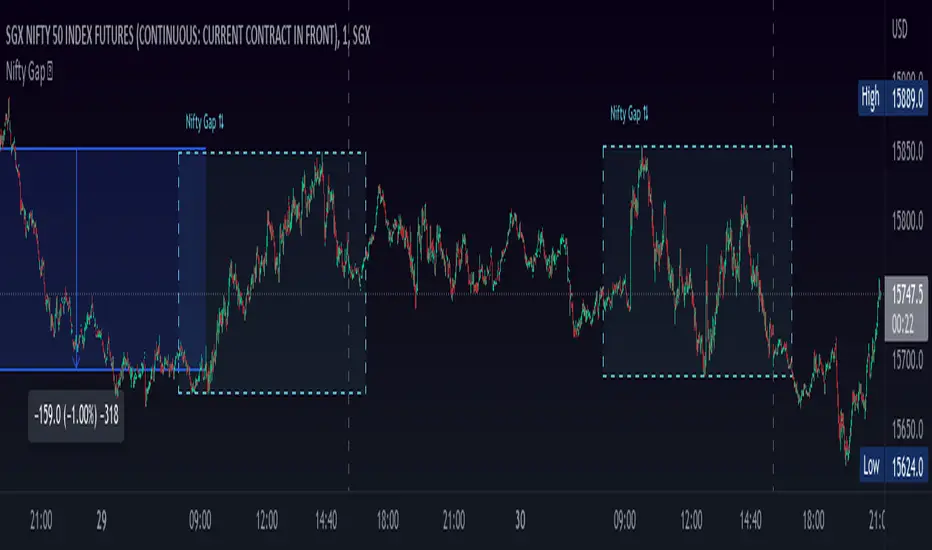
Nifty Gap ⇅This indicator help to find NIFTY gap up or gap down opening,
use this indicator on SGX NIFTY
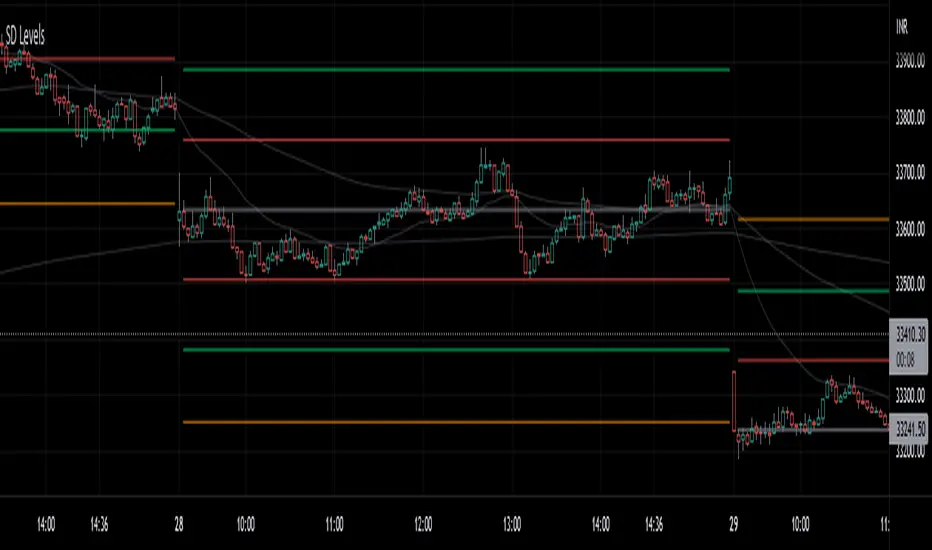
SD LevelsSD Levels is an indicator for the gap-up gap down markets
Works best on 5minute and lower time frames.
Involves standard deviation levels, Emas and Vwap.
Colorful lines are standard deviation levels which are +0.33,-0.33,+0.66,-0.66,+1.00 and -1.00 based.
Static Gray line is settlement line based on the first candle of the day and the tf you choose (default source OHLC4, also works good on close source)
Nifty VWAPVWAP - Volume-Weighted Average price (VWAP)
The script draws Daily VWAP for Nifty , based on Futures Volume or underlying Index Stocks based on user input
NIFTY INDICES IS WIEGHTAGE OF 50 STOCKS AS DECIDED BY EXCHANGE.
NIFTY VWAP CALCULATES COMBINED VWAP OF THESE 50 STOCKS AND GENERATES VWAP FOR NIFTY
It works with BANKNIFTY as well. Please change the Symbol and Futures Volume symbol to "NSE:BANKNIFTY" and "NSE:BANKNIFTY1!"
BANK NIFTY INDICES IS WIEGHTAGE OF 12 STOCKS AS DECIDED BY EXCHANGE.
BANK NIFTY VWAP CALCULATES COMBINED VWAP OF THESE 12 STOCKS AND GENERATES VWAP FOR BANK NIFTY
This script is intended for educational purposes only.
26/06/2022 WEIGHT AGE OF INDEX STOCKS (%)
RELIANCE INDS = 12.51
HDFCBANK = 8.38
INFY = 7.58
ICICIBANK = 7.21
HDFC = 5.75
TCS = 4.8
KOTAKBANK = 3.74
ITC = 3.26
HINDUNILVR = 2.89
LT = 2.75
AXISBANK = 2.49
SBIN = 2.47
BHARTIARTL = 2.28
BAJFINANCE = 2.23
ASIANPAINT = 1.78
HCLTECH = 1.52
MARUTI = 1.46
M_M = 1.36
SUNPHARMA = 1.28
TITAN = 1.27
TATASTEEL = 1.17
TATAMOTORS = 1.1
POWERGRID = 1.1
BAJAJFINSV = 1.08
NTPC = 1.02
TECHM = 1.01
ULTRACEMCO = 0.97
WIPRO = 0.97
NESTLEIND = 0.87
HINDALCO = 0.85
INDUSINDBK = 0.83
HDFCLIFE = 0.77
ONGC = 0.76
GRASIM = 0.74
DRREDDY = 0.73
JSWSTEEL = 0.73
ADANIPORTS = 0.73
SBILIFE = 0.71
CIPLA = 0.71
BAJAJ_AUTO = 0.69
TATACONSUM = 0.63
DIVISLAB = 0.63
UPL = 0.59
BRITANNIA = 0.59
APOLLOHOSP = 0.56
COALINDIA = 0.56
EICHERMOT = 0.53
HEROMOTOCO = 0.5
BPCL = 0.43
SHREECEM = 0.41
