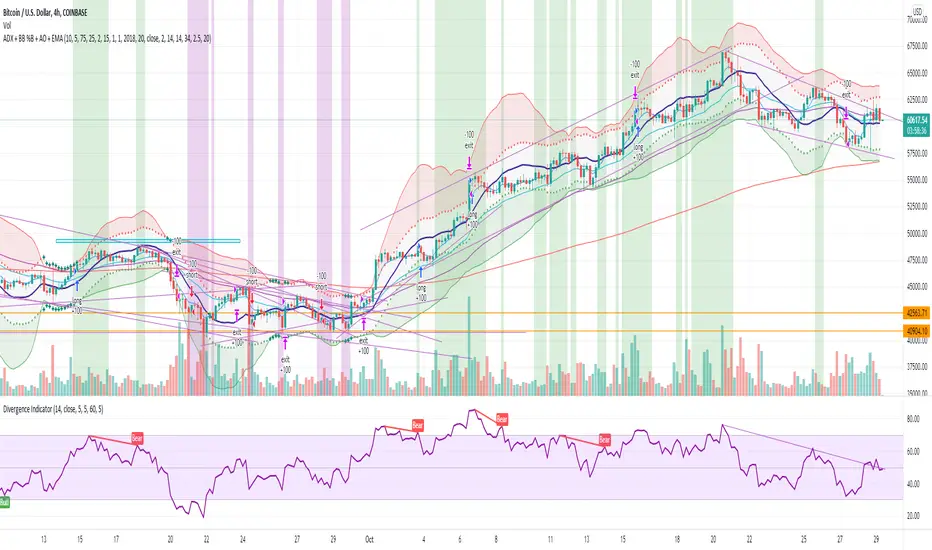
ADX + BB %B + AO + EMA [Luca Massuda]This trading strategy combines different indicators:
1) ADX, Average Directional Movement: to spot the trend
2) BB %B Bollinger Band %B: to spost relative price position to Bollinger Bands
3) AO Awesome Oscillator: to spot momentum
4) ema 5,ema21, ema50, ema200: to decide long or short position
You can configure:
Take profit % : at which % gains to take profit from the entry price
Stop loss % : at which % stop loss from the entry price
BB %B Overbought: At which level you consider Overbought respect to Bollinger Bands (values 0 to 100)
BB %B Oversold: At which level you consider Oversold respect to Bollinger Bands (values 0 to 100)
Awesome Oscillator: AO level to consider a long or short position +/- 2
ADX: ADX value to consider a long or short position
Start Date, Month, Year: Starting point for a backtesting strategy
Lenght , Source , Standard Deviation: Bollinger Bands values
ADX smoothing, DI Lenght: ADX values
Green and purple zones indicate when the strategy can go long or short.
Default Long conditions:
ema5>ema21 and ema50>ema200 and bb>75% and ao>2 and adx>15
Default Short conditions:
ema515
Chỉ báo Bill Williams
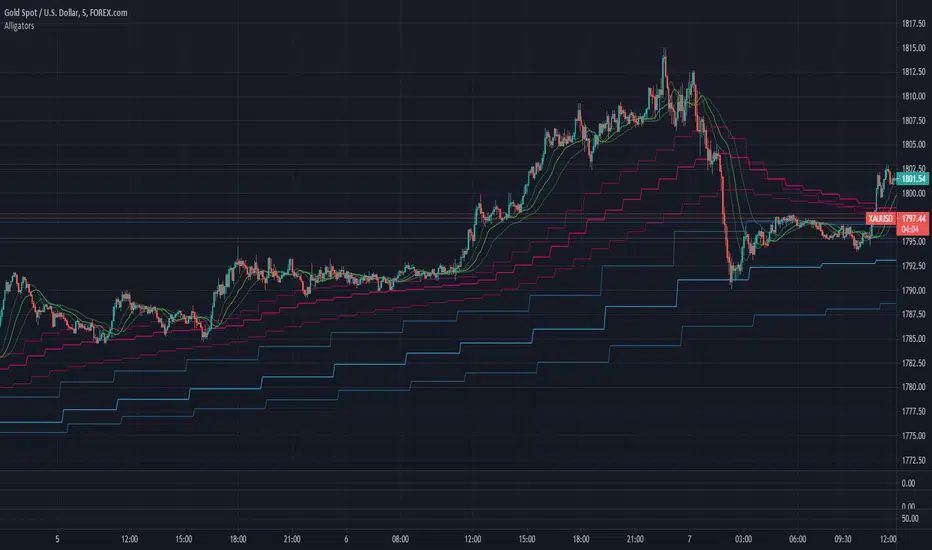
Triple Williams Alligator (MTF)This script is simply a Multi time frame version of the built in Williams Alligator script.
Higher time frame Alligators can often produce resistance and support as traders on different timeframes react to them. They can also act as a trend filter.
Fractal Fire Zones/Wave RiderMulti timeframe confluence reader: This indicator plots fractals on any specific timeframe selected, multi time frame ema cross that changes color with the trend, multi timeframe 200ema and a calculation that shows potential turning points with a multi timeframe stochastic oscillator confluence. The fire zones are preferred in a ranging market or for potential scalps while the ema trend is designed to keep you with the main trend in any given session. The accumulation/distribution candles can be used to gauge pull backs for re entry or exits based on time or multiple confirmations.

Pivot Boss -- Squat bars and Non Squat Bars 2.0Squat Bar Signal -- current Volume is greater than previous volume but Current bar MFI(Market Facilitation index) is lesser than previous bar MFI
Other Conditions -- Current Bars Range is lesser than (Average Range * Range Multiplier)
Non Squat Bar Buy Signal(Green Up Triangle) -- Volume and MFI is greater than previous bar, Close greater than open, Close is greater than midpoint
Non Squat Bar Sell Signal(Red Down Triangle) -- Volume and MFI is greater than previous bar, Close lesser than open, Close is lesser than midpoint
Usually Squat signal is confirmed by Non Squat Bar Signal..
Other indicator used -- PEMA -- Pivot based EMA
For Better results use it along with Advanced Volume indicator and PEMA
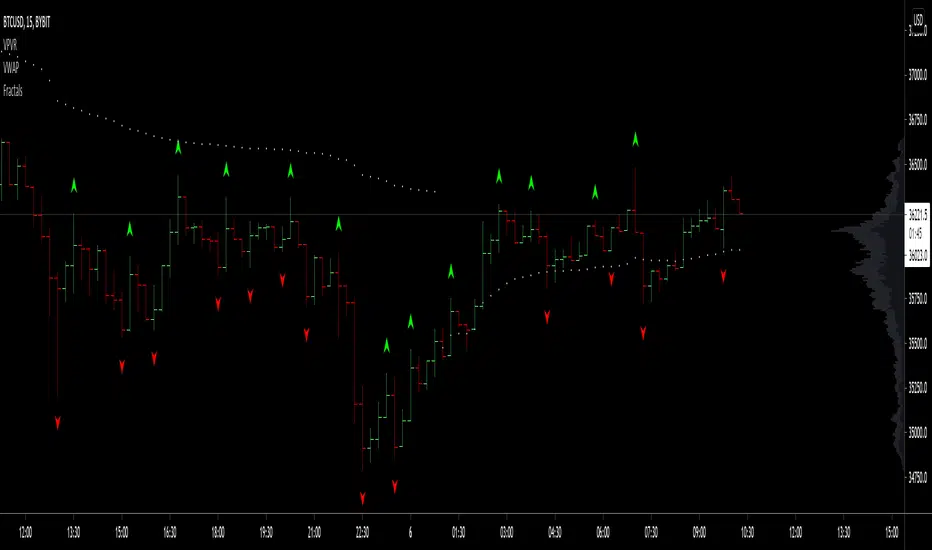
VIX Fix Double PleasureFULL README: github.com/samgozman/vix-fix-double-pleasure
The idea of an oscillator is quite simple. It is based on the popular VIX Fix oscillator, the purpose of which is to find local bottoms within the scope of trend movement. But in addition to the classic VIX fix, I built an oscillator opposite to it, which serves as a potential signal of the end of local growth.
Components
VIX Fix classic (red lines)
VIX Fix reversed (green lines)
Buy/sell signals (colored dots)
Parameters
VIXFix_length - defval: 22. Classic length for VIX fix
VIXFix_arraySize - defval: 22. The number of periods among which to look for lows and highs. If there are too many signals, reduce this value.
plotMarks - defval: true. Plot high/low marks
How it is calculated
VIX fix classic: (highest(close, VIXFix_length) - low) / highest(close, VIXFix_length) * -100
VIX fix reversed: (lowest(close, VIXFix_length) - high) / lowest(close, VIXFix_length) * -100
Signals
🟢 Buy signal if current "VIX fix classic" or "VIX Fix reversed" value is lowest from the last VIXFix_arraySize periods.
🔴 Sell signal if current "VIX fix classic" or "VIX Fix reversed" value is highest from the last VIXFix_arraySize periods.
General recommendations
I advise you not to use this oscillator for a short positions. Long only . It is recommended to set a long position by pyramiding.

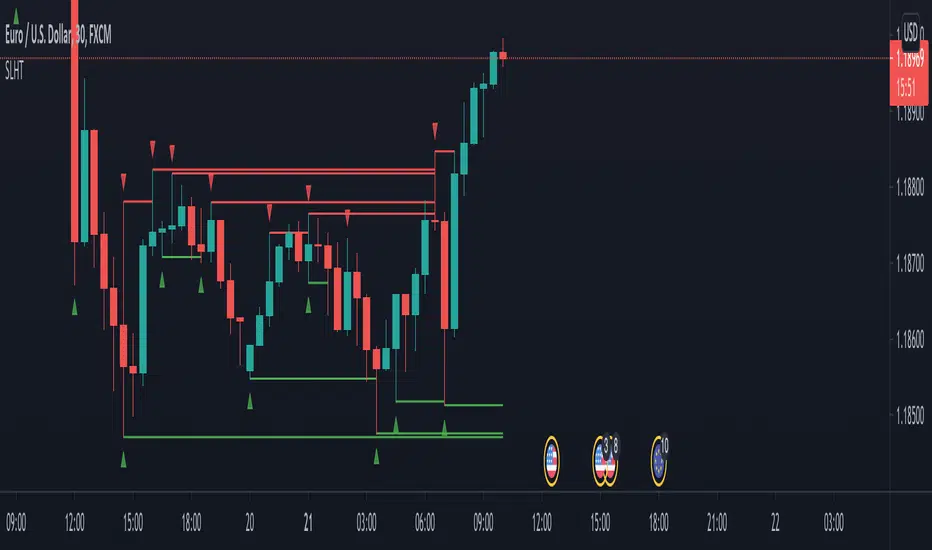
SL Hunter Tracker SL Hunter Tracker
coded by Bogdan Vaida
SL Hunter Tracker is a meticulous hunter that tracks SL hunters.
First it plots the fractals on the chart, then it draws lines from them
to the last wick that touched that height. You can add sweep alerts, once
per bar close, so that you get notified when a wick was touched.
Tested on: EURUSD 30'
Technical Analysis Consulting Table (TACT)Inspired by Tradingview's own "Technical Analysis Summary", I present to you a table with analogous logic.
You can track any ticker you want, no matter your chart. You can even have multiple tables to track multiple tickers. By default it tracks the Total Crypto Cap.
You can change the resolution you want to track. By default it is the same as the chart.
You can position the table to whichever corner of the chart you want. By default it draws in the bottom right corner.
Background colors and text size can be adjusted.
Indicators Used:
Oscillators
RSI(14)
STOCH(14, 3, 3)
CCI(20)
ADX(14)
AO
Momentum(10)
MACD(12, 26)
STOCH RSI(3, 3, 14, 14)
%R(14)
Bull Bear Power
UO(7,14,28)
Moving Averages
EMA(5)
SMA(5)
EMA(10)
SMA(10)
EMA(20)
SMA(20)
EMA(30)
SMA(30)
EMA(50)
SMA(50)
EMA(100)
SMA(100)
EMA(200)
SMA(200)
Ichimoku Cloud(9, 26, 52, 26)
VMWA(20)
HMA(9)
Pivots
Traditional
Fibonacci
Camarilla
Woodie
WARNING: I have observed up to a couple of seconds of signal jitter/delay, so use it with caution in very small resolutions (1s to 1m).
I hope you enjoy this and good luck with your trading. Suggestions and feedback are most welcome.

FractalFractal indicator by Igor, this will Aid new traders find swing lows/highs
On the original indicator, the icons don't look too good, so I made this one instead, enjoy!
[TS] Market ScannerThis indicator is a Market Scanner (or Screener) based on our main indicator 'TrustedSignals'
The first option of the Market Scanner is the 'Script Version' (V1 or V2). Users can select which version of the Buy/Sell indicator they want to use.
The second option of this indicator is the 'Signals Settings'. By default this is set to 'Manual', which allow users to have full control over the signals by adjusting the next 2 inputs ('Reactivity' and 'Depth')
'Signals Settings' input has 3 more options the users can choose from, depending on their trading style and frequency of trades ('ScalpTrading', 'SwingTrading' and 'HoldTrading')
The 2 main Input options for the Buy/Sell algorithm are 'Reactivity' and 'Depth'. By default, the indicator is added to your chart with the best settings we've found so far.
-The 'Reactivity' controls how quickly the algorithm reacts to trend changes. The higher the reactivity, the fewer trades on the chart. If the Reactivity input is low, the algorithm will react more quickly, and show more frequent trades.
-The 'Depth' controls the position of the signals relative to the trend swing. A lower Depth will allow for more frequent and earlier entries, while a higher Depth will give slower entries.
The Scanner displays the state of 30 selected pairs, indicating the last signal side: 'Long Position Active' or 'Short Position Active'
If within the last 2-3 candles, the indicator detected a Buy or Sell signal, it will display a "BUY Now!" or "SELL Now!" warning for that pair.
* The Market Scanner will show last signal's sate or current buy/sell signals based on the displayed chart Timeframe

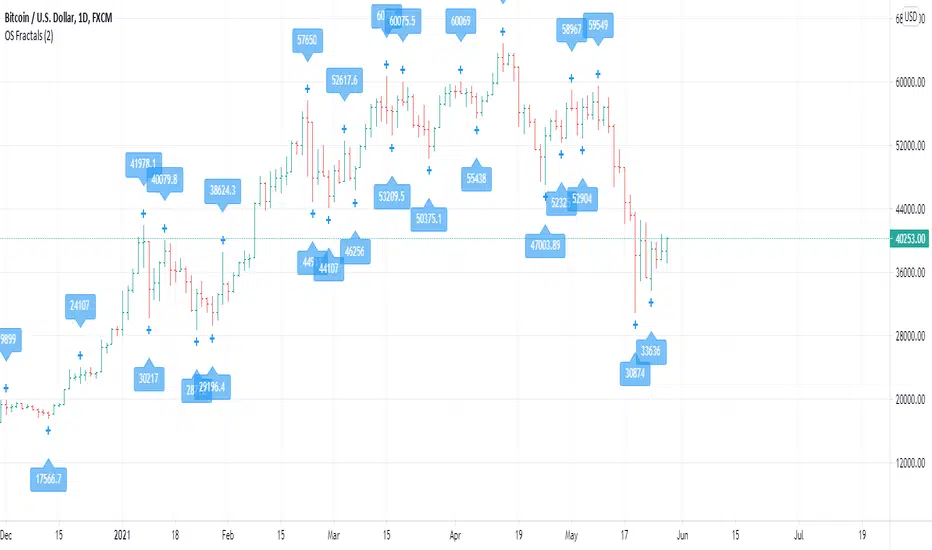
OS FractalsAn up fractal is formed when a high is both preceded and followed by lower highs. A down fractal is formed when a low is both preceded and followed by higher lows.
Bill Williams uses a period of 2 (2 after and 2 before) to define a fractal. This indicator has 2 as default but lets you decide the range you want.
The indicator lets you also select alerts when price crosses an up of down fractal, which would usually mean to entry a position. This indicator works best when used with an alligator, as long signals are valid above the Balance Line and short signals are valid when triggered below the Balance Line.
Any comments for improvement are welcome.
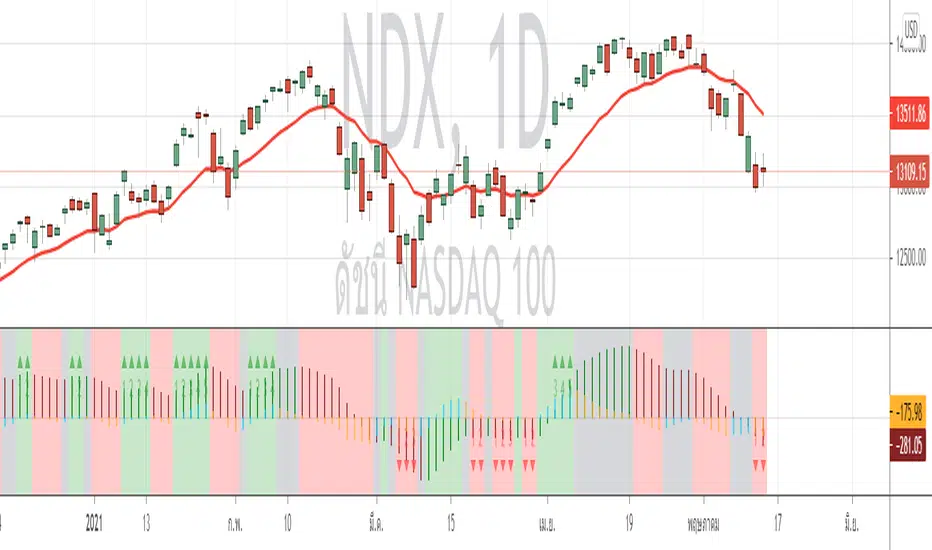
Nasdaq Day and night breakdownOrange: the (close - open) of NQ before market open
Blue: the (close - open) if NQ after market open
White wicks: the vibrating range of that day

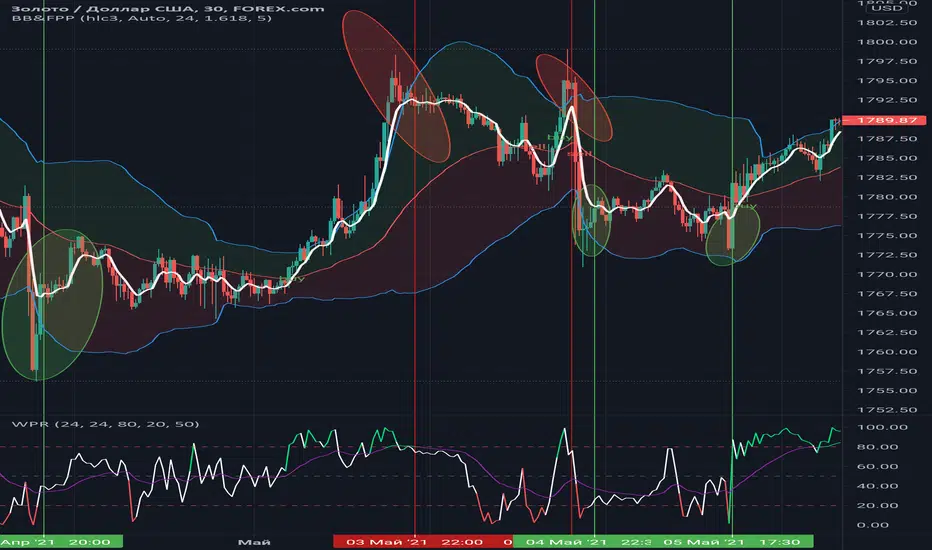
Williams %RHi! WPR is the Williams percentage range indicator in my design. The main idea is that the intersection of the indicator and the moving average in the overbought and oversold zones + color highlighting gives more clear visual signals for making trading decisions based on this indicator.
AO-ZoneThe Zone is mention in New Trading Dimensions by Bill Williams,PhD.
The Zone is used for Entry Signal
Green Zone are painting Green when Awesome Oscillator (AO) and Accelerater/Decelerator (AC) are both increasing.
Red Zone are painting Red when Awesome Oscillator (AO) and Accelerater/Decelerator (AC) are both decreasing.
Gray Zone are painting Gray when AO and AC in difference changing
Gray Zone are indicate the indecision between bulls and bears.
Bill Williams, PhD. mention that Green Zone or Red Zone usually happen 6-8 bars Continuously.
(in my opinion, it happen lower than in intraday time frame)
The First Bar that change to be Green or Red color is the Signal Bar.
Entry Signal is the second bar in the same color as the Signal bar happen with Volume
Price go higher the high of previous Green Bar is Buy Signal. Entry Buy (Long) and place Stop at 1 tick lower the Low of previous bar.
Price go lower the Low of previous Red Bars is Sell Signal. Entry Sell (Short) and place Stop at 1 tick higher the High of previous bar.
Can Entry from 2nd bar to 5th bar.
Do not Entry if Green Bars or Red Bars completed 5 bars continuously.
This indicator have AO , AC and Zone in 1 tools and there are counter to show the number of Green bar or Red bar.
Green counter will happen when AO >0 and Green zone because AO > 0 show uptrend condition.
Red Counter will happen when AO < 0 and Red Zone because AO <0 show downtrend condition.
When we entry , we should follow the trend. So I design to non-show the counter if zone is against the trend.
#WaveRiders
Fractal lines multi time framePlot lines using last two William's fractals to find trends, it supports different resolutions and alerts

Fractals ROC AlertI am playing William's Fractals and got an idea to calculate each fractal's strength by these rules:
- downFractal. FractalROC = (close - lowest(n+1))/(open【2*n】-lowest(n+1))
- upFractal FractalROC = (highest(n+1)-close)/(highest(n+1)-open【2*n】)
And set up a level to filter small fractals.
Bigger FractalROC, Stronger trend

William %R Scalper for Gold with tortle WPRWilliam %R Scalper with Tortle WPR is small update from WPR Scalper tool. It is used with small time frame : 5 , 3 or 1 minute.
it uses tree different William %R indicators : one for fast move with 9 period WPR9 and one slow with 54 period WPR54 pLus tortle WPR 255.
You can find buy zone when WPR255< -90 WPR9 < -90 and WPR54 < -80 and sell zone when WPR 255 > -20, WPR9 > -10 AND WPR54 > -20. Tortle WPR (255) provide price trend

AOAHey Fam,
Welcome to the AOA.
It's my Awesome Oscillator I use every day in conjunction with Renko. Very powerful for spotting divergences and provides great confluence for level to level traders. Can also be used on a candle chart for trend confirmation.
Also includes the labels for divergences, toggleable inside the settings box when applied to your chart. (They're disabled on my chart)
Alerts include:
1. AO Bear Div
2. AO Bull Div
3. AO Crossing Down 0
4. AO Crossng Up 0
5. AO Two Tick Bear
6. AO Two Tick Bull
** Two tick is a great confirmation signal. **
Enjoy!
Williams %R two linesCompare relative strength between two lines of Williams %R
Default daily length1=21, length2=42
Long When 2 lines Crossed above -80 or -50 together
Short When 2 lines Crossed below -20 or -50 together
Notes:
I am not good at short yet. Only Show long samples here.

SMT V11 BY Stock_InshotsHello , i Combined 3 Indicators to generate buy /sell signal
1) Super Trend
2) Simple Moving Average
3) Williams Fractal Indicator.
I thank Trading View to keep all these indicators source code open so i was able to combine and customized as per requirement.
In settings one may change use different period of super trend as well Sma
This works best on 10 min chart.
Buy Setup : after buy signal one can wait for fractal confirmation below the candle and place order above High of that candle with buffer of 0.01% in LTP
or one can place order near to Sma 50 as after Signal as it will come to retest . Reversal Strategy for good Risk Reward Ratio
Sell Setup : After Sell Signal one can wait for fractal Confirmation below the candle and place the order below the low of the candle with buffer of 0.01% in LTP
Note : It may not give good results on Forex better do your on research with different Periods on different time frames
I am not SEBi Registered to advice on your investment. Consult your Financial Advisor before investing on any idea
Please give feedback for Modification/ Suggestions are most welcome.
Thank you trading view a great platform. i am publishing this in protected mode as some ,copy and start selling these type of indicator by invite-only links. i wish to help retailers.
Refer chart for understanding of buy/sell setup
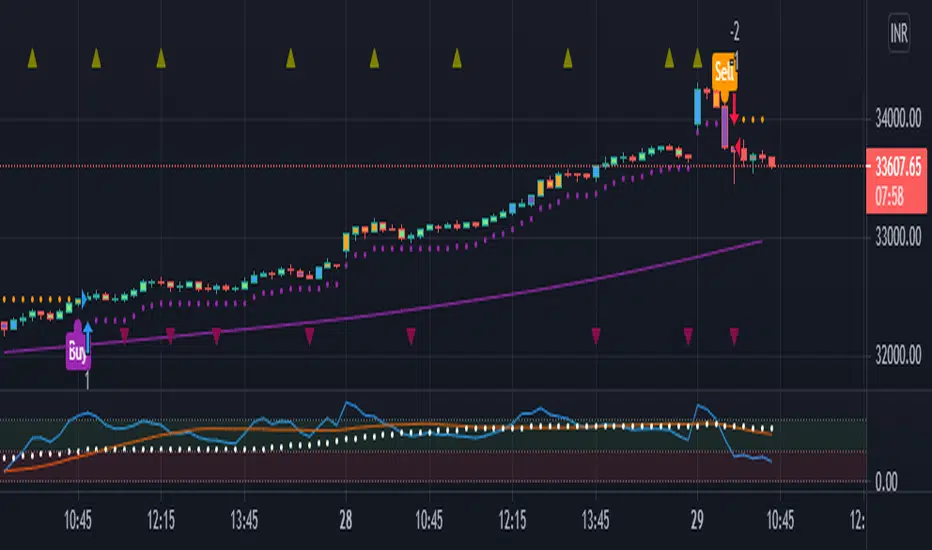
ToTitans - AJ Jim : Type 2 Plus + Alligator (Future & Intraday) What is it ?
It is a strategy based on Type 2 from AJ Jim Class. It used a volume indicator at the same time as William Alligator given a magnificent result. With a bit of knowledge in his class for hedging, it will make your trade perfect.
Must use with 3 indicators 1) ToTitans - TVI , 2) ToTitans - Buy/Sell HHV and 3) ToTitans - Williams Alligator with Life Line. However this strategy already include Williams Alligator with Life Line.
Has no need to add those 3 indicators to use this strategy. Those 3 indicators are included in the signal already. However, the additional indicators are only for visualisation purpose
This strategy aims for giving the user to get a bear and bull icon signal for considering long and short from those combined indicators. However, its performance required a hedging and money management for drastically improve on WinRate and Profit.
This version is optimised for Future and Intraday Timeframe
How to Use it ?
You can use either TVI or Buy/Sell HHV to determine the trend of the trade. Especially the when Buy/Sell Volume is hit the HHV and TVI hit the HHV or LLV as dotted in the those indicators
Using Life Line while enter the cloud as an entry signal
Using Life Line while exit the cloud as an exit signal
Apply Money management for a better performance
Also you can set alert to your phone for Long and Short Entry Signal
Differentiation
The calculation formula has been improved for a better performance
Suitable for
Intra Day Trading (20m-2h). Best for 30m
TFEX:S501!

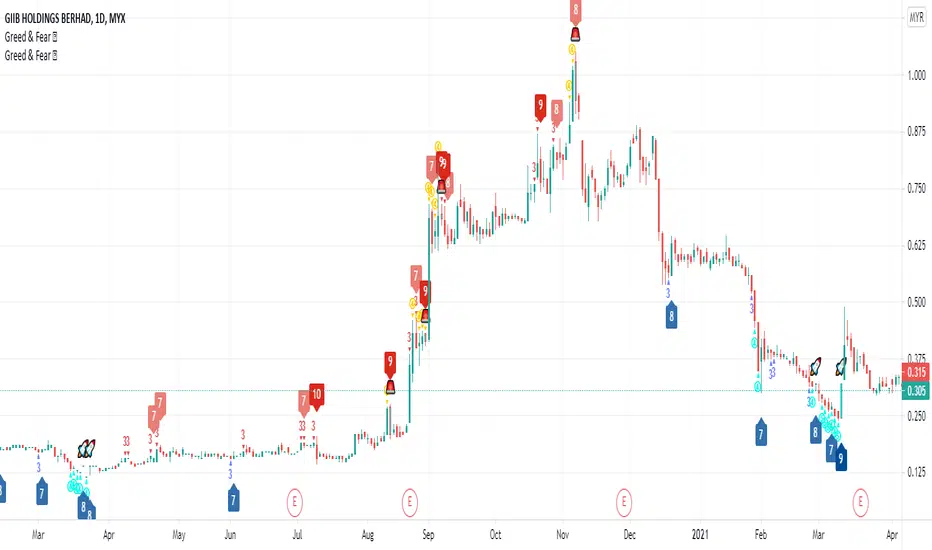
Greed and Fear ScoreHi All,
This is Greed and Fear Score script. The uses of this indicator is to let users know what is the state for each bar closed.
Warren Buffett once said that it is wise for investors to be “fearful when others are greedy, and greedy when others are fearful.
Greed & Fear Score (range from 1 - 5) has taken multiple measurements into consideration such as CCI, MFI, RSI, RVI and William %R.
The range of score is from 1 - 5 indicating weak to strong.
Red/Yellow represents Greed score.
Blue/Light Blue represents Fear score.
The Bull & Bear Transition Score (range from 1 - 10) is to measure how strong power needed to reverse the Greed or Fear State.
It is a powerful tool that incorporates CMF, MFI, CCI, MOMENTUM, OBV, RSI, RVI, WILLIAN %R, PRICE OSCILLATOR and Relative Volume.
How to use Bull & Bear Transition Score?
The higher the Bull & Bear Score, the more likely it will change from one state to another.
How to find BEST opportunity? Here comes the special symbol.
User can choose best fit combination by using filtering.
OS HiLo TrackingIndicator plots a dynamic horizontal line for tracking the highest high and/or lowest low in your desired time-period.
You can select both the period, and whether an alert is produced when the price crosses the last highest high or lowest low.
When used when other Williams indicators, this can help you set your trailing stop for profit-taking.

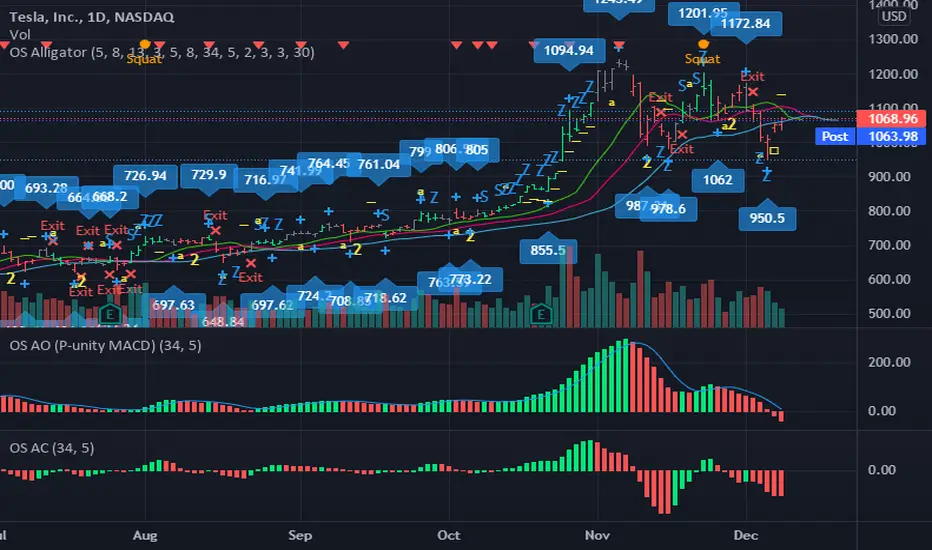
OS AlligatorOS Alligator includes Bill and Justine Williams´ indicators explained both in their "New Trading Dimensions" and "Trading Chaos: Second Edition" books. This script replicates the visual alerts shown on their graphs.
OS Alligator includes:
- Fractals (with labels for easy reading)
- Divergent Bars (signaled by top and bottom triangles)
- Zone bar colors (the bar is green when both AO and AC are green, red when both are red, and black when different)
- Zone buys and sells (subsequent AO of the same color), with letter Z
- Saucer buys and sells, with letter S
- Highest High and Lowest Low tracking (for traling stop setting)
- Balance line (Teeth) crossover alerts
and of course the Alligator's Mouth (Lips, Teeth, Jaw) with SMMA.
All these functions are customizable both in periods and in color. For example if you want to modify the Fractal or HiLo periods you can do so.
You can also add alerts based on any or all indicators.
Thank you for reading. Any comments for improvement are welcome.
-ownsov