RSI + BB Scalping StrategyThis strategy uses the RSI indicator and the Bollinger Bands to identify trade entries while using the ATR to determine stop-losses. The strategy only triggers when both the RSI and Bollinger Band indicators are both either overbought or oversold.
This indicator is free to use. Trade at your own risk.
Dải Bollinger (BB)

Bollinger_Bands_Strategy(Add Function) - BB Free (By Wolf)전략 및 지표 얼러트등 파인스크립트 제작 문의 - 트레이딩뷰 메시지
Contact to create strategy and indicators add alert etc - TradingView Message
이름(Name)
Bollinger Bands Strategy (Add Function) (By Wolf)
-해당 전략은 Long & Short 의 신호를 발생시키는 전략입니다.
-The strategy is to generate a signal from Long & Short
기능 추가(Add Function)
-Trade Direction Long
-Trade Direction Short
-Stoploss ($)
-Profit target($)
-Backtest date
해당 전략은 수익률이 높은값으로 임의로 변경해놓았습니다
본인의 투자전략에 맞는 수치로 변경하여 사용하셔도 좋습니다.
*I entered the value with good profits settings for the strategy.
You can use this customarily
소스코드(Source code)
-비공개 (not open to the public)
*모든 전략은 리페인트 코드를 등록하지않았습니다.
-All strategies do not register the repaint code
*모든 전략 및 지표의 백테스트 결과는 BITMEX Fee 0.075% 를 입력한 결과값입니다.
-The back test result for all strategies and indicators is the result of inputting BITEX Fee 0.075%
*모든 거래는 높은 위험을 수반하며, 과거 백테스트 결과가 반드시 현재 및 미래의 결과를 나타내는것은 아닙니다.
가상 또는 시뮬레이션 백테스트 결과는 한계를 가지고 있으며 실제거래와 시장의 변동 및 유동에 따라 똑같지않을
가능성이있으며, 모든 손실에 대한 책임은 본인에게 있습니다.
-All trade involve high risk, and past backtest results do not necessarily represent current and future results.
Virtual or simulated backtest results have limitations and are not consistent with actual transactions and market changes and flows
It is possible and you are responsible for any loss.


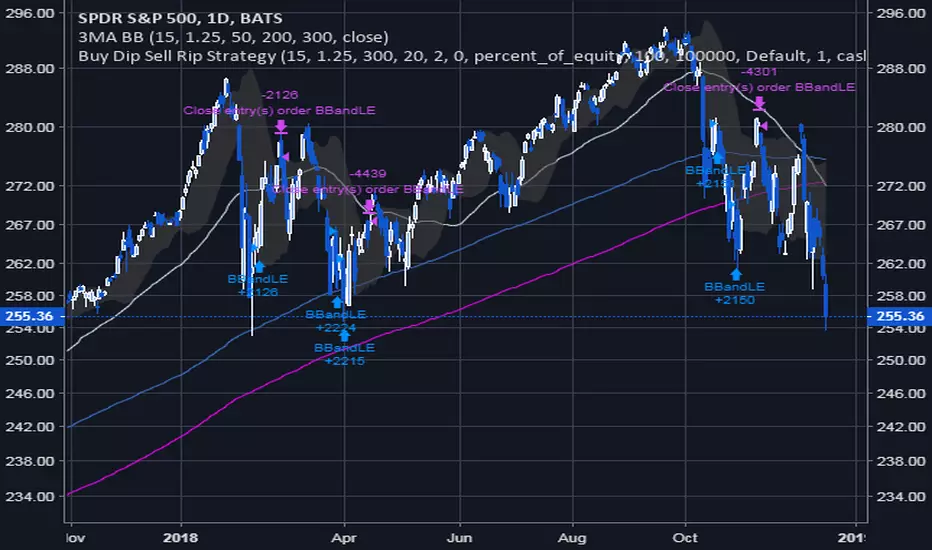
Buy Dip Sell Rip StrategyThis simple system buys the dip and sells the rip, depending on the trend of a long-term moving average. This strategy shows several interesting features. Applied to the S&P500, it still is a loser in a bear market, even though it achieves a 59% win rate. Overall, this shows the power of buying dips as an investment strategy, and shows promise as a base for other more short-term trading strategies.
Feel free to donate : )

inwCoin BB+Stoch StrategyStrategy using BB and Stoch for entry, trailing for exit.
-------
IDEA
-------
* If price move to reach upper BB and pull back and cross down middle line, and stoch is on OB zone, it will enter short.
* If price move to reach lower BB and pull back and cross up middle line, and stoch is on OS zone, it will enter long.
* Stoch help filter out the bad entry from BB logic, helping with high win trade %
* I smooth out stoch by using 30 length and found out it give better profit%
=============================================
Test Data Detail
=============================================
Exchange : OKEX
Coin : BTCUSD3M
Timeframe : 1H
Date range : 2018/1/1 - 2019/1
For : Trailing with bot ( If you have one :P )
Config
Trade % = 20 ( You can increase trade size of your total port but it will get you into more risky trade. ( but yes, more profit ) ... u can increase trade size if you have enough profit
Trailing Start = 20 ( If you can write bot, it will start trailing when the profit % reach this value )
Trailing Stop = 5 (If you can write bot, it will take profit if the profit drop below this value from trailing start.)
Take Profit = 100 (It will set fixed TP for whipsaw case ( rarely reach this target ) )
Stop % = 50 ( so this trade is RR = 2 nice! )
Leverage = 20 ( so we can withstand the price fluctuation and not get liquidated, if you trade spot, please choose 1 also, please adjust TP and stop accordingly eg. leverage 1 / TP = 20 / SL = 10 )
Trade Direction = Both ( for margin market, if you want to trade spot like Binance you can choose long only )
Stoch Oversold Zone = 30 ( if stoch stay below or equal this value, it is oversold )
Stoch Overbought Zone = 50 ( if stoch stay above or equal this value, it is overbought )
Stoch Length = 30 ( the more length, the more smooth out of Stoch )
SmoothK1 = 1 ( the smoothness of K )

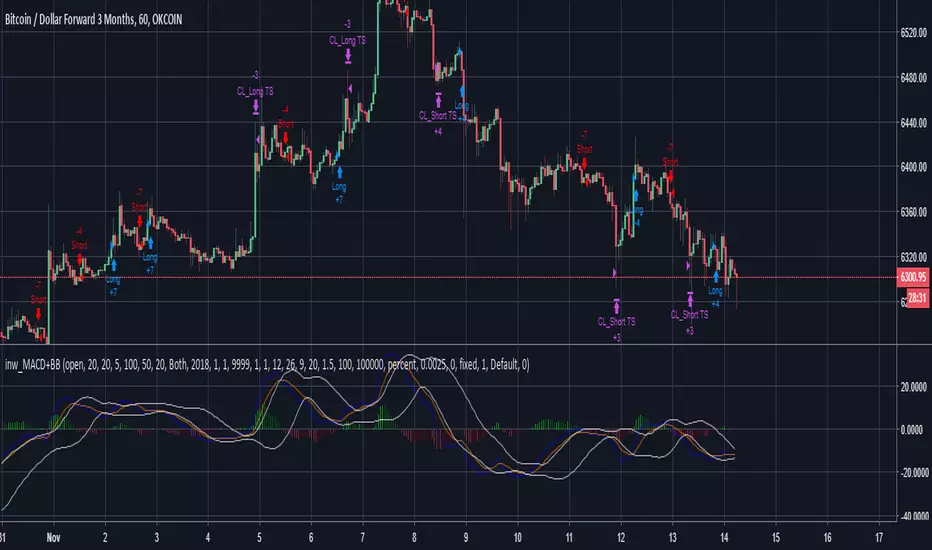
inwCoin MACD + BB Cross StrategySimple yet effective strategy by using MACD and BB the MACD line then cross it for short/long entry.
This strategy using trailing stop to exit position.
Bollinger Strategy(Lirshah)a strategy according to bollinger band indicator
good results on(Time frame: 15 minutes) LTCUSD , BTCUSD, XBTUSD, BCHUSD, ETHUSD

Hullinger Bands StrategyLike Bollinger Bands, but with Hull MA
seems to work on all pairs and timeframes

NinetailsVulpix, but now only closing positions when they meet a take profit/stop loss target, and instead the middle red bars are used to reopen positions when in confluence the MA.
RSI + BOLLINGER, Long-Short v1.3Custom RSI + BOLLINGER settings to capture profits. Switch to bullish or short trades.


Bollinger Bands Strategy LingsbordIndicator made by the idea provided by Lingsbord from the forum Binary Options Edge.
Features Implemented from Original Idea
Trade Sessions 0410-0815 and 0930-1200 (for some reason pinescript works off UTC-4?, London is UTC+1)
Indicator only signals when bar is inside trade sessions.
Background is shaded when Trade session is active.
Indicator Draws Arrows when a bar closes outside of 2.5 bollinger band.
Trade is executed at the opening of the next bar and recorded in the strategy tester.
Modifications to Original Idea
This Strategy has been modified to include his "Anti-Breakout Protection) where it will only place 2 consecutive losing trades in the event of consecutive bar closing outside of the bollingerbands.
www.binaryoptionsedge.com
In the Event of the first trade ending ITM and the next bar closing back inside the Bollinger bands then the next bar going back outside, the script will trigger another trade signal.
Allows for consecutive wins in an uptrend but still limiting to 2 losses as per modification above
Excel Spread sheet tracking profits
$1887.04 from Monday 17-09-2018 to Friday 21-09-2018
i.imgur.com
www.binaryoptionsedge.com
Step 1.
I have an FXCM demo account running Metatrader 4 and a 1 min EURUSD chart open.
This chart has 1 indicator on it, Bollinger Bands with settings 20 and 2.5.
I found that deviation of 2 creates too many false signals and deviation of 3 means you’ll be lucky to see more than 3 trades per day.
I settled on 1 minute for the number of trades it offers during an average day and because the 5 minute offers no better ITM rate.
I also have the Market Watch window open on the metatrader but I reduce the size of the box down so I can only see the EURUSD rate and the clock.
It’s this clock that I use as my “countdown trigger”.
Step 2.
-Redacted- (Affilliate marketing bullshit) -Redacted-
Step 3.
OK as you will have seen elsewhere on the BOE Boards,
the trading strategy is simply to take a trade in the opposite direction when a candle closes outside the Bollinger Bands,
so if it closes out of the top band I enter a Put, and if it closes below the bottom band I enter a Call.
As the Market Watch clock gets into the 50s on the seconds and if a trade appears to be lining up,
I’ll hover over the Put/Call button and closely watch the clock and the chart so I can nail the trade the moment the candle closes.
Expiry is 1 minute.
Trading times
I avoid the period prior to London Open as there’s often a series of trades in the same (wrong) direction as the market gears itself up for the day,
so I’ll normally look for the first trade from 09:10 UK time and I’ll then trade until about 13:15,
picking up again around 14:30 after NYC Open to avoid another rush around that time and to give me a chance to enjoy some lunch without worrying about trading!
For those of you trading Asian markets I’d avoid the “dead zone” and trade from about 02:00 onwards (again, UK time) when there might be enough movement to be able to make sense of this strategy.
Trade sizes
My first trade is $100. If this trade ends ITM I make $82 and look for the next one, again at the starting level of $100
If the first trade ends OTM then my second trade on the next signal is $320. If this trade ends ITM I make $262 which recovers the original $100,
also creates the original $82 of profit that the first trade would have made, and then makes a further $80.
Again your next trade is at the starting level of $100
If the second trade ends OTM then the third trade is $512.
If this trade ends ITM then it recovers the original $100 and the $320 but there’s no profit,
we’ve just recovered the losses and we move on with the next trade at $100
If the third trade ends OTM we REPEAT the $512 trade. If this trade ends ITM we generate $420 towards recovering part of the losses made in the other trades.
These 1-4 trade sequences we call “events”.
Most events will be only 1 or 2 trades,
i.e. you will be making consistent strong returns most of the time.
When an event consists of 3 consecutive trades you will break even on that event and look for the next trade
When an event consists of 4 trades where the 4th one ends ITM you will subsidise your loss on the previous 3.
Some people can’t face the concept of a trade that doesn’t generate profit,
but believe me I’ve run so many examples that this structure works best in terms of risk/reward over time.
When an event consists of 4 trades and the 4th one ends OTM you will take a “hit”.
Based on the above numbers the hit will cost you $1,444 at this level.
When this happens you set the platform back to $100 and start again.


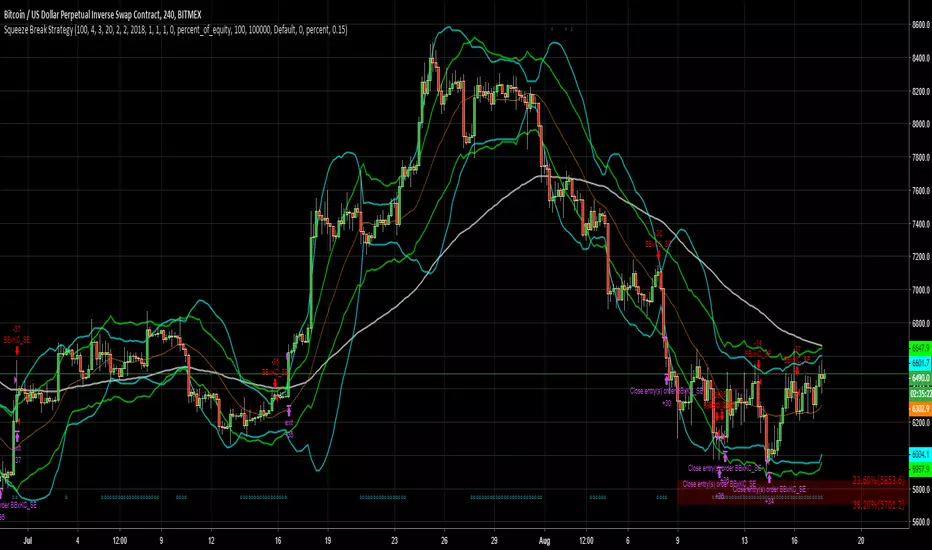
Squeeze Break Strategy [WIP] (Only for shorting XBTUSD at 4H)BITMEX:XBTUSD
For backtesting on Bitmex, open Script properties and set Order Size to 100% of equity and Commission to .15%. Use 4H as it seems to be the most profitable for now.
Also, 4% Short Stop Loss works best for now.
To use, add script to favorites first. Then on your chart, add script from Indicators -> Favorites
Modified Squeeze Break [WIP]For backtesting on Bitmex, open Script properties and set Order Size to 100% of equity and Commission to .15%. Use 4H as it seems to be the most profitable for now.

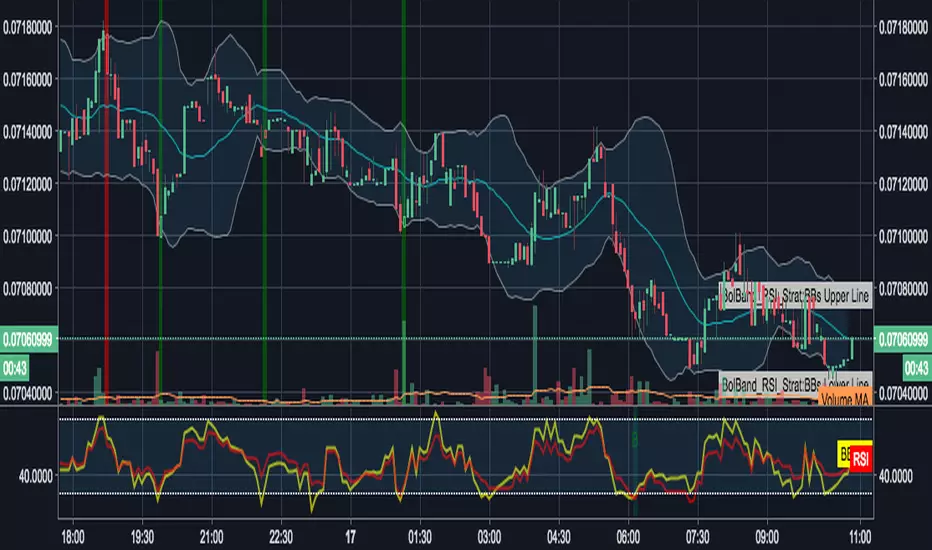
Bollinger Bands + RSI Double Strategy (by SlumdogTrader)
// SlumdogTrader's Bollinger Bands + RSI Double Strategy - Profit Trailer
//
// Version 1.0
// Script by SlumdogTrader on July Fri 13(!), 2018.
//
// This strategy uses a normalise Bollinger Bands + RSI.
//
// Bollinger Band triggers
// SELL - when the price is above the upper band.
// BUY - when the price is below the lower band.
//
// RSI triggers
// SELL - when the price is above 55.
// BUY - when the price is below 45.
//
// This simple strategy only triggers when
// both the BB and the RSI
// indicators, at the same time, are in
// a overbought or oversold condition.
//
// Visit my TradingView work at:
// www.tradingview.com
//
// Visit my website at:
// www.slumdogtrader.com

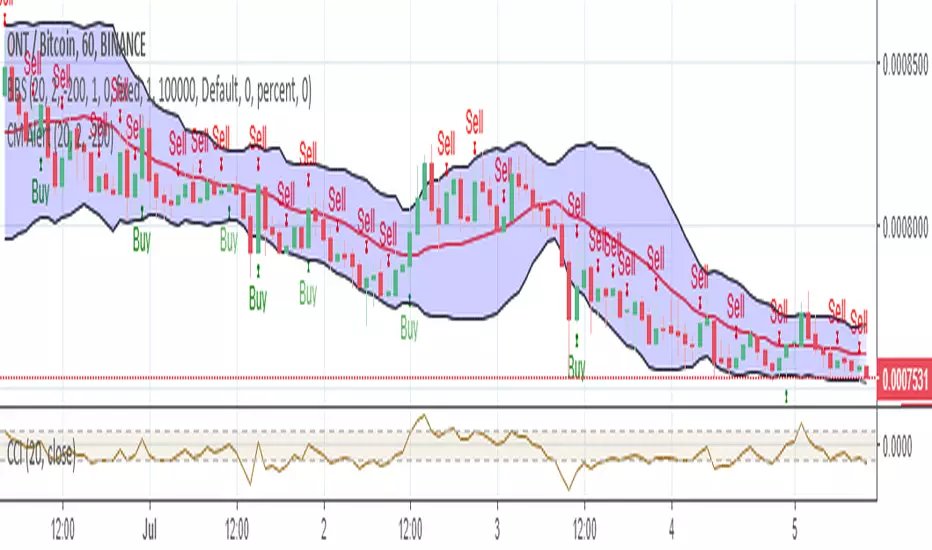
Bollinger Bear SniperThis script uses Bollinger Band but with different interpretation. The upper Bollinger Band is the resistant level, the lower Bollinger Band is the base or support level. The Commodity Channel Index (CCI) and the Bollinger Bandwidth helps us avoid high risk.
The script identifies candles that are marking bold upward moves in prices and fires buy signal. Sales signals are fired when the candle closes in positive. The idea is to buy and sell on the same candle or next positively closed candle. This is anti-bear-anti-bags strategy. You either make profit or loss holding no bag. When you gain more than lose you are in business. This script is set to gain more than lose. We however offer no guarantee, expressed or implied. We are NOT responsible.
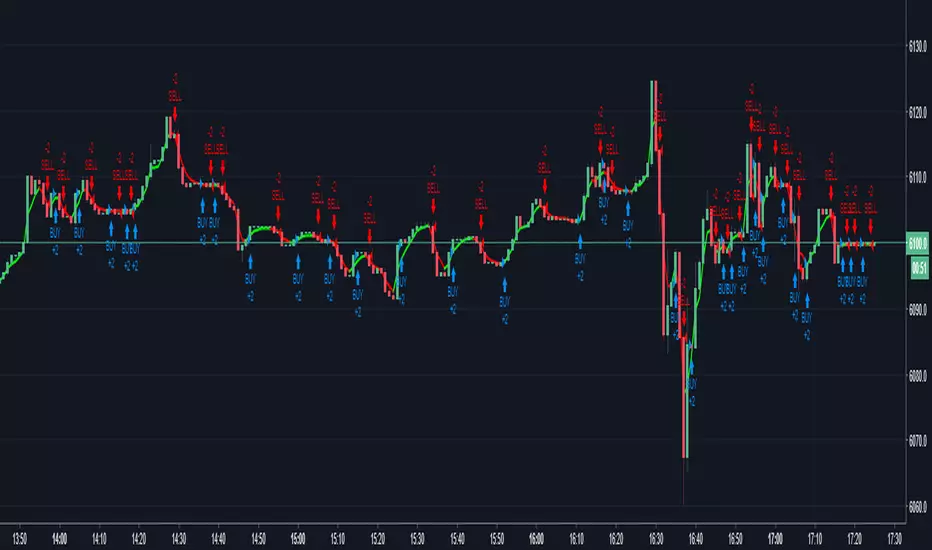
Silver Trading SignalNOTE 1: Only for S
NOTE 2: Only for timeframe : 30 Minute
Gold and Silver both trade the same way, opposite of DXY but silver fluctuations are higher and different from Gold. This script has been optimized for Silver only, not for gold.
How to trade:
Just see the signals for buy and sell on the chart.
Give your feedback after testing this strategy. :)

andrei_SHAB strategySupertrend strategy with Atr modified to the Bollinger Bands and base on the Heikin Ashi candles ... It is not repaint
BB+AO STRATto be used with AO indicator, based on forex strat --
www.forexstrategiesresources.com
works on 1/3/5/15/30 candles, buy signals are best when the black 3 fast ema crosses up through the red mid band
