Classic Long Term Trend Following SystemThis is a classic long term trend following system.
The breakout period is 50 days instead of 20 and the moving average crossover are 40 and 120.
The moving averages are also exponential instead of simple.
The stoploss is 4 ATRs away from the price.
Recommendations:
Donchian Channels settings > 50 days
Moving Averages > 40 and 120, 80 and 140
Important to note:
My first strategy, DC Breakout System | This is simplicity at its finest, is best used on the crypto market and this one for stocks, commodities, currencies, etc. Those markets tend to trend a lot longer than crypto do.
Breakout

Trend Following with Donchian Channels and MACDThis is a trend following system based on the Donchian Channels. Instead of using a simple moving average crossover, this system uses the MACD as the trendfilter:
Long positions:
* Price makes a new 50 day high,
* The MACD-line crosses above or is above the Signal-line.
* Both the MACD and the Signal-lines are above the zero-line.
Short positions:
* Price makes a new 50 day low,
* The MACD-line crosses below or is below the Signal-line.
* Both the MACD and the Signal-lines are below the zero-line.
Stoploss:
The initial and the trailing stoploss are 4 ATRs away from the price.

Fractal Breakout Strategy [KL]Fractal Breakout Strategy
This strategy will enter into a Long position when (a) bullish fractal is formed, combined with (b) ATR is relatively low. Trailing stop loss is set based on ATR.
Bullish fractal pattern :
A bullish fractal pattern looks like this:
It is formed when lower-low has reached a local minimum followed by higher-lows.
By default, this script plots the pivot point (the local minimum) using green crosses. This line will extend to the right until the next bullish fractal is formed. The local minimum pivot point is considered as key level of support. For long position entry, entry price must be higher or equal to it.
On the other hand, a bearish fractal pattern looks like the exact opposite. Reversing the logic, it is a local maximum indicated by higher-highs followed by lower-highs. This is shown by red crosses.
Why use ATR to confirm entry :
Two reasons to enter when ATR is low:
1) Since trailing stop loss is based on ATR, entering the market when ATR is low means risking less for potentially high reward.
2) Low ATR often signals price consolidation. There are two favorable scenarios, either: (i) period of accumulation, or (ii) bull flag, ideally followed by breakout.
Determining whether ATR is low :
Relative lows are quantified out by using the method in my other script: Modified ATR Indicator
The method involves applying two-tailed hypothesis testing to assess whether ATR (ie. by default lookback period of 5) has greatly deviated from a larger sample size (ie. lookback period of 50). Assuming ATR is normally distributed and variance is known, then test statistic (z) can be used to determine whether ATR5 is within the critical area under Null Hypothesis: ATR5 == ATR50. If z falls below/above the left/right critical values (ie. 1.645 for a 90% confidence interval), then ATR is determined to the relatively low/high respectively. For the purpose of assessing whether ATR is low, the left-tail is the main focus.
Profit taking :
Profits by default are taken over 3 levels based on risk to reward ratio (ie. 1R, 2R, 3R). When a target is met at each level, strategy will close out one third of current position size. Remainders (ie. already taken once at 1R, but not yet reaching 2R or 3R) will eventually be closed at the trailing stop loss price.

Bjorgum Key Levels
Key Levels Aims to capture 3 of the most significant points in price action
Breakouts
False Breakouts (Traps)
Back Checks
These 3 points alone, if properly identified, can be some of the most significant points of movement in the price history of an asset and bring significant gains to traders, if capitalized on. Here are a few examples of these setups
Breakouts
Breakouts can bring significant rallies as the market swings one sided after key levels are breached. This entry type can bring large trending runs to follow. Momentum is on your side, but the trade off is a higher entry.
False Breakouts
Also known as a bull trap or a bear trap, false breaks can lead to swift and significant reversals and potential for a large and sudden move to the opposite side. When a key level breakout fails to hold, parties entering to capitalize on the "epic breakout" can get left holding the bag forcing them to exit at a loss, which can double the force of pressure. Traps can bring swift gains from good entry prices. However, price is still in a larger trend against you so momentum is weak, so price action is susceptible to roll over.
Backchecks
Back checks are pull backs in trend that find middle ground to the 2 areas already described. Both momentum and entry price are decent, but risk is defined as a key level has flipped offering entry with stops below demand, or above supply.
Combining these 3 methods helps to diversify risk, understand trend development, and bring steady gains. This script helps to identify these points to traders with analysis of key levels, price structure, and trend direction, while providing visual signals and alerts for when they occur.
Best of luck in your coding and trading and thank you for your support

DC Breakout Strategy | This is simplicity at its finest.As the title already describes: this is a Donchian breakout strategy. This strategy, as of now, only goes long. It goes long when the price close makes a new high and the 8 day moving average is above the 32 day moving average. The strategy exits the trade if the price breaks the atr trailing stop of * 3 or the 8 day moving average crosses below the 32 day moving average.
This is simplicity at its finest.

Pivot Support & ResistanceHere signals are based on the pivot high and pivot lows. Factors taken into account in understanding the breakout or breakdown are:
volume
candle bar is not opening candle
must be near pivot high or low
Recommendation:
Use once candle closes else you might get trapped in certain cases so be careful

Beakdoo swing trading boxHi forks,
I'm trader Baekdoosan who trading Equity from South Korea. This Baekdoo swing trading box indicate good buying position when it crossover the box.
Here's the ideas
1. It needs to crossover 1 month highest value and higher than 5 ema and 20 ema line
2. It also needs to crossover 1 month volume as well
3. Once 1,2 soaring candle emerge, it needs to correction time
4. 5 ema or 20 ema or center candle's 2/3 point x 0.95 (5% lower) would be the resistant line
5. center candle's 2/3 point line would be the buying point (you may can trade when it cross over
you can check above example chart and take a look what you have interested in.
hope this will help your trading on equity as well as crypto. I didn't try it on futures . Best of luck all of you. Gazua~!
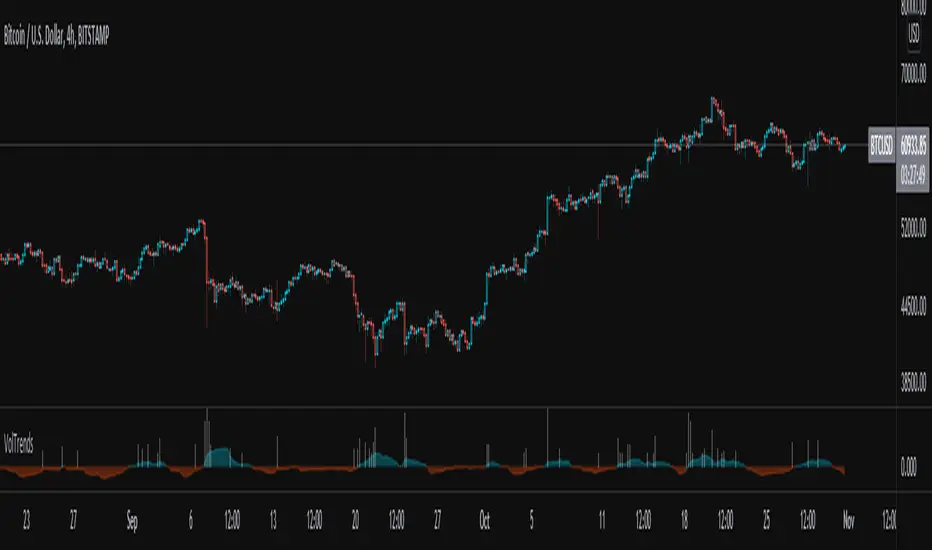
Volume TrendsThis script provides clear volume trends on any time frame. You set a long term volume trend moving average (ex 100 periods). A shorter term MA of your choice (10 in this example) will oscillate above and below based on the standard deviations of its current value relative to the long term #.
Similarly, large volume bars are plotted in terms of st dev above the long term MA.
Very useful in spotting capitulation bottoms and/or blow-off tops.
Fibonaci Opening Range Candle
Fibonacci Opening Range it is 50% and 0.61% of 5 min or 30min or 1 hour opening candle
search buying opportunities below 0.61
and selling opportunities above 0.50
Also acts as good support and resistance in intraday
BEST RESULTS IN INDEXES
Thanks & Best Regards
Marella Ganesh

Volume Breakout (ValueRay)Easy visuals on, if volume is way over average. Good for Mean Reverting. Higher Volume tends to higher breakout chances.
Please whisper me for for ideas how to make this better. Its a very simple script, but got some alpha. If you know how to improve, let me know and i will code it into.

Kaufman's Efficiency Ratio Strategy [KL]I recently published an indicator called "Kaufman's Efficiency Ratio Indicator". In the description of that script, I hypothesized about how the Efficiency Ratio could be applied to identify bullish moves in instances where price had already gone up steeply, but rests for a while, allowing for entry in expectation that price will continually rise. I decided to test out this idea with Pinescript.
About Kaufman's Efficiency Ratio ("ER")
ER was developed by a systematic trader by the name of Perry J. Kaufman.
Formula
The formula is:
= A divided by B,
where:
A = Current closing price minus the closing price at the start of the lookback period
B = Sum of differences between closing prices (in absolute terms) of consecutive bars over the lookback period
How this strategy enters a trade (Long):
- code: entry_signal_long = ER > 0 and ER_is_mid
- meaning: when ER is positive, strategy assumes price has risen. Usually ER value begins high (red), and unless it is a false move, then it should stay positive. This strategy will patiently wait until ER drops to medium (yellow), and then place a trade.
- how low/medium/high is dynamically determined: Refer to the description of my other script("Kaufman's Efficiency Ratio Indicator") for details. Trying to keep this as short as possible.
How this strategy exits a trade (Long):
- when price hits stop limit; stop limit is based on low of bars, trails upward based on ATR
- included a feature called "tightening TSL", which tries to reduce the stop-buffer during periods of high volatility implied by ER (very experimental, opening the floor for suggestions on how this can be improved)

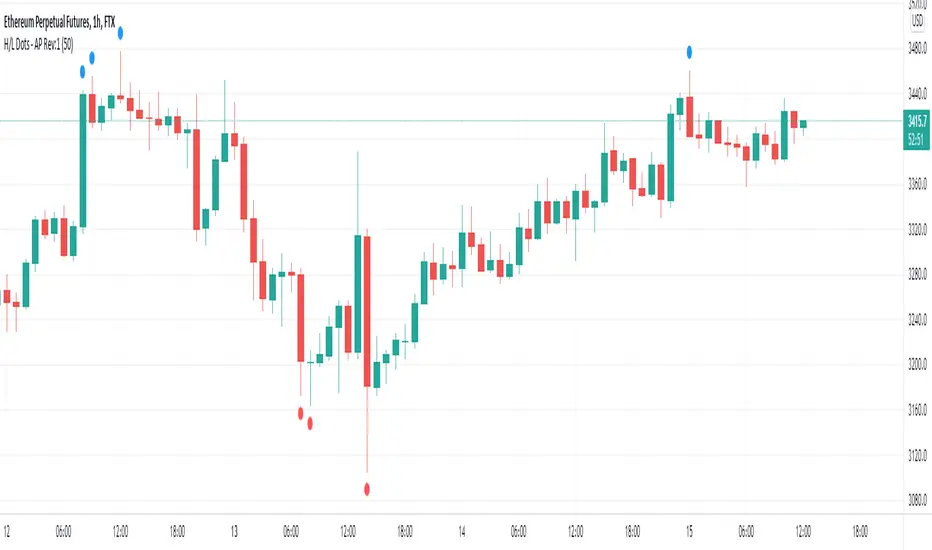
Recent High/Low Dots by Alejandro PSimple indicator that plots a dot in the chart when a candle breaks the high of the past X candles.
This is useful to easily visualize when the market is coming out of a range and making fresh highs or lows relative to the past X candles.
It can be used in trend following systems as an additional filter for validation.
Roc Mean Reversion (ValueRay)This Indicator shows the Absolute Rate of Change in correlation to its Moving Average.
Values over 3 (gray dotted line) can savely be considered as a breakout; values over 4.5 got a high mean-reverting chance (red dotted line).
This Indicator can be used in all timeframes, however, i recommend to use it <30m, when you want search for meaningful Mean-Reverting Signals.
Please like, share and subscribe. With your love, im encouraged to write and publish more Indicators.

[KL] Double Bollinger Bands Strategy (for Crypto/FOREX)This strategy uses a setup consisting of two Bollinger Bands based on the 20 period 20-SMA +/-
(a) upper/lower bands of two standard deviations apart, and
(b) upper/lower bands of one standard deviation apart.
We consider price at +/- one standard deviation apart from 20-SMA as the "Neutral Zone".
If price closes above Neutral Zone after a period of consolidation, then it's an opportunity for entry. Strategy will long, anticipating for breakout.
The illustration below shows price closing above the Neutral Zone after a period of consolidation.
a.c-dn.net
Position is exited when prices closes at Neutral Zone (being lower than prior bars)

Three Week Tight Pattern IndicatorThree Week Tight Pattern is a consolidation indicator which give extra buy point on strong fundamental stocks. You can read about it from IBD here: www.investors.com

Pivot Points And Breakout Price Action With LuckyNickVaBar Color Candle Aligned with pivot points swing high and swing lows For Those Who Are Familiar with Trading The Breakouts Of Highs & Lows Of Structure. Pivots are said to be key areas in the market where price shows heavy reaction to where reversals make occur. At these points there are swing Highs & swing lows that traders may be able to find opportunity in the market. This Script is a combination of pivot points and Barcolor signals for the breakout.

Boom Hunter ProBoom Hunter Pro is the ultimate indicator for targeting perfect long entries and epic shorts. Boom Hunter comes with a super fast oscillator that uses Ehlers Early Onset Trend (EOT). This is the Center Of Gravity Oscillator (COG) with a super smoothing filter and a roofing filter. This indicator is tuned for 1 hour charts but can be used on any time frame.
Colored bars can be turned on to assist in finding an entry. Purple signifies a drag and potential dump.
Fibonacci lines can be turned on to track price action and find entries/exit.
This indicator follows the same rules as COG. For more information please see my COG HOWTO here:

Linear Regression & RSI Multi-Function Screener with Table-LabelHi fellow traders..
Happy to share a Linear Regression & RSI Multi-Function Custom Screener with Table-Labels...
The Screener scans for Linear Regression 2-SD Breakouts and RSI OB/OS levels for the coded tickers and gives Summary alerts
Uses Tables (dynamica resizing) for the scanner output instead of standard labels!
This Screener cum indicator collection has two distinct objectives..
1. Attempt re-entry into trending trades.
2. Attempt Counter trend trades using linear regression , RSI and Zigzag.
Briefly about the Screener functions..
a. It uses TABLES as Labels a FIRST for any Screener on TV.
b. Tables dynamically resize based on criteria..
c. Alerts for breakouts of the UPPER and the LOWER regression channels.(2 SD)
d. In addition to LinReg it also Screens RSI for OB/OS levels so a multifunction Screener.
e. Of course has the standard summary Alerts and programmable format for Custom functions.
f. Uses only the inbuilt Auto Fib and Lin Reg code for the screener.(No proprietary stuff)
g. The auto Zigzag code is derived(Auto fib).
Question what are all these doing in a single screener ??
ZigZag is very useful in determining Trend Up or Down from one Pivot to another.
So Once you have a firm view of the Current Trend for your chosen timeframe and ticker…
We can consider few possible trading scenarios..
a. Re-entry in an Up Trend - Combination of OS Rsi And a Lower Channel breach followed by a re-entry back into the regression channel CAN be used as an effective re-entry.
b. Similarily one can join a Down Trend on OB Rsi and Upper Channel line breach followed by re-entry into the regression channel.
If ZigZag signals a range-bound market, bound within channel lines then the Upper breakout can be used to Sell and vice-versa!
In short many possibilities for using these functions together with Scanner and Alerts.
This facilitates timely PROFITABLE Trending and Counter trend opportunities across multiple tickers.
You must give a thorough READ to the various available tutorials on ZigZag / Regression and Fib retracements before attempting counter trend trades using these tools!!
A small TIP – Markets are sideways or consolidating 70% of the time!!
Acknowledgements: - Thanks a lot DGTRD for the Auto ZigZag code and also for the eagerness to help wherever possible..Respect!!
Disclaimer: The Alerts and Screener are just few tools among many and not any kind of Buy/Sell recommendations. Unless you have sufficient trading experience please consult a Financial advisor before investing real money.
*The alerts are set for crossovers however for viewing tickers trading above or below the channel use code in line 343 and 344 after setting up the Alerts!
** RSI alerts are disabled by default to avoid clutter, but if needed one can activate code lines 441,442,444 and 445
Wish you all, Happy Profitable Trading!

Ichimoku all signalsIchimoku Cloud All Signals!
This indicator shows all Ichimoku Cloud signals for (entering/exiting/confirming/or even staying) in a position.
you can choose a signal related to your strategy and use it.
you can choose which signals to be shown on the chart by changing the settings.
here are some examples of signals that you can get from this indicator:
Crossover/under conversion line & base line
Crossover/under lead line1 & lead line2
Crossover/under conversion line & lead line1
Crossover/under base line & lead line1
Crossover/under conversion line & lead line2
Crossover/under base line & lead line2
Crossover/under close & base line
Cloud Breakouts in both directions!
and 74 signals more !!!!

Volume Level with AlertThis script is made by Bollinger Bands and Volume , BB is using customize setting to filter the surge volume.
Good to use in Cryptocurrency
When Volume Breakout and price is drop, chance to collect at lower price
Try to find out Price * Volume Divergence , a best entry point with low risk

Ichimoku breakoutIf you use Ichimoku Cloud strategies, this indicator is very useful for you!
This code indicates the candles that break the ichimoku cloud in both directions!
conversion line, base line and lagging span are disable by default, you can enable it from settings window.
green triangles under the candles with green backgrounds show break out the red clouds.
red triangles at the top of the candles with red backgrounds show break out the red clouds.
you can set alerts to be notified when an Ichimoku Cloud is broken.

Breakout FinderHelo All,
I got many requests for a Breakout script and here it's. This script searches the breakouts/breakdowns and draw square if there is one.
The options:
"Period" is used to find Pivot Points
"Max Breakout Length" is the maximum length to search breakouts
"Threshold Rate %" is channel width of the breakout area. calculated using highest/lowest of last 300 bars.
"Minimum Number of Tests" is the minimum number of tests that the Price tried to break the S/R level
and some options for coloring and linestyle
Lets see some examples:
in this example "Minimum Number of Tests" is 2 so the Price must have tested to break resistance area 2 times and then it breaks it as seen in the screenshot:
in following example Threshold rate is %10, so the channel width is very big:
as you can see in followinf screenshot you can choose different colors and line styles:
Alerts added ;)
Enjoy!

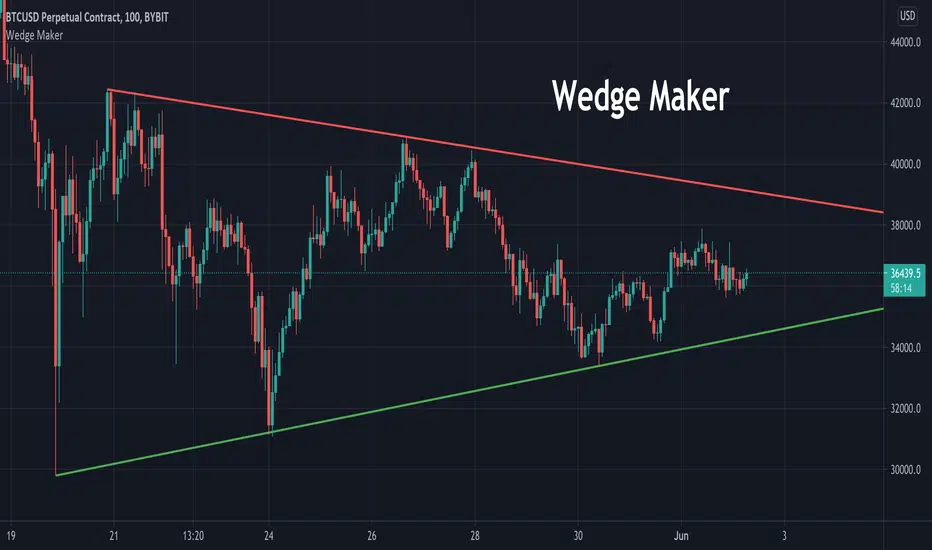
Wedge MakerThis tool is used to draw wedges. Traders can choose which pivot points to draw lines from in settings. Wedge Maker does not automatically detect current wedge and is required to be tweaked in settings.