Breakout ScannerThis is a Breakout Scanner that shows you the immediate trend across 4 higher timeframes for up to 10 different tickers. It calculates a score from 1 to 3 for bullish and -1 to -3 for bearish based on where price is currently at compared to the previous higher timeframe’s candle levels.
When price is breaking out of the previous higher timeframe candle’s range, then it will have a score of 3 for bullish breakout or -3 for bearish breakout. When price is above the high or below the low of multiple different higher timeframe candles, you can expect price to continue the breakout and move to a new area of price range.
The brighter red or green the color is, the stronger the trend is on that timeframe. When it shows a bright green or red box on the far right side of a ticker, it is notifying you that the ticker is bullish or bearish on all timeframes and trending strongly, so switch over to that chart and look to trade in the direction of that trend.
The tickers, colors and time frames can be customized to suit your preference and you can also turn off as many tickers or time frames as you’d like if you want less tickers or time frames to show up on the indicator. It also includes alerts for when all timeframes are bullish or all timeframes are bearish for one ticker.
Make sure to keep each timeframe set to a timeframe that is higher than your chart timeframe.
Bullish Scoring & Colors
If the current candle close is above the midline of the higher time frame candle, it is given a score of 1 and a dark green background. If the current candle close is above the higher timeframe candle body, then it is given a score of 2 and a medium green background. If the current candle close is above the high of the higher time frame candle, it is given a score of 3 and a bright green background.
The higher the score the stronger the bullish trend and the brighter green the color will be.
Bearish Scoring & Colors
If the current candle close is below the midline of the higher timeframe candle, it is given a score of -1 and a dark red background. If the current candle close is below the higher timeframe candle body, then it is given a score of -2 and a medium red background. If the current candle close is below the low of the higher timeframe candle, it is given a score of -3 and a bright red background.
The lower the score, the stronger the bearish trend and the brighter red the color will be.
Total Score Display
On the right side of the indicator table, there is a column that displays the total score by adding all the scores together so you can easily tell the overall strength of the trend across all timeframes. Wait for the trend score to be at least 75% of the possible score to trade so you can ensure you are only trading very strong trends and increase your probability of winning your trade. The total score will update according to how many time frames you have enabled in the settings. You can also turn on or off the total score count if you prefer. The default setting is off.
All Timeframe Trends Agree
When all of the timeframes that you have turned on are in the same direction at the same time, a green or red box will appear on the far right side of the scanner. This is a visual cue that lets you know the strongest trending markets without having to read any of the numbers. Make sure to check out the charts for the markets that have a green or red box on the far right side and look for potential trend trading opportunities.
Alerts
You can set alerts for when all time frames for a certain ticker are bullish or bearish. If you have some time frames turned off at the time of creating your alerts, then it will only require all time frames that are on to be all bullish or bearish to generate an alert. Make sure to set your alerts to once per bar close to ensure you don’t get premature alerts that aren’t yet valid.
Best Way To Use The Scanner
For best results, make sure you wait for the trend to show all bullish or all bearish at the same time and then look to trade in the direction of the strong trend. If you can be patient enough to do that, you will increase the probability of winning your trade because you are trading with the direction of the overall higher timeframe trend when the market is trending strongly and making new highs or lows.
When one of the markets in the scanner shows all timeframes trending, go to that chart and see how price action is reacting to the previous higher timeframe candle levels. You can see those levels easily by adding our Higher Timeframe Candle Levels indicator to your chart and using the same timeframes as your Breakout Scanner is using.
If price is holding the higher timeframe candle levels well, then look to place trades in the direction of the trend that the Breakout Scanner is showing.
Other Indicators To Pair This With
Use this in combination with our Higher Timeframe Candle Levels indicator so you can see all of these levels being used to calculate the trend strength scores and watch how price reacts to those levels. You should also use our Trend Strength Indicator to easily read the historical trends of price compared to the higher timeframes and use those trends to guide you on when to trade and which direction to trade.
Trend Strength Indicator, Higher Timeframe Candle Levels and the Breakout Scanner all use the same levels to calculate the trend scores so they are designed to work all together to help you quickly be able to read a chart and find what direction to trade in.
Bullishbreakout

FuTech : MACD Crossovers Advanced Alert Lines=============================================================
Indicator : FuTech: MACD Crossovers Advanced Alert Lines
Overview:
The "FuTech: MACD Crossovers Advanced Alert Lines" indicator is designed to assist traders in identifying key technical patterns using the :-
1. MACD (Moving Average Convergence Divergence) and
2. Golden/Death Crossovers
By visualizing these indicators directly on the chart with advanced lines, it helps traders make more informed decisions on when to enter or exit trades.
=============================================================
Key Features of "FuTech: MACD Crossovers Advanced Alert Lines":
1. MACD Crossovers:
a) The MACD is one of the most widely used indicators for identifying momentum shifts and potential buy/sell signals. This indicator plots vertical lines on the chart whenever the MACD line crosses the signal line.
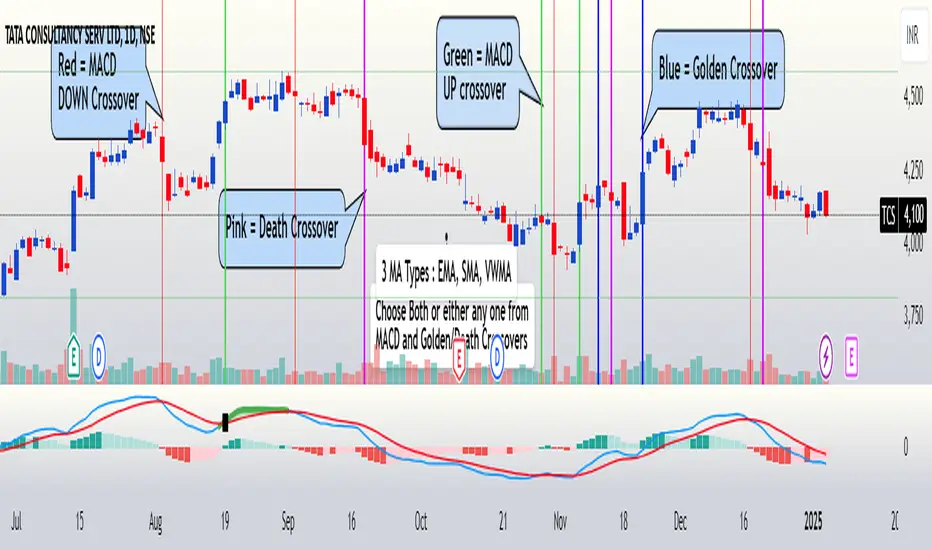
b) Upward Crossover (Bullish Signal) : When the MACD line crosses above the signal line, a green vertical line will appear, indicating a potential buying opportunity.
c) Downward Crossover (Bearish Signal) : When the MACD line crosses below the signal line, a red vertical line will appear, signaling a potential selling opportunity.
2. Golden Cross & Death Cross:
a) The Golden Cross occurs when the price moves above a long-term moving average (like the 50-day moving average), signaling a potential upward trend.
b) The Death Cross occurs when the price moves below a long-term moving average, signaling a potential downward trend.
c) These crossovers are displayed with customizable lines on the chart to easily spot when the market is shifting direction.
d) Golden Cross (Bullish Signal) : A blue vertical line appears when the price crosses above the selected long-term moving average.
e) Death Cross (Bearish Signal) : A purple vertical line appears when the price crosses below the selected long-term moving average.
=============================================================
Customization Options:
This indicator offers several customization options to suit your trading preferences:
1) MACD Settings:
a) Choose between different moving average types (EMA, SMA, or VWMA) for calculating the MACD.
b) Adjust the lengths of the fast, slow, and signal MACD periods.
c) Control the width and color of the vertical lines drawn on the chart for both up and down crossovers.
2) Golden Cross / Death Cross Settings:
a) Select the moving average type for the Golden Cross / Death Cross (EMA, SMA, or VWMA).
b) Define the lookback period for calculating the Golden Cross / Death Cross.
c) Customize the appearance of the Golden and Death Cross lines, including their width and color.
You can use both as well as either of the MACD lines or Golden Crossover / Death Crossover Lines respectively as per your trading strategies
=============================================================
How "FuTech: MACD Crossovers Advanced Alert Lines" indicator Works:
a) The indicator monitors the price and calculates the MACD and Golden/Death Crosses.
b) When the MACD line crosses above or below the signal line, or when the price crosses above or below the long-term moving average, it plots a vertical line on the chart.
c) These lines help traders quickly spot potential turning points in the market, providing clear signals to act upon.
=============================================================
Use Case:
a) Swing Traders: The indicator is useful for spotting momentum shifts and trend reversals, helping you time entries and exits for short- to medium-term trades.
b) Long-Term Traders: The Golden and Death Cross signals help identify major trend changes, giving insights into potential market shifts.
=============================================================
Why Use This "FuTech: MACD Crossovers Advanced Alert Lines" Indicator ?
a) Clear Visuals : The vertical lines provide clear and easy-to-spot signals for MACD crossovers and Golden/Death Crosses.
b) Customizable : Adjust settings for your personal trading strategy, whether you're focusing on short-term momentum or long-term trend shifts.
c) Supports Decision Making : With its advanced line plotting and customizable features, this indicator helps you make quicker and more informed trading decisions.
=============================================================
How to Use:
a) MACD Crossovers: Look for green lines to signal potential buying opportunities (when the MACD line crosses above the signal line) and red lines for selling opportunities (when the MACD line crosses below the signal line).
b) Golden Cross / Death Cross: Use the blue lines to confirm when a positive trend may begin (Golden Cross) and purple lines to warn when a negative trend may start (Death Cross).
=============================================================
Conclusion:
"FuTech: MACD Crossovers Advanced Alert Lines" indicator combines two powerful technical analysis tools, the MACD and Golden/Death Crosses, to provide clear, actionable signals on your chart.
By customizing the appearance of these signals and combining them with your trading strategy, you can enhance your decision-making process and improve your trading outcomes.
=============================================================
Thank you !
Jai Swaminarayan Dasna Das !
He Hari ! Bas Ek Tu Raji Tha !
=============================================================