specific breakout FiFTOStrategy Description: 10:14 Breakout Only
Overview This is a time-based intraday trading strategy designed to capture momentum bursts that occur specifically after the 10:14 AM candle closes. It operates on the logic that if price breaks the high of this specific candle within a short window, a trend continuation is likely.
Core Logic & Rules
The Setup Candle (10:14 AM)
The strategy waits specifically for the minute candle at 10:14 to complete.
Once this candle closes, the strategy records its High price.
Defining the Entry Level
It calculates a trigger price by taking the 10:14 High and adding a user-defined Buffer (e.g., +1 point).
Formula: Entry Level = 10:14 High + Buffer
The "Active Window" (Expiry)
The trade setup does not remain open all day. It has a strict time limit.
By default, the setup is valid from 10:15 to 10:20.
If the price does not break the Entry Level by the expiry time (default 10:20), the setup is cancelled and no trade is taken for the day.
Entry Trigger
If a candle closes above the Entry Level while the window is open, a Long (Buy) position is opened immediately.
Exits (Risk Management)
Stop Loss: A fixed number of points below the entry price.
Target: A fixed number of points above the entry price.
Visual & Automation Features
Visual Boxes: Upon entry, the strategy draws a "Long Position" style visual on the chart. A green box highlights the profit zone, and a red box highlights the loss zone. These boxes extend automatically until the trade closes.
JSON Alerts: The strategy is pre-configured to send data-rich alerts for automation (e.g., Telegram bots).
Entry Alert: Includes Symbol, Entry Price, SL, and TP.
Exit Alerts: Specific messages for "Target Hit" or "SL Hit".
Summary of User Inputs
Entry Buffer: Extra points added to the high to filter false breaks.
Fixed Stop Loss: Risk per trade in points.
Fixed Target: Reward per trade in points.
Expiry Minute: The minute (10:xx) at which the setup becomes invalid if not triggered.
Các mẫu biểu đồ

KNNstrategyKNN is an advanced gold-trading strategy built on a set of refined, confidential patterns extracted from thousands of recurring price behaviors. It identifies hidden reversal and breakout zones using a unique candle-movement signature optimized for fast timeframes. The strategy filters market noise and reveals high-precision entry points overlooked by traditional methods. KNN delivers a powerful edge in the highly volatile gold market through unmatched pattern accuracy and smart validation logic.

EdgeX by YCGH Capital╔════════════════════════════════════════════════════════════╗
⚡ SYSTEMATIC BTCUSDT SWING TRADER ⚡
╚════════════════════════════════════════════════════════════╝
━━━━━━━━━━━━━━━━━━━━━━━━━━━━━━━━━━━━━━━━━━━━━━━━━━━━━━━━━━
📊 STRATEGY OVERVIEW
╔════════════════════════════════════════════════════════════╗
║ 🔐 PREMIUM STRATEGY - EXCLUSIVE ACCESS 🔐 ║
╚════════════════════════════════════════════════════════════╝
This is a premium strategy with exclusive access.
To request access, reach out at:
📬 brijamohanjha@gmail.com
• Vetted performance data available upon request
• Setup assistance and strategy tuning included
• Ongoing support for live trading optimization
━━━━━━━━━━━━━━━━━━━━━━━━━━━━━━━━━━━━━━━━━━━━━━━━━━━━━━━━━━
A dynamic, rule-based trading framework designed for BTCUSDT on
the 4-hour chart, focused on capturing clear directional edges
with disciplined risk management and fully automated execution.
━━━━━━━━━━━━━━━━━━━━━━━━━━━━━━━━━━━━━━━━━━━━━━━━━━━━━━━━━━
🎯 KEY CHARACTERISTICS
━━━━━━━━━━━━━━━━━━━━━━━━━━━━━━━━━━━━━━━━━━━━━━━━━━━━━━━━━━
✓ Long & Short | Bidirectional participation in both trending
directions without discretionary overrides
✓ Structured Rules | Entries triggered only on high-conviction
setups; naturally quiet during choppy consolidations
✓ Adaptive Sizing | Position size scales dynamically with account
equity using percentage-based capital allocation
✓ Cost-Aware | Transaction fees and slippage explicitly modeled
for realistic live trading performance
✓ Automated Execution | Bar-level real-time processing ensures
consistent, emotion-free trade management
━━━━━━━━━━━━━━━━━━━━━━━━━━━━━━━━━━━━━━━━━━━━━━━━━━━━━━━━━━
💰 RISK & CAPITAL MANAGEMENT
━━━━━━━━━━━━━━━━━━━━━━━━━━━━━━━━━━━━━━━━━━━━━━━━━━━━━━━━━━
• Fixed-fraction position sizing for compounding growth
• Predefined stop-loss and take-profit constraints
• Account equity-based position scaling
• Realistic fee structure incorporated into P&L
━━━━━━━━━━━━━━━━━━━━━━━━━━━━━━━━━━━━━━━━━━━━━━━━━━━━━━━━━━
🚀 IDEAL FOR
━━━━━━━━━━━━━━━━━━━━━━━━━━━━━━━━━━━━━━━━━━━━━━━━━━━━━━━━━━
→ Medium-term swing participation
→ Backtesting and strategy robustness analysis
→ Quantitative trading systems development
→ Systematic, rules-based execution
╔════════════════════════════════════════════════════════════╗
Built for disciplined, consistent execution
╚════════════════════════════════════════════════════════════╝

Crypto Intraday Strategy by SAIFOverview
A comprehensive intraday trading strategy designed for cryptocurrency markets, combining multiple technical indicators and risk management principles to identify high-probability trading opportunities.
Key Features
Multi-Timeframe Analysis
Utilizes exponential moving averages for trend identification
Incorporates swing structure analysis for support and resistance levels
Applies momentum and trend strength filters
Risk Management
Configurable risk-reward ratios (default 1.6:1)
Maximum risk per trade capped at 3.1% of equity
Dynamic stop-loss placement based on market structure
Position sizing at 2% of equity per trade
Advanced Filters
Trend strength confirmation using ADX indicator
Momentum validation through multiple oscillators
Market correlation analysis for additional confluence
Optional weekend trading filter to avoid low-liquidity periods
Swing Structure Recognition
Automatically identifies key swing highs and lows
Uses pivot points to determine optimal entry zones
Prevents entries too far from established support/resistance
Trade Execution
The strategy employs a one-way trading approach, entering positions only when multiple technical conditions align. Each trade includes pre-defined stop-loss and take-profit levels calculated at entry.
Customization Options
Adjustable swing detection sensitivity
Configurable EMA distance thresholds
Optional correlation filters
Weekend trading toggle
Risk parameters can be modified to suit individual preferences
Important Disclaimers
⚠️ Educational Purpose Only: This strategy is provided for educational and informational purposes. Past performance does not guarantee future results.
⚠️ Risk Warning: Trading cryptocurrencies carries substantial risk of loss. Only trade with capital you can afford to lose.
⚠️ Not Financial Advice: This tool does not constitute financial, investment, or trading advice. Always conduct your own research and consult with qualified financial professionals.
⚠️ Backtesting Limitations: Historical backtesting results may not reflect actual trading conditions due to slippage, execution delays, and changing market dynamics.
Fees & Slippage
Commission: 0.12% per trade
Slippage: 2 ticks accounted for in backtesting
Recommended Usage
Thoroughly backtest on your preferred trading pairs
Start with small position sizes when live trading
Monitor performance across different market conditions
Adjust parameters based on asset volatility and your risk tolerance

Indian Scalper 2025 – PSAR + SMA50 + RSI≤50 + High Volume (75%)Best 1-min / 2-min scalping strategy for NIFTY, BANKNIFTY, FINNIFTY & liquid stocks in 2025
✓ PSAR flip + SMA-50 trend filter
✓ RSI ≤50 (avoids chasing)
✓ Only high-volume candles (bright colour)
✓ Loud mobile alerts with price & SL
✓ 1:2+ RR with PSAR trailing
Works like magic 9:15–11:30 AM and 2–3:20 PM
Made with love for the Indian trading community ♥

1-Hour Trend Breakout Strategy (Scaled Entry Version)This strategy is a trend-following system on the Bitcoin 1-hour chart.
It enters in the direction of the market when price breaks an upward or downward trendline, using scaled (partial) entries.
Entry Rules
Go long when price breaks an upward trendline.
Go short when price breaks a downward trendline.
Position size is split into several parts and entered gradually.
Trade Management
When the first take-profit level (TP1) is reached, a portion of the position is closed.
The stop-loss on the remaining position is moved to break-even (entry price) to lock in profits and manage risk.
Performance
Period: 2019-12-16 to 2025-12-07
Total P&L: +2,385%
Maximum Drawdown (MDD): 28%
Win Rate: 79%
Profit Factor: 3.1

RevertX by YCGH CapitalRevertX by YCGH Capital - Professional Bitcoin Trading Strategy
RevertX is a sophisticated mean-reversion trading system designed specifically for Bitcoin and cryptocurrency markets. Built on advanced statistical analysis, this strategy identifies extreme price deviations and capitalizes on market equilibrium forces.
Key Features:
🎯 Intelligent Entry System
Precision-based signal generation using statistical price analysis
Automated entry/exit execution with no manual intervention required
Works on multiple timeframes for flexibility
📊 Comprehensive Performance Tracking
Monthly Returns Table: Visual heat-map style table displaying performance month-by-month and year-by-year
Color-coded results (green for profitable months, red for losses)
Annual performance summaries for quick assessment
Full historical performance visualization
🛡️ Advanced Risk Management
Customizable Stop Loss (default 2%)
Take Profit targets (default 4%)
Trailing Stop Loss with activation threshold - locks in profits as the market moves in your favor
Adjustable trailing offset to protect gains while allowing room for continuation
⚙️ Professional-Grade Execution
Non-repainting signals - what you see in backtest is what you get in live trading
Orders processed on candle close for reliable execution
100% equity deployment for maximum capital efficiency
Built-in slippage and commission modeling (can be adjusted)
📈 Performance Visualization
Monthly returns displayed in an easy-to-read table format
Track your performance across years at a glance
Quickly identify strong and weak periods
Professional presentation suitable for sharing with investors
Perfect For:
Bitcoin traders seeking systematic, emotion-free trading
Those who prefer mean-reversion over trend-following
Traders wanting comprehensive performance analytics
Anyone seeking a proven statistical edge in crypto markets
RevertX removes emotion from trading decisions and provides complete transparency through detailed performance metrics. The strategy is fully backtested and ready for live deployment.
Ready to Trade Like a Pro?
RevertX is a premium strategy with limited availability.
Email brijamohanjha@gmail.com to request access and pricing.


The Flody SniperA trend-following sniper strategy that uses two EMAs (21/55) and RSI to confirm momentum.
It enters long when price crosses above the fast EMA during an uptrend and RSI shows strength.
It enters short when price crosses below the fast EMA during a downtrend and RSI shows weakness.
Pyramiding is enabled so the strategy can add more positions as the trend continues.
Positions close when momentum weakens or price breaks back through the fast EMA.

ACD STRATEGYACD Opening Range Strategy based off of the strategy of Mark Fischer. It trades off the MGC opening range of all 3 sessions (LDN, ASN, NY)

YCGH Ultimate Stocks Breakout Sniper📈 YCGH Ultimate Stocks Breakout Sniper
Overview
A sophisticated momentum-based breakout strategy designed to capture high-probability directional moves during volatility expansion phases. This system identifies breakout opportunities when price decisively breaks through established ranges, combining multiple technical filters to enhance signal quality and minimize false breakouts.
🎯 Strategy Features
Core Methodology:
Proprietary breakout detection algorithm
Multi-layered confirmation filters for signal validation
Adaptive trailing stops for profit protection
Systematic risk management with daily drawdown controls
Key Components:
✅ Volatility Expansion Filter - Only trades during periods of elevated market volatility to avoid choppy, range-bound conditions
✅ Optional Trend Alignment - Configurable trend filter (EMA/SMA/RMA/WMA) to align entries with broader market direction
✅ ROC Momentum Filter - Daily rate-of-change filter to capture strong momentum days (optional)
✅ Comprehensive Exit Strategy:
Fixed stop-loss (default 2%)
Take-profit targets (default 9%)
Dynamic trailing stops (2% activation, 0.5% offset)
✅ Flexible Direction Trading:
Auto-detect mode: Long+Short for perpetuals, Long-only for spot/equities
Manual override options available
Suitable for both crypto and stock markets
📊 Market Applicability
Optimized for: Cryptocurrency perpetual contracts and equity markets (1H-4H timeframes)
Also effective on: Futures and high-liquidity spot markets
The strategy adapts to different market regimes through configurable volatility and trend filters, making it versatile across various trading instruments and timeframes.
⚙️ Risk Management
Position Sizing: Percentage-based allocation with leverage support
Intraday Loss Limit: Maximum 10% drawdown protection (configurable)
Realistic Cost Modeling: 0.025% commission + 1 tick slippage
No Pyramiding: Single position management for controlled risk exposure
📈 Performance Visualization
Includes a comprehensive monthly returns table displaying:
Year-by-year performance breakdown
Monthly profit/loss percentages
Visual color-coding (green for profits, red for losses)
Clean, modern design with transparent styling
🔐 Access & Pricing
This is a PROTECTED, invite-only strategy.
The source code is not open-source and requires paid access for usage.
How to Get Access:
📧 Email: brijamohanjha@gmail.com
Include in your email:
Your TradingView username
Markets/assets you plan to trade
Preferred timeframe
What You'll Receive:
Full strategy access with invite-only permissions
Complete parameter documentation
Setup and optimization guidance
Implementation support
⚠️ Important Disclosures
Backtesting Parameters:
Commission: 0.025% per trade
Slippage: 1 tick
Results reflect realistic trading conditions
Risk Warning:
Past performance does not guarantee future results. This strategy involves substantial risk and may not be suitable for all investors. Users should thoroughly understand the risks and customize parameters based on their risk tolerance and market conditions.
📞 Contact for Access
Email: brijamohanjha@gmail.com
For questions about functionality, pricing, optimization, or market-specific settings, please reach out via email.
Note: This is a premium, paid strategy. Access is granted manually after consultation and payment confirmation.

Center and Volume AnalyzerCenter and Volume Analyzer that utilizes the chart's Center of Gravity alongside the Rate of Change with Bollinger Bands with a basis for the midpoint. As always, none of this is investment or financial advice. Please do your own due diligence and research.

YCGH Crypto ultimate Breakout StrategyAdvanced Momentum Breakout Strategy - Optimized for crypto markets, proven effective on equities
Core Features:
Multi-layered signal generation combining volatility expansion and momentum confirmation
Adaptive risk management with dynamic stops, profit targets, and trailing mechanisms
Systematic position sizing with configurable leverage (designed for perpetual/margin trading)
Volatility regime filters to avoid false breakouts during low-momentum periods
Optional trend alignment for directional bias confirmation
Comprehensive backtesting with realistic slippage and commission modeling
Daily drawdown limits for capital preservation
Performance:
Applicable across multiple timeframes (1H, 4H, Daily)
Works on both spot and derivatives markets
Long and short position capability
Interested in using this strategy? This is a paid service. For access to the complete script and implementation support, email: brijamohanjha@gmail.com

Nifty 10m Simple ORB TEST harish//@version=5
strategy("Nifty 10m Simple ORB TEST", overlay=true)
// 10m timeframe check
if timeframe.period != "10"
runtime.error("Use this on 10 minute timeframe")
// First 10m candle high/low (no PCR, no opposite logic – just test syntax)
newDay = ta.change(time("D")) != 0
var float dayHigh = na
var float dayLow = na
if newDay
dayHigh := na
dayLow := na
sessStart = 0915
sessEnd = 0925
hhmm = hour * 100 + minute
isFirst = na(dayHigh) and hhmm >= sessStart and hhmm < sessEnd
if isFirst
dayHigh := high
dayLow := low
// Plot first candle range
plot(dayHigh, "First High", color=color.green, style=plot.style_linebr)
plot(dayLow, "First Low", color=color.red, style=plot.style_linebr)
// Simple breakout entries just to test
longCond = not na(dayHigh) and close > dayHigh
shortCond = not na(dayLow) and close < dayLow
if longCond
strategy.entry("LONG", strategy.long)
if shortCond
strategy.entry("SHORT", strategy.short)

HARRISH DADE//@version=5
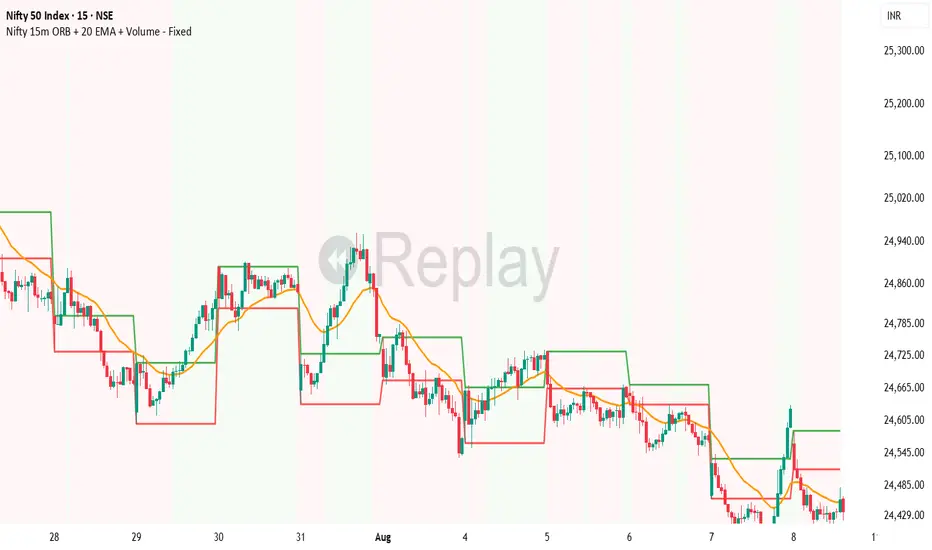
strategy("Nifty 15m ORB + 20 EMA + Volume - Signals Fixed", overlay=true,
initial_capital=100000, default_qty_type=strategy.percent_of_equity, default_qty_value=25,
process_orders_on_close=true)
// 15-minute timeframe check
if timeframe.period != "15"
runtime.error("Use this strategy on 15 minute timeframe only")
// ORB 9:15–9:30 High/Low
var float orbHigh = na
var float orbLow = na
newDay = ta.change(time("D")) != 0
if newDay
orbHigh := na
orbLow := na
sessStart = 0915
sessEnd = 0930
hhmm = hour * 100 + minute
inORB = hhmm >= sessStart and hhmm < sessEnd
if inORB
orbHigh := na(orbHigh) ? high : math.max(orbHigh, high)
orbLow := na(orbLow) ? low : math.min(orbLow, low)
// Plot ORB levels
plot(orbHigh, "ORB High", color=color.new(color.green, 0), linewidth=2)
plot(orbLow, "ORB Low", color=color.new(color.red, 0), linewidth=2)
// Trend filter - 20 EMA
emaLen = input.int(20, "EMA Length", minval=1)
ema20 = ta.ema(close, emaLen)
upTrend = close > ema20
dnTrend = close < ema20
plot(ema20, "EMA 20", color=color.orange, linewidth=2)
// Volume filter - Adaptive
volLen = input.int(20, "Volume MA Length", minval=1)
avgVol = ta.sma(volume, volLen)
volMult = input.float(1.5, "Volume Multiplier", step=0.1)
enoughVol = volume >= (avgVol * volMult)
// ORB complete check
orbLocked = not na(orbHigh) and not na(orbLow) and not inORB
// Entry conditions (for strategy)
longCond = orbLocked and ta.crossover(close, orbHigh) and upTrend and enoughVol
shortCond = orbLocked and ta.crossunder(close, orbLow) and dnTrend and enoughVol
// Risk Management
targetPts = input.float(40.0, "Target Points", step=1.0)
slPts = input.float(25.0, "Stoploss Points", step=1.0)
// STRATEGY ENTRIES
if longCond and strategy.position_size == 0
strategy.entry("LONG", strategy.long)
if shortCond and strategy.position_size == 0
strategy.entry("SHORT", strategy.short)
// STRATEGY EXITS
if strategy.position_size > 0
strategy.exit("LONG EXIT", from_entry="LONG",
limit=strategy.position_avg_price + targetPts,
stop=strategy.position_avg_price - slPts)
if strategy.position_size < 0
strategy.exit("SHORT EXIT", from_entry="SHORT",
limit=strategy.position_avg_price - targetPts,
stop=strategy.position_avg_price + slPts)
// **FIXED BUY/SELL SIGNALS** - No barstate.isconfirmed, direct conditions
plotshape(longCond, title="BUY", style=shape.triangleup, location=location.belowbar,
color=color.new(color.lime, 0), size=size.large, text="BUY", textcolor=color.white)
plotshape(shortCond, title="SELL", style=shape.triangledown, location=location.abovebar,
color=color.new(color.red, 0), size=size.large, text="SELL", textcolor=color.white)
// Debug table - shows if conditions met
if barstate.islast
var table debugTable = table.new(position.top_right, 2, 6, bgcolor=color.white, border_width=1)
table.cell(debugTable, 0, 0, "Condition", text_color=color.black, bgcolor=color.gray)
table.cell(debugTable, 1, 0, "Status", text_color=color.black, bgcolor=color.gray)
table.cell(debugTable, 0, 1, "ORB Locked", text_color=color.black)
table.cell(debugTable, 1, 1, str.tostring(orbLocked), text_color=orbLocked ? color.green : color.red)
table.cell(debugTable, 0, 2, "UpTrend", text_color=color.black)
table.cell(debugTable, 1, 2, str.tostring(upTrend), text_color=upTrend ? color.green : color.red)
table.cell(debugTable, 0, 3, "Enough Vol", text_color=color.black)
table.cell(debugTable, 1, 3, str.tostring(enoughVol), text_color=enoughVol ? color.green : color.red)
JYL Trend Pro V1.0 BETAJYL Trend Pro V1.0 is a rule‑based trend‑following strategy built on a proprietary smoothed price engine.
It focuses on clear trend states and position management rather than classic indicators, and can be used on both long and short side depending on the user’s settings.
Three Signal Modes
1. Stable Mode
Stable mode is the “classic” version of the system.
It reacts only when the trend state clearly flips, and then manages the position with simple rules:
First strong bullish state → open / add to long
First strong bearish state → open / add to short
When the trend weakens but does not fully reverse, the strategy can reduce position size (partial exit)
When the trend flips in the opposite direction, the strategy fully exits the existing position
This mode is designed for traders who prefer fewer signals and smoother equity curves.
2. Impulsive Mode
Impulsive mode keeps the same core logic, but allows the strategy to react earlier and manage exits more actively:
Opportunistic early entries around strong moves
Protective “early stop” logic for those aggressive entries
Segment‑based partial exits after extended bullish or bearish runs
Fast full exits when momentum fades quickly or the trend flips
This mode is aimed at users who accept more trade frequency in exchange for faster reactions.
3. IMP+ Mode (Impulsive Plus)
IMP+ is the advanced version of Impulsive mode. It keeps all core behavior and adds extra controls for power‑users:
Adjustable presets for how early the system can enter a move
Adjustable presets for how quickly early entries are cut if they fail
Smarter add‑ons after a bullish / bearish segment, so adds can occur either at the next strong signal or on a “pullback‑type” bar inside the ongoing trend
Flexible multi‑level partial‑exit packages after a strong run
Additional “emergency exit” logic that can flatten positions when price opens too close to the previous bar after a strong trend segment
All of these options are exposed as presets in the Inputs tab, so users can experiment without touching code.
Signals & Usage
The strategy prints clear labels on the chart:
LONG / SHORT – open or add to position
REDUCE SIZE – partial profit‑taking or risk reduction
SELL LONG / SHORT COVER – full exit of long / short positions
A trade‑direction filter lets you run the system as long‑only, short‑only, or long & short.
This script is provided for educational and research purposes only.
It is not financial advice and does not guarantee any future performance. Always test on a demo account, adjust risk to your own situation, and consult your broker or advisor before trading live.
Internally, this strategy is based on the private JYL Trend Pro rule set and risk‑management framework.
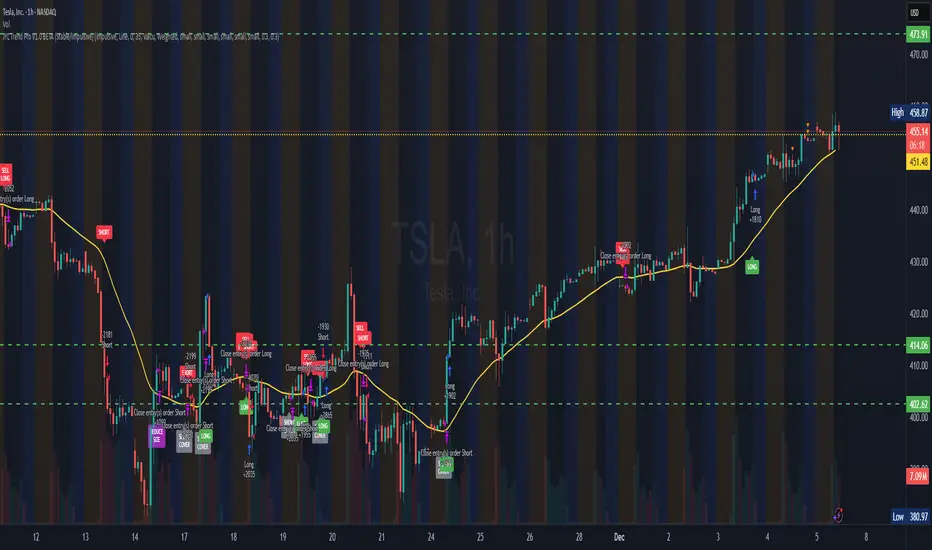
JYL Trend Pro V1.0 BETANASDAQ:TSLA
JYL Trend Pro V1.0 is a rule‑based trend‑following strategy built on a proprietary smoothed price engine.
It focuses on clear trend states and position management rather than classic indicators, and can be used on both long and short side depending on the user’s settings.
Three Signal Modes
1. Stable Mode
Stable mode is the “classic” version of the system.
It reacts only when the trend state clearly flips, and then manages the position with simple rules:
First strong bullish state → open / add to long
First strong bearish state → open / add to short
When the trend weakens but does not fully reverse, the strategy can reduce position size (partial exit)
When the trend flips in the opposite direction, the strategy fully exits the existing position
This mode is designed for traders who prefer fewer signals and smoother equity curves.
2. Impulsive Mode
Impulsive mode keeps the same core logic, but allows the strategy to react earlier and manage exits more actively:
Opportunistic early entries around strong moves
Protective “early stop” logic for those aggressive entries
Segment‑based partial exits after extended bullish or bearish runs
Fast full exits when momentum fades quickly or the trend flips
This mode is aimed at users who accept more trade frequency in exchange for faster reactions.
3. IMP+ Mode (Impulsive Plus)
IMP+ is the advanced version of Impulsive mode. It keeps all core behavior and adds extra controls for power‑users:
Adjustable presets for how early the system can enter a move
Adjustable presets for how quickly early entries are cut if they fail
Smarter add‑ons after a bullish / bearish segment, so adds can occur either at the next strong signal or on a “pullback‑type” bar inside the ongoing trend
Flexible multi‑level partial‑exit packages after a strong run
Additional “emergency exit” logic that can flatten positions when price opens too close to the previous bar after a strong trend segment
All of these options are exposed as presets in the Inputs tab, so users can experiment without touching code.
Signals & Usage
The strategy prints clear labels on the chart:
LONG / SHORT – open or add to position
REDUCE SIZE – partial profit‑taking or risk reduction
SELL LONG / SHORT COVER – full exit of long / short positions
A trade‑direction filter lets you run the system as long‑only, short‑only, or long & short.
This script is provided for educational and research purposes only.
It is not financial advice and does not guarantee any future performance. Always test on a demo account, adjust risk to your own situation, and consult your broker or advisor before trading live.
Internally, this strategy is based on the private JYL Trend Pro rule set and risk‑management framework.

PSAR with EMA FilterThis indicator combines the Parabolic SAR (PSAR) with an EMA trend filter to generate more accurate trend-following signals.
PSAR helps identify potential trend reversals and trailing stop levels, while the EMA ensures that trades are aligned with the overall market direction.

MACD with EMA FilterThis indicator combines the MACD (Moving Average Convergence Divergence) with an EMA-based trend filter to improve the quality of entry signals.
MACD identifies changes in momentum and potential trend reversals, while the EMA ensures that signals are taken only in the direction of the broader trend.

RSI with EMA FilterThis indicator combines the Relative Strength Index (RSI) with a trend-filtering Exponential Moving Average (EMA) to generate higher-quality momentum signals.
RSI identifies overbought and oversold market conditions, while the EMA confirms the overall trend direction, helping traders avoid false signals in choppy markets.

BTC Mon 8am Buy / Wed 2pm Sell (NY Time, Daily + Intraday)This strategy implements a fixed weekly time-based trading schedule for Bitcoin, using New York market hours as the reference clock. It is designed to test whether a consistent pattern exists between early-week accumulation and mid-week distribution in BTC price behavior.
Entry Rule — Monday 8:00 AM (NY Time)
The strategy enters a long position every Monday at exactly 08:00 AM Eastern Time, one hour after the U.S. equities market pre-open activity begins influencing global liquidity.
This timing attempts to capture early-week directional moves in Bitcoin, which sometimes occur as traditional markets come online.
Exit Rule — Wednesday 2:00 PM (NY Time)
The strategy closes the position every Wednesday at 2:00 PM Eastern Time, a point in the week where:
U.S. equity markets are still open
BTC often experiences mid-week volatility rotations
Liquidity is generally high
This exit removes exposure before later-week uncertainty and gives a consistent, measurable time window for each trade.
Timeframe Compatibility
Works on intraday charts (recommended 1h or lower) using precise time-based triggers.
Also runs on daily charts, where entries and exits occur on the Monday and Wednesday bars respectively (daily charts cannot show intraday timestamps).
All timestamps are synced to America/New_York regardless of the exchange’s native timezone.
Trading Frequency
Exactly one trade per week, preventing overtrading and allowing comparison of weekly performance across years of historical BTC price data.
Purpose of the Strategy
This is not a value-based or trend-following system, but a behavioral/time-cycle analysis tool.
It helps evaluate whether a repeating short-term edge exists based solely on:
Weekday timing
Liquidity cycles
Institutional market influence
BTC’s habitual early-week momentum patterns
It is ideal for:
Backtesting weekly BTC behavior
Studying time-based edges
Comparing alternative weekday/time combinations
Visualizing weekly P&L structure
Risk Notes
This strategy does not attempt to predict price direction and should not be assumed profitable without robust backtesting.
Time-based edges can appear, disappear, or invert depending on macro conditions.
There is no stop loss or risk management included by default, so the strategy reflects raw timing-based performance.

Empire OS Automated Trading • Institutional-grade executionEmpire OS – 9/40 EMA Dynamic Momentum Strategy
This strategy isn’t just EMAs — it’s a dynamic entry and exit system built around real-time price behavior. The 9/40 EMA setup gives the base trend direction, and the internal engine calculates every entry, stop, and target using recent price action and a 14-ATR volatility model.
Everything adjusts automatically:
• Entries react to momentum shifts based on the 9/40 EMA separation
• Stops tighten or widen based on the current 14-ATR reading
• Targets scale with real market volatility (not fixed numbers)
• Risk-to-Reward is calculated on the fly for cleaner, stronger trades
• Exits are based on structure + volatility, not random lines
Most strategies use fixed stops, fixed R:R, or standard EMA pairs that anyone can copy.
This one adapts to the market in real time — making every trade unique to current conditions.
It’s rare because almost nobody builds a retail strategy that:
Uses a non-standard 9/40 EMA combo
Calculates stops + targets off real volatility
Adjusts risk reward based on live price activity
Filters entries through momentum AND price structure
Keeps drawdown tight while catching high-quality moves
This is the official Empire OS version — built for consistency, momentum accuracy, and prop-firm scalability.

SergejFxin this indiokator you will gain a lot of succes in your tradinmg life i put my heart and my blood in this wqork and could gain a lot of experience i hope you guys will gain the same
