ZenAlgo - Crypto TrendThe ZenAlgo - Crypto Trend indicator is a unique tool for analyzing cryptocurrency market trends, combining data from multiple sources such as BTC , ETH , market caps, dominance metrics, and the DXY index . Unlike standalone indicators, it integrates these data points to deliver actionable insights on macro and micro market movements, helping traders better navigate complex market conditions.
Features
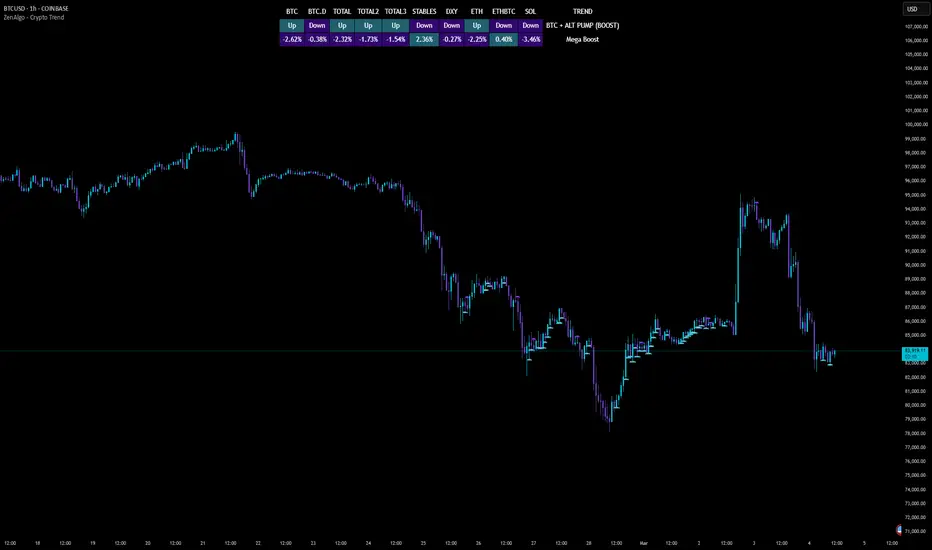
Multi-Asset Trend Analysis: Monitors trends across BTC , ETH , USDT dominance , DXY , SOL , ETHBTC and total market caps ( TOTAL , TOTAL2 , TOTAL3 ), providing a holistic market view.
Dynamic Labels: Real-time market conditions are summarized with labels such as "FIRE SELL," "BTC UP," or "ALT PUMP" for instant clarity.
Customizable Display: Options for dark mode, text size, and table position allow traders to personalize their experience.
Market Sentiment Table: Summarizes trends and percentage changes for multiple assets in a structured, easy-to-read table.
Composite Signals: Identifies unique states like "Mega Boost" or "Outflow" by analyzing the interplay of market trends.
Enhanced Heikin Ashi Analysis: Applies Heikin Ashi trends in a broader context, combining them with other metrics to overcome standalone limitations.
ZenAlgo Theme: A visually distinct and professional theme for enhanced usability.
Added Value: Why Is This Indicator Original/Why Shall You Pay for This Indicator?
The ZenAlgo - Crypto Trend indicator transcends the limitations of free tools in several ways:
Integrated Insights: While Heikin Ashi is freely available, this indicator applies it in tandem with market dominance, total market caps, and macroeconomic indicators like the DXY . This integration creates composite signals (e.g., "Mega Boost," "Defi Mega Boost") that standalone Heikin Ashi cannot provide.
Advanced Contextualization: Free Heikin Ashi indicators lack contextual data about dominance shifts, altcoin performance, and macroeconomic trends. Our indicator integrates these elements to give a broader market perspective.
Time-Saving: Instead of switching between multiple indicators, ZenAlgo - Crypto Trend combines them in one cohesive tool, offering a comprehensive market overview in a single glance.
Custom Features: Unlike generic Heikin Ashi indicators, this tool includes dynamic labels and a market sentiment table that summarize trends and provide immediate insights.
How It Works
1. Heikin Ashi Trend Detection
Calculates smoothed Heikin Ashi trends for BTC , ETH , USDT dominance , DXY , and total market caps ( TOTAL , TOTAL2 , TOTAL3 ).
Functionality: Heikin Ashi values are derived from the weighted average of open, high, low, and close prices. The "open" averages the previous bar's open and close, while the "close" averages the current bar's open, high, low, and close. A trend is assigned as Up (+1) or Down (-1) based on whether the close exceeds the open.
2. Market Metrics Analysis
Tracks daily percentage changes and trends for key metrics like BTC dominance and total market caps.
Outputs: Displays trends (Up/Down) and percentage changes for each asset, helping assess market strength and sentiment.
3. Composite Signal Generation
Combines individual asset trends to define broader market states such as "Mega Boost" or "Outflow."
Logic: Signals are triggered by predefined conditions, e.g., "Mega Boost" occurs when DXY trends down, market caps ( TOTAL , TOTAL2 , TOTAL3 ) trend up, and BTC dominance trends down.
4. Dynamic Labels and Sentiment Table
Displays real-time labels (e.g., "FIRE SELL," "BTC + ALT PUMP") directly on the chart for actionable insights.
A market sentiment table summarizes trends and percentage changes, with customizable display options (position, text size, theme).
Usage Examples
Spotting Bullish Momentum: Use "BTC + ALT PUMP" signals to identify synchronized bullish trends in BTC and altcoins.
Avoiding Bearish Trends: React to "CRYPTO DOWN" or "FIRE SELL" signals to minimize exposure during downturns.
Evaluating Altcoin Opportunities: Identify "ALT PUMP" or "ALTS DUMP" signals to time entries and exits in altcoin markets.
Tracking Dominance Shifts: Monitor "BTC.D UP" or "BTC.D DOWN" trends to assess shifts in market dominance between BTC and altcoins.
Macro Market Awareness: Use "Mega Boost" or "Mega Outflow" states to align with macroeconomic trends, such as dollar strength or weakness.
Seasonal Trends: Observe "ETH PUMP" or "BTC DOWN + ALT PUMP" states to understand specific altcoin or BTC-led market cycles.
Settings
ZenAlgo Theme: Enable a custom ZenAlgo visual style for improved clarity.
Table Text Size: Adjust text size (options: tiny, small, normal, large, huge) for better visibility.
Dark Mode: Toggle dark mode for improved viewing in low-light environments.
Table Position: Choose table placement (e.g., Top Left, Bottom Center) based on your preferences.
Important Notes
Synthetic and Lagging Nature of Heikin Ashi: Heikin Ashi values are synthetic and inherently lagging. They provide smoothed trends but do not represent precise entry or exit points. This indicator does not produce buy or sell signals.
Limitations in Low-Volume Markets: The indicator may underperform in low-liquidity markets or during periods of high volatility, where data discrepancies can distort trends.
Trend Reversals in Choppy Markets: In sideways or choppy markets, the composite signals may lag behind sudden reversals, potentially resulting in delayed recognition of trend changes.
False Positives During Macro News Events: Abrupt macroeconomic news or policy changes can cause the indicator to emit signals (e.g., "Mega Boost") that may not align with sustained market movements.
Dominance Metrics Sensitivity: Heavy reliance on BTC.D or TOTAL3 can sometimes result in misleading insights when these metrics are influenced by atypical events, such as large-scale liquidations or isolated token movements.
Use in Conjunction with Other Tools: While powerful, this indicator should be combined with other technical and fundamental analysis tools for a comprehensive trading strategy.
No Guaranteed Results: Trading involves risk. This tool is designed to support decision-making, not to guarantee trading success.
Cryptotrend
Crypto Market Cap Momentum Analyzer (AiBitcoinTrend)The Crypto Market Cap Momentum Analyzer (AiBitcoinTrend) is a robust tool designed to uncover trading opportunities by blending market cap analysis and momentum dynamics. Inspired by research-backed quantitative strategies, this indicator helps traders identify trend-following and mean-reversion setups in the cryptocurrency market by evaluating recent performance and market cap size.
This indicator classifies cryptocurrencies into market cap quintiles and ranks them based on their 2-week momentum. It then suggests potential trades—whether to go long, anticipate reversals, or simply hold—based on the crypto's market cap group and momentum trends.
👽 How the Indicator Works
👾 Market Cap Classification
The indicator categorizes cryptocurrencies into one of five market cap groups based on user-defined inputs:
Large Cap: Highest market cap tier
Upper Mid Cap: Second highest group
Mid Cap: Middle-tier market caps
Lower Mid Cap: Slightly below the mid-tier
Small Cap: Lowest market cap tier
This classification dynamically adjusts based on the provided market cap data, ensuring that you’re always working with a representative market structure.
👾 Momentum Calculation
By default, the indicator uses a 2-week momentum measure (e.g., a 14-day lookback when set to daily). It compares a cryptocurrency’s current price to its price 14 bars ago, thereby quantifying its short-term performance. Users can adjust the momentum period and rebalance period to capture shorter or longer-term trends depending on their trading style.
👾 Dynamic Ranking and Trade Suggestions
After assigning cryptos to size quintiles, the indicator sorts them by their momentum within each quintile. This two-step process results in:
Long Trade: For smaller market cap groups (Small, Lower Mid, Mid Cap) that have low (bottom-quintile) momentum, anticipating a trend continuation or breakout.
Reversal Trade: For the largest market cap group (Large Cap) that shows low momentum, expecting a mean-reversion back to equilibrium.
Hold: In scenarios where the coin’s momentum doesn’t present a strong contrarian or trend-following signal.
👽 Applications
👾 Trend-Following in Smaller Caps: Identify small or mid-cap cryptos with low momentum that might be poised for a breakout or sustained trend.
👾 Mean-Reversion in Large Caps: Pinpoint large-cap cryptocurrencies experiencing a temporary lull in performance, potentially ripe for a rebound.
👽 Why It Works in Crypto
The cryptocurrency market is heavily driven by retail investor sentiment and volatility. Research shows that:
Small-Cap Cryptos: Tend to experience higher volatility and speculative trends, making them ideal for momentum trades.
Large-Cap Cryptos: Exhibit more predictable behavior, making them suitable for mean-reversion strategies when momentum is low.
This indicator captures these dynamics to give traders a strategic edge in identifying both momentum and reversal opportunities.
👽 Indicator Settings
👾 Rebalance Period: The frequency at which momentum and trade suggestions are recalculated (Daily, Weekly, Monthly).
Shorter Periods (Daily): Fast updates, suitable for short-term trades, but more noise.
Longer Periods (Weekly/Monthly): Smoother signals, ideal for swing trading and more stable trends.
👾 Momentum Period: The lookback period for momentum calculation (default is 14 bars).
Shorter Periods: More responsive but prone to noise.
Longer Periods : Reflects broader trends, reducing sensitivity to short-term fluctuations.
Disclaimer: This information is for entertainment purposes only and does not constitute financial advice. Please consult with a qualified financial advisor before making any investment decisions.
