Advanced Currency StrengthThis indicator shows the strength of currency based on its movement. Ossiclator.
Chu kỳ

Lump Sum Favorability (SPX & NDX)This indicator provides a visual dashboard to gauge the statistical favorability of deploying a "Lump Sum" investment into the SPX (S&P 500) or NDX (Nasdaq 100).
The primary goal is not to time the exact market bottom, but to identify zones of significant pessimism or euphoria. Historically, periods of indiscriminate selling have represented high-probability entry points for long-term investors.
The dashboard consists of two parts:
1. The Favorability Gauge: A 12-segment gauge that moves from Red (Unfavorable) to Teal (Favorable).
2. The Summary Text: An optional text box (enabled in settings) that provides a plain-English summary of the current market breadth.
---
The Method: Market Breadth
This indicator is not based on the price of the index itself. Price-based indicators (like an RSI on the SPX) can be misleading. In a market-cap-weighted index, a few mega-cap stocks can hold the index price up while the vast majority of "average" stocks are already in a deep bear market.
This tool uses Market Breadth to measure the true, underlying health and participation of the entire market.
How It Works
1. Data Source: The indicator pulls the daily percentage of companies within the selected index (SPX or NDX) that are trading above their 200-day moving average. (Data tickers: S5TH for SPX, NDTH for NDX).
2. Smoothing: This raw data is volatile. To filter out daily noise and confirm a persistent trend, the indicator calculates a 5-day Simple Moving Average (SMA) of this percentage. This is the value used by the indicator.
3. Interpretation:
High Value (>= 50%): More than half of the stocks are above their long-term average. This signifies the market is "Overheated" or in a risk-on phase. The favorability for a new lump sum investment is considered Low.
Low Value (< 50%): Less than half of the stocks are above their long-term average. This signifies "Oversold" conditions or capitulation. These moments historically offer the best favorability for starting a new long-term investment.
---
How to Use the Indicator
1. The Favorability Gauge
The gauge is designed to be intuitive: Red means "Stop/Caution," and Teal means "Go/Opportunity."
Note: The gauge's logic is inverted from the data value to achieve this simplicity.
Red Zone (Left): UNFAVORABLE
This corresponds to a high percentage of stocks being above their 200d MA (>= 50%). The market is considered Overheated, and the favorability for a new lump sum investment is low.
Teal Zone (Right): FAVORABLE
This corresponds to a low percentage of stocks being above their 200d MA (< 50%). The market is considered Oversold, and the favorability for a new lump sum investment is high.
2. The Summary Text
When "Show Summary Text" is enabled in the settings, a box will appear at the top-center of your chart. This box provides a clear, data-driven summary, such as:
"Currently, only 22% of S&P 500 companies are above their 200-day MA. Market is Oversold."
The color of this text will automatically change to match the market state (Red for Overheated, Teal for Oversold), providing instant confirmation of the gauge's reading.
---
Settings
Market: Choose the index to analyze: SPX (S&P 500) or NDX (Nasdaq 100).
Gauge Position: Select where the gauge dashboard should appear on your chart (default is Bottom Right).
Show Summary Text: Toggle the descriptive text box on or off (default is On).
---
This indicator is a statistical and historical guide, not a financial advice or timing signal. It is designed to measure favorability based on past market behavior, not to provide certainty.
Extreme oversold conditions can persist, and markets can always go lower. This tool should be used as one component of a broader investment and risk-management framework. Past performance is not a guarantee of future results.

SECTOR ROTATION Sector Rotation Indicator with Auto Chart Symbol
This indicator helps traders track relative performance across multiple indices/sectors simultaneously, making it easy to identify sector rotation and market leadership.
Key Features:
✅ 21 Symbols Tracking: Monitor 20 customizable symbols + your current chart symbol automatically(DIVIDEND SYMBOL)
✅ Percentage Performance: All moving averages show percentage gain/loss from 1 timeframe period ago
✅ Color-Coded Visualization: Heat map coloring (red to green) based on relative performance ranking
✅ Flexible Timeframes: Works on any timeframe from 1-minute to 12-month charts
✅ Performance Table: Quick-view table showing candle performance with inside/outside bar detection
✅ Indian Market Ready: Pre-configured with NSE indices (NIFTY, BANKNIFTY, and sectoral indices)
Default Symbols (Customizable):
NIFTY, CNXSMALLCAP, CNXMIDCAP, BANKNIFTY
Sector indices: IT, AUTO, PHARMA, METAL, ENERGY, FMCG, etc.
Plus your current chart symbol (automatically added)
How It Works:
Select your preferred timeframe (1D, 1W, 1M, etc.)
The indicator calculates percentage performance from given period ago
Moving averages show smoothed performance trends
Colors indicate relative strength: Green = outperformers, Red = underperformers
Perfect For:
Sector rotation analysis
Relative strength comparison
Market breadth assessment
Index/ETF traders
Swing and position traders
Settings:
Adjustable MA length (default: 20)
Customizable colors and table position
Show/hide percentage labels
Horizontal or vertical table layout
This is not any buy or sell signal or recommendation, consult with your advisor first.

DAX Zonen Ergänzungen (Pro Signale + EMAs mit Filter RSI MACD)📊 DAX Zones Enhancements (Pro Signals + EMA with RSI & MACD Filter)
Description:
This indicator enhances DAX trading analysis by combining dynamic support/resistance zones with professional-level signal filters. It automatically detects potential buy and sell zones and confirms them using EMA trends, RSI conditions, and MACD momentum.
Key features:
🔹 Visual display of DAX high- and low-price zones
🔹 EMA-based trend confirmation
🔹 RSI and MACD filters to reduce false signals
🔹 Customizable alerts when price interacts with key zones
🔹 Works on multiple timeframes
Ideal for traders who want a clean, rule-based approach to identifying high-probability entries and exits on the DAX index.

Holt Damped Forecast [CHE]A Friendly Note on These Pine Script Scripts
Hey there! Just wanted to share a quick, heartfelt heads-up: All these Pine Script examples come straight from my own self-study adventures as a total autodidact—think late nights tinkering and learning on my own. They're purely for educational vibes, helping me (and hopefully you!) get the hang of Pine Script basics, cool indicators, and building simple strategies.
That said, please know this isn't any kind of financial advice, investment nudge, or pro-level trading blueprint. I'd love for you to dive in with your own research, run those backtests like a champ, and maybe bounce ideas off a qualified expert before trying anything in a real trading setup. No guarantees here on performance or spot-on accuracy—trading's got its risks, and those are totally on each of us.
Let's keep it fun and educational—happy coding! 😊
Holt Damped Forecast — Damped trend forecasts with fan bands for uncertainty visualization and momentum integration
Summary
This indicator applies damped exponential smoothing to generate forward price forecasts, displaying them as probabilistic fan bands to highlight potential ranges rather than point estimates. It incorporates residual-based uncertainty to make projections more reliable in varying market conditions, reducing overconfidence in strong trends. Momentum from the trend component is shown in an optional label alongside signals, aiding quick assessment of direction and strength without relying on lagging oscillators.
Motivation: Why this design?
Standard exponential smoothing often extrapolates trends indefinitely, leading to unrealistic forecasts during mean reversion or weakening momentum. This design uses damping to gradually flatten long-term projections, better suiting real markets where trends fade. It addresses the need for visual uncertainty in forecasts, helping traders avoid entries based on overly optimistic point predictions.
What’s different vs. standard approaches?
- Reference baseline: Diverges from basic Holt's linear exponential smoothing, which assumes persistent trends without decay.
- Architecture differences:
- Adds damping to the trend extrapolation for finite-horizon realism.
- Builds fan bands from historical residuals for probabilistic ranges at multiple confidence levels.
- Integrates a dynamic label combining forecast details, scaled momentum, and directional signals.
- Applies tail background coloring to recent bars based on forecast direction for immediate visual cues.
- Practical effect: Charts show converging forecast bands over time, emphasizing shorter horizons where accuracy is higher. This visibly tempers aggressive projections in trends, making it easier to spot when uncertainty widens, which signals potential reversals or consolidation.
How it works (technical)
The indicator maintains two persistent components: a level tracking the current price baseline and a trend capturing directional slope. On each bar, the level updates by blending the current source price with a one-step-ahead expectation from the prior level and damped trend. The trend then adjusts by weighting the change in level against the prior damped trend. Forecasts extend this forward over a user-defined number of steps, with damping ensuring the trend influence diminishes over distance.
Uncertainty derives from the standard deviation of historical residuals—the differences between actual prices and one-step expectations—scaled by the damping structure for the forecast horizon. Bands form around the median forecast at specified confidence intervals using these scaled errors. Initialization seeds the level to the first bar's price and trend to zero, with persistence handling subsequent updates. A security call fetches the last bar index for tail logic, using lookahead to align with realtime but introducing minor repaint on unconfirmed bars.
Parameter Guide
The Source parameter selects the price input for level and residual calculations, defaulting to close; consider using high or low for assets sensitive to volatility, as close works well for most trend-following setups. Forecast Steps (h) defines the number of bars ahead for projections, defaulting to 4—shorter values like 1 to 5 suit intraday trading, while longer ones may widen bands excessively in choppy conditions. The Color Scheme (2025 Trends) option sets the base, up, and down colors for bands, labels, and backgrounds, starting with Ruby Dawn; opt for serene schemes on clean charts or vibrant ones to stand out in dark themes.
Level Smoothing α controls the responsiveness of the price baseline, defaulting to 0.3—values above 0.5 enhance tracking in fast markets but may amplify noise, whereas lower settings filter disturbances better. Trend Smoothing β adjusts sensitivity to slope changes, at 0.1 by default; increasing to 0.2 helps detect emerging shifts quicker, but keeping it low prevents whipsaws in sideways action. Damping φ (0..1) governs trend persistence, defaulting to 0.8—near 0.9 preserves carryover in sustained moves, while closer to 0.5 curbs overextensions more aggressively.
Show Fan Bands (50/75/95) toggles the probabilistic range display, enabled by default; disable it in oscillator panes to reduce clutter, but it's key for overlay forecasts. Residual Window (Bars) sets the length for deviation estimates, at 400 bars initially—100 to 200 works for short timeframes, and 500 or more adds stability over extended histories. Line Width determines the thickness of band and median lines, defaulting to 2; go thicker at 3 to 5 for emphasis on higher timeframes or thinner for layered indicators.
Show Median/Forecast Line reveals the central projection, on by default—hide if bands provide enough detail, or keep for pinpoint entry references. Show Integrated Label activates the combined view of forecast, momentum, and signal, defaulting to true; it's right-aligned for convenience, so turn it off on smaller screens to save space. Show Tail Background colors the last few bars by forecast direction, enabled initially; pair low transparency for subtle hints or higher for bolder emphasis.
Tail Length (Bars) specifies bars to color backward from the current one, at 3 by default—1 to 2 fits scalping, while 5 or more underscores building momentum. Tail Transparency (%) fades the background intensity, starting at 80; 50 to 70 delivers strong signals, and 90 or above allows seamless blending. Include Momentum in Label adds the scaled trend value, defaulting to true—ATR% scaling here offers relative strength context across assets.
Include Long/Short/Neutral Signal in Label displays direction from the trend sign, on by default; neutral helps in ranging markets, though it can be overlooked during strong trends. Scaling normalizes momentum output (raw, ATR-relative, or level-relative), set to ATR% initially—ATR% ensures cross-asset comparability, while %Level provides percentage perspectives. ATR Length defines the period for true range averaging in scaling, at 14; align it with your chart timeframe or shorten for quicker volatility responses.
Decimals sets precision in the momentum label, defaulting to 2—0 to 1 yields clean integers, and 3 or more suits detailed forex views. Show Zero-Cross Markers places arrows at direction changes, enabled by default; keep size small to minimize clutter, with text labels for fast scanning.
Reading & Interpretation
Fan bands expand outward from the current bar, with the median line as the central forecast—narrower bands indicate lower uncertainty, wider suggest caution. Colors tint up (positive forecast vs. prior level) in the scheme's up hue and down otherwise. The optional label lists the horizon, median, and range brackets at 50%, 75%, and 95% levels, followed by momentum (scaled per mode) and signal (Long if positive trend, Short if negative, Neutral if zero). Zero-cross arrows mark trend flips: upward triangle below bar for bullish cross, downward above for bearish. Tail background reinforces the forecast direction on recent bars.
Practical Workflows & Combinations
- Trend following: Enter long on upward zero-cross if median forecast rises above price and bands contain it; confirm with higher highs/lows. Short on downward cross with falling median.
- Exits/Stops: Trail stops below 50% lower band in longs; exit if momentum drifts negative or signal turns neutral. Use wider bands (75/95%) for conservative holds in volatile regimes.
- Multi-asset/Multi-TF: Defaults work across stocks, forex, crypto on 5m-1D; scale steps by TF (e.g., 10+ on daily). Layer with volume or structure tools—avoid over-reliance on isolated crosses.
Behavior, Constraints & Performance
Closed-bar logic ensures stable historical plots, but realtime updates via security lookahead may shift forecasts until bar confirmation, introducing minor repaint on the last bar. No explicit HTF calls beyond bar index fetch, minimizing gaps but watch for low-liquidity assets. Resources include a 2000-bar lookback for residuals and up to 500 labels, with no loops—efficient for most charts. Known limits: Early bars show wide bands due to sparse residuals; assumes stationary errors, so gaps or regime shifts widen inaccuracies.
Sensible Defaults & Quick Tuning
Start with defaults for balanced smoothing on 15m-4H charts. For choppy conditions (too many crosses), lower β to 0.05 and raise residual window to 600 for stability. In trending markets (sluggish signals), increase α/β to 0.4/0.2 and shorten steps to 2. If bands overexpand, boost φ toward 0.95 to preserve trend carry. Tune colors for theme fit without altering logic.
What this indicator is—and isn’t
This is a visualization and signal layer for damped forecasts and momentum, complementing price action analysis. It isn’t a standalone system—pair with risk rules and broader context. Not predictive beyond the horizon; use for confirmation, not blind entries.
Disclaimer
The content provided, including all code and materials, is strictly for educational and informational purposes only. It is not intended as, and should not be interpreted as, financial advice, a recommendation to buy or sell any financial instrument, or an offer of any financial product or service. All strategies, tools, and examples discussed are provided for illustrative purposes to demonstrate coding techniques and the functionality of Pine Script within a trading context.
Any results from strategies or tools provided are hypothetical, and past performance is not indicative of future results. Trading and investing involve high risk, including the potential loss of principal, and may not be suitable for all individuals. Before making any trading decisions, please consult with a qualified financial professional to understand the risks involved.
By using this script, you acknowledge and agree that any trading decisions are made solely at your discretion and risk.
Do not use this indicator on Heikin-Ashi, Renko, Kagi, Point-and-Figure, or Range charts, as these chart types can produce unrealistic results for signal markers and alerts.
Best regards and happy trading
Chervolino

Current Weekly Open LineThis indicator is an indicator to make your weekly review.
It shows exactly where the last weekly open candle has been, so you don't have to search it manually.

Current Weekly Open LineVertical line on current weekly open.
To know exactly on every chart where the current weekly opening is, without having to do it manually.

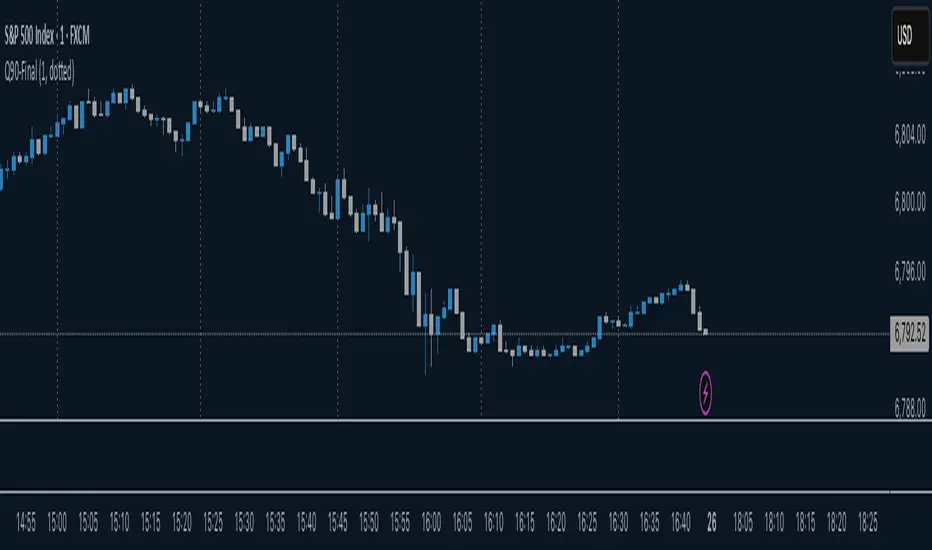
Micro cycle0-Minute Quarter Cycle Indicator (Q90-Final)
This indicator plots vertical lines marking the four quarters (Q1,Q2,Q3,Q4) of a continuous 90-minute cycle.
It is designed for traders who utilize time-based cycles for market analysis and entry/exit timing.
So you can easy identify the cycles off the micro cycles Q1,Q2,Q3 and Q4

Buyside & Sellside Liquidity The Buyside & Sellside Liquidity Indicator is an advanced Smart Money Concepts (SMC) tool that automatically detects and visualizes liquidity zones and liquidity voids (imbalances) directly on the chart.
🟢 Function and meaning:
1. Buyside Liquidity (green):
Highlights price zones above current price where short traders’ stop-loss orders are likely resting.
When price sweeps these areas, it often indicates a liquidity grab or stop hunt.
👉 These zones are labeled with 💵💰 emojis for a clear visual cue where smart money collects liquidity.
2. Sellside Liquidity (red):
Highlights zones below the current price where long traders’ stop-losses are likely placed.
Once breached, these often signal a potential reversal upward.
👉 The 💵💰🪙 emojis make these liquidity targets visually intuitive on the chart.
3. Liquidity Voids (bright areas):
Indicate inefficient price areas, where the market moved too quickly without filling orders.
These zones are often revisited later as the market seeks balance (fair value).
👉 Shown as light shaded boxes with 💰 emojis to emphasize imbalance regions.
💡 Usage:
• Helps spot smart money manipulation and stop hunts.
• Marks potential reversal or breakout zones.
• Great for traders applying SMC, ICT, or Fair Value Gap strategies.
✨ Highlight:
Dollar and money bag emojis (💵💰🪙💸) are integrated directly into chart labels to create a clear and visually engaging representation of liquidity areas.


Fibonacci levels MTF 2WEEK KKKKA Fibonacci arc trading strategy uses circular arcs drawn at Fibonacci retracement levels (38.2%, 50%, 61.8%) to identify potential support and resistance zones, often intersecting with a trend line. This strategy helps traders anticipate price reversals or pullbacks, and it should be used in conjunction with other indicators

WaveTrend RBF What it does
WT-RBF extracts a “wave” of momentum by subtracting a fast Gaussian-weighted smoother from a slow one, then robust-normalizes that wave with a median/MAD proxy to produce a z-score (z). A short EMA of z forms the signal line. Optional dynamic thresholds use the MAD of z itself so overbought/oversold levels adapt to volatility regimes.
How it’s built:
Radial (Gaussian) smoothers
Causal, exponentially-decaying weights over the last radius bars using σ (sigma) to control spread.
fast = rbf_smooth(src, fastR, fastSig)
slow = rbf_smooth(src, slowR, slowSig)
wave = fast − slow (band-pass)
Robust normalization
A two-stage EMA approximates the median; MAD is estimated from EMA of absolute deviations and scaled by 1.4826 to be stdev-comparable.
z = (wave − center) / MAD
Thresholds
Dynamic OB/OS: ±2.5 × MAD(z) (or fixed levels when disabled)
Reading the indicator
Bull Cross: z crosses above sig → momentum turning up.
Bear Cross: z crosses below sig → momentum turning down.
Exits / Bias flips: zero-line crosses (below 0 → exit long bias; above 0 → exit short bias).
Overbought/Oversold: z > +thrOB or z < thrOS. With dynamics on, the bands widen/narrow with recent noise; with dynamics off, static guides at ±2 / ±2.5 are shown.
Core Inputs
Source: Price series to analyze.
Fast Radius / Fast Sigma (defaults 6 / 2.5): Shorter radius/smaller σ = snappier, higher-freq.
Slow Radius / Slow Sigma (defaults 14 / 5.0): Larger radius/σ = smoother, lower-freq baseline.
Normalization
Robust Z-Score Window (default 200): Lookback for median/MAD proxy (stability vs responsiveness).
Small ε for MAD: Floor to avoid division by zero.
Signal & Thresholds
Dynamic Thresholds (MAD-based) (on by default): Adaptive OB/OS; toggle off to use fixed guides.
Visuals
Shade OB/OS Regions: Background highlights when z is beyond thresholds.
Show Zero Line: Midline reference.
(“Plot Cross Markers” input is present for future use.)

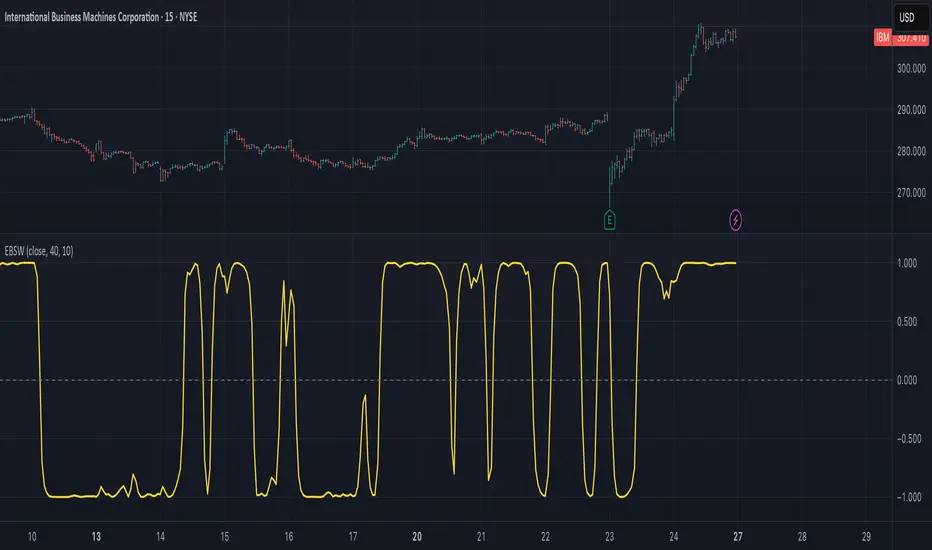
Ehlers Even Better Sinewave (EBSW)# EBSW: Ehlers Even Better Sinewave
## Overview and Purpose
The Ehlers Even Better Sinewave (EBSW) indicator, developed by John Ehlers, is an advanced cycle analysis tool. This implementation is based on a common interpretation that uses a cascade of filters: first, a High-Pass Filter (HPF) to detrend price data, followed by a Super Smoother Filter (SSF) to isolate the dominant cycle. The resulting filtered wave is then normalized using an Automatic Gain Control (AGC) mechanism, producing a bounded oscillator that fluctuates between approximately +1 and -1. It aims to provide a clear and responsive measure of market cycles.
## Core Concepts
* **Detrending (High-Pass Filter):** A 1-pole High-Pass Filter removes the longer-term trend component from the price data, allowing the indicator to focus on cyclical movements.
* **Cycle Smoothing (Super Smoother Filter):** Ehlers' Super Smoother Filter is applied to the detrended data to further refine the cycle component, offering effective smoothing with relatively low lag.
* **Wave Generation:** The output of the SSF is averaged over a short period (typically 3 bars) to create the primary "wave".
* **Automatic Gain Control (AGC):** The wave's amplitude is normalized by dividing it by the square root of its recent power (average of squared values). This keeps the oscillator bounded and responsive to changes in volatility.
* **Normalized Oscillator:** The final output is a single sinewave-like oscillator.
## Common Settings and Parameters
| Parameter | Default | Function | When to Adjust |
| ----------- | ------- | --------------------------------------------------------------------------------------------- | ----------------------------------------------------------------------------------------------------------------------------------------------- |
| Source | close | Price data used for calculation. | Typically `close`, but `hlc3` or `ohlc4` can be used for a more comprehensive price representation. |
| HP Length | 40 | Lookback period for the 1-pole High-Pass Filter used for detrending. | Shorter periods make the filter more responsive to shorter cycles; longer periods focus on longer-term cycles. Adjust based on observed cycle characteristics. |
| SSF Length | 10 | Lookback period for the Super Smoother Filter used for smoothing the detrended cycle component. | Shorter periods result in a more responsive (but potentially noisier) wave; longer periods provide more smoothing. |
**Pro Tip:** The `HP Length` and `SSF Length` parameters should be tuned based on the typical cycle lengths observed in the market and the desired responsiveness of the indicator.
## Calculation and Mathematical Foundation
**Simplified explanation:**
1. Remove the trend from the price data using a 1-pole High-Pass Filter.
2. Smooth the detrended data using a Super Smoother Filter to get a clean cycle component.
3. Average the output of the Super Smoother Filter over the last 3 bars to create a "Wave".
4. Calculate the average "Power" of the Super Smoother Filter output over the last 3 bars.
5. Normalize the "Wave" by dividing it by the square root of the "Power" to get the final EBSW value.
**Technical formula (conceptual):**
1. **High-Pass Filter (HPF - 1-pole):**
`angle_hp = 2 * PI / hpLength`
`alpha1_hp = (1 - sin(angle_hp)) / cos(angle_hp)`
`HP = (0.5 * (1 + alpha1_hp) * (src - src )) + alpha1_hp * HP `
2. **Super Smoother Filter (SSF):**
`angle_ssf = sqrt(2) * PI / ssfLength`
`alpha2_ssf = exp(-angle_ssf)`
`beta_ssf = 2 * alpha2_ssf * cos(angle_ssf)`
`c2 = beta_ssf`
`c3 = -alpha2_ssf^2`
`c1 = 1 - c2 - c3`
`Filt = c1 * (HP + HP )/2 + c2*Filt + c3*Filt `
3. **Wave Generation:**
`WaveVal = (Filt + Filt + Filt ) / 3`
4. **Power & Automatic Gain Control (AGC):**
`Pwr = (Filt^2 + Filt ^2 + Filt ^2) / 3`
`EBSW_SineWave = WaveVal / sqrt(Pwr)` (with check for Pwr == 0)
> 🔍 **Technical Note:** The combination of HPF and SSF creates a form of band-pass filter. The AGC mechanism ensures the output remains scaled, typically between -1 and +1, making it behave like a normalized oscillator.
## Interpretation Details
* **Cycle Identification:** The EBSW wave shows the current phase and strength of the dominant market cycle as filtered by the indicator. Peaks suggest cycle tops, and troughs suggest cycle bottoms.
* **Trend Reversals/Momentum Shifts:** When the EBSW wave crosses the zero line, it can indicate a potential shift in the short-term cyclical momentum.
* Crossing up through zero: Potential start of a bullish cyclical phase.
* Crossing down through zero: Potential start of a bearish cyclical phase.
* **Overbought/Oversold Levels:** While normalized, traders often establish subjective or statistically derived overbought/oversold levels (e.g., +0.85 and -0.85, or other values like +0.7, +0.9).
* Reaching above the overbought level and turning down may signal a potential cyclical peak.
* Falling below the oversold level and turning up may signal a potential cyclical trough.
## Limitations and Considerations
* **Parameter Sensitivity:** The indicator's performance depends on tuning `hpLength` and `ssfLength` to prevailing market conditions.
* **Non-Stationary Markets:** In strongly trending markets with weak cyclical components, or in very choppy non-cyclical conditions, the EBSW may produce less reliable signals.
* **Lag:** All filtering introduces some lag. The Super Smoother Filter is designed to minimize this for its degree of smoothing, but lag is still present.
* **Whipsaws:** Rapid oscillations around the zero line can occur in volatile or directionless markets.
* **Requires Confirmation:** Signals from EBSW are often best confirmed with other forms of technical analysis (e.g., price action, volume, other non-correlated indicators).
## References
* Ehlers, J. F. (2002). *Rocket Science for Traders: Digital Signal Processing Applications*. John Wiley & Sons.
* Ehlers, J. F. (2013). *Cycle Analytics for Traders: Advanced Technical Trading Concepts*. John Wiley & Sons.
Ehlers Phasor Analysis (PHASOR)# PHASOR: Phasor Analysis (Ehlers)
## Overview and Purpose
The Phasor Analysis indicator, developed by John Ehlers, represents an advanced cycle analysis tool that identifies the phase of the dominant cycle component in a time series through complex signal processing techniques. This sophisticated indicator uses correlation-based methods to determine the real and imaginary components of the signal, converting them to a continuous phase angle that reveals market cycle progression. Unlike traditional oscillators, the Phasor provides unwrapped phase measurements that accumulate continuously, offering unique insights into market timing and cycle behavior.
## Core Concepts
* **Complex Signal Analysis** — Uses real and imaginary components to determine cycle phase
* **Correlation-Based Detection** — Employs Ehlers' correlation method for robust phase estimation
* **Unwrapped Phase Tracking** — Provides continuous phase accumulation without discontinuities
* **Anti-Regression Logic** — Prevents phase angle from moving backward under specific conditions
Market Applications:
* **Cycle Timing** — Precise identification of cycle peaks and troughs
* **Market Regime Analysis** — Distinguishes between trending and cycling market conditions
* **Turning Point Detection** — Advanced warning system for potential market reversals
## Common Settings and Parameters
| Parameter | Default | Function | When to Adjust |
|-----------|---------|----------|----------------|
| Period | 28 | Fixed cycle period for correlation analysis | Match to expected dominant cycle length |
| Source | Close | Price series for phase calculation | Use typical price or other smoothed series |
| Show Derived Period | false | Display calculated period from phase rate | Enable for adaptive period analysis |
| Show Trend State | false | Display trend/cycle state variable | Enable for regime identification |
## Calculation and Mathematical Foundation
**Technical Formula:**
**Stage 1: Correlation Analysis**
For period $n$ and source $x_t$:
Real component correlation with cosine wave:
$$R = \frac{n \sum x_t \cos\left(\frac{2\pi t}{n}\right) - \sum x_t \sum \cos\left(\frac{2\pi t}{n}\right)}{\sqrt{D_{cos}}}$$
Imaginary component correlation with negative sine wave:
$$I = \frac{n \sum x_t \left(-\sin\left(\frac{2\pi t}{n}\right)\right) - \sum x_t \sum \left(-\sin\left(\frac{2\pi t}{n}\right)\right)}{\sqrt{D_{sin}}}$$
where $D_{cos}$ and $D_{sin}$ are normalization denominators.
**Stage 2: Phase Angle Conversion**
$$\theta_{raw} = \begin{cases}
90° - \arctan\left(\frac{I}{R}\right) \cdot \frac{180°}{\pi} & \text{if } R eq 0 \\
0° & \text{if } R = 0, I > 0 \\
180° & \text{if } R = 0, I \leq 0
\end{cases}$$
**Stage 3: Phase Unwrapping**
$$\theta_{unwrapped}(t) = \theta_{unwrapped}(t-1) + \Delta\theta$$
where $\Delta\theta$ is the normalized phase difference.
**Stage 4: Ehlers' Anti-Regression Condition**
$$\theta_{final}(t) = \begin{cases}
\theta_{final}(t-1) & \text{if regression conditions met} \\
\theta_{unwrapped}(t) & \text{otherwise}
\end{cases}$$
**Derived Calculations:**
Derived Period: $P_{derived} = \frac{360°}{\Delta\theta_{final}}$ (clamped to )
Trend State:
$$S_{trend} = \begin{cases}
1 & \text{if } \Delta\theta \leq 6° \text{ and } |\theta| \geq 90° \\
-1 & \text{if } \Delta\theta \leq 6° \text{ and } |\theta| < 90° \\
0 & \text{if } \Delta\theta > 6°
\end{cases}$$
> 🔍 **Technical Note:** The correlation-based approach provides robust phase estimation even in noisy market conditions, while the unwrapping mechanism ensures continuous phase tracking across cycle boundaries.
## Interpretation Details
* **Phasor Angle (Primary Output):**
- **+90°**: Potential cycle peak region
- **0°**: Mid-cycle ascending phase
- **-90°**: Potential cycle trough region
- **±180°**: Mid-cycle descending phase
* **Phase Progression:**
- Continuous upward movement → Normal cycle progression
- Phase stalling → Potential cycle extension or trend development
- Rapid phase changes → Cycle compression or volatility spike
* **Derived Period Analysis:**
- Period < 10 → High-frequency cycle dominance
- Period 15-40 → Typical swing trading cycles
- Period > 50 → Trending market conditions
* **Trend State Variable:**
- **+1**: Long trend conditions (slow phase change in extreme zones)
- **-1**: Short trend or consolidation (slow phase change in neutral zones)
- **0**: Active cycling (normal phase change rate)
## Applications
* **Cycle-Based Trading:**
- Enter long positions near -90° crossings (cycle troughs)
- Enter short positions near +90° crossings (cycle peaks)
- Exit positions during mid-cycle phases (0°, ±180°)
* **Market Timing:**
- Use phase acceleration for early trend detection
- Monitor derived period for cycle length changes
- Combine with trend state for regime-appropriate strategies
* **Risk Management:**
- Adjust position sizes based on cycle clarity (derived period stability)
- Implement different risk parameters for trending vs. cycling regimes
- Use phase velocity for stop-loss placement timing
## Limitations and Considerations
* **Parameter Sensitivity:**
- Fixed period assumption may not match actual market cycles
- Requires cycle period optimization for different markets and timeframes
- Performance degrades when multiple cycles interfere
* **Computational Complexity:**
- Correlation calculations over full period windows
- Multiple mathematical transformations increase processing requirements
- Real-time implementation requires efficient algorithms
* **Market Conditions:**
- Most effective in markets with clear cyclical behavior
- May provide false signals during strong trending periods
- Requires sufficient historical data for correlation analysis
Complementary Indicators:
* MESA Adaptive Moving Average (cycle-based smoothing)
* Dominant Cycle Period indicators
* Detrended Price Oscillator (cycle identification)
## References
1. Ehlers, J.F. "Cycle Analytics for Traders." Wiley, 2013.
2. Ehlers, J.F. "Cybernetic Analysis for Stocks and Futures." Wiley, 2004.

Ehlers Autocorrelation Periodogram (EACP)# EACP: Ehlers Autocorrelation Periodogram
## Overview and Purpose
Developed by John F. Ehlers (Technical Analysis of Stocks & Commodities, Sep 2016), the Ehlers Autocorrelation Periodogram (EACP) estimates the dominant market cycle by projecting normalized autocorrelation coefficients onto Fourier basis functions. The indicator blends a roofing filter (high-pass + Super Smoother) with a compact periodogram, yielding low-latency dominant cycle detection suitable for adaptive trading systems. Compared with Hilbert-based methods, the autocorrelation approach resists aliasing and maintains stability in noisy price data.
EACP answers a central question in cycle analysis: “What period currently dominates the market?” It prioritizes spectral power concentration, enabling downstream tools (adaptive moving averages, oscillators) to adjust responsively without the lag present in sliding-window techniques.
## Core Concepts
* **Roofing Filter:** High-pass plus Super Smoother combination removes low-frequency drift while limiting aliasing.
* **Pearson Autocorrelation:** Computes normalized lag correlation to remove amplitude bias.
* **Fourier Projection:** Sums cosine and sine terms of autocorrelation to approximate spectral energy.
* **Gain Normalization:** Automatic gain control prevents stale peaks from dominating power estimates.
* **Warmup Compensation:** Exponential correction guarantees valid output from the very first bar.
## Implementation Notes
**This is not a strict implementation of the TASC September 2016 specification.** It is a more advanced evolution combining the core 2016 concept with techniques Ehlers introduced later. The fundamental Wiener-Khinchin theorem (power spectral density = Fourier transform of autocorrelation) is correctly implemented, but key implementation details differ:
### Differences from Original 2016 TASC Article
1. **Dominant Cycle Calculation:**
- **2016 TASC:** Uses peak-finding to identify the period with maximum power
- **This Implementation:** Uses Center of Gravity (COG) weighted average over bins where power ≥ 0.5
- **Rationale:** COG provides smoother transitions and reduces susceptibility to noise spikes
2. **Roofing Filter:**
- **2016 TASC:** Simple first-order high-pass filter
- **This Implementation:** Canonical 2-pole high-pass with √2 factor followed by Super Smoother bandpass
- **Formula:** `hp := (1-α/2)²·(p-2p +p ) + 2(1-α)·hp - (1-α)²·hp `
- **Rationale:** Evolved filtering provides better attenuation and phase characteristics
3. **Normalized Power Reporting:**
- **2016 TASC:** Reports peak power across all periods
- **This Implementation:** Reports power specifically at the dominant period
- **Rationale:** Provides more meaningful correlation between dominant cycle strength and normalized power
4. **Automatic Gain Control (AGC):**
- Uses decay factor `K = 10^(-0.15/diff)` where `diff = maxPeriod - minPeriod`
- Ensures K < 1 for proper exponential decay of historical peaks
- Prevents stale peaks from dominating current power estimates
### Performance Characteristics
- **Complexity:** O(N²) where N = (maxPeriod - minPeriod)
- **Implementation:** Uses `var` arrays with native PineScript historical operator ` `
- **Warmup:** Exponential compensation (§2 pattern) ensures valid output from bar 1
### Related Implementations
This refined approach aligns with:
- TradingView TASC 2025.02 implementation by blackcat1402
- Modern Ehlers cycle analysis techniques post-2016
- Evolved filtering methods from *Cycle Analytics for Traders*
The code is mathematically sound and production-ready, representing a refined version of the autocorrelation periodogram concept rather than a literal translation of the 2016 article.
## Common Settings and Parameters
| Parameter | Default | Function | When to Adjust |
|-----------|---------|----------|---------------|
| Min Period | 8 | Lower bound of candidate cycles | Increase to ignore microstructure noise; decrease for scalping. |
| Max Period | 48 | Upper bound of candidate cycles | Increase for swing analysis; decrease for intraday focus. |
| Autocorrelation Length | 3 | Averaging window for Pearson correlation | Set to 0 to match lag, or enlarge for smoother spectra. |
| Enhance Resolution | true | Cubic emphasis to highlight peaks | Disable when a flatter spectrum is desired for diagnostics. |
**Pro Tip:** Keep `(maxPeriod - minPeriod)` ≤ 64 to control $O(n^2)$ inner loops and maintain responsiveness on lower timeframes.
## Calculation and Mathematical Foundation
**Explanation:**
1. Apply roofing filter to `source` using coefficients $\alpha_1$, $a_1$, $b_1$, $c_1$, $c_2$, $c_3$.
2. For each lag $L$ compute Pearson correlation $r_L$ over window $M$ (default $L$).
3. For each period $p$, project onto Fourier basis:
$C_p=\sum_{n=2}^{N} r_n \cos\left(\frac{2\pi n}{p}\right)$ and $S_p=\sum_{n=2}^{N} r_n \sin\left(\frac{2\pi n}{p}\right)$.
4. Power $P_p=C_p^2+S_p^2$, smoothed then normalized via adaptive peak tracking.
5. Dominant cycle $D=\frac{\sum p\,\tilde P_p}{\sum \tilde P_p}$ over bins where $\tilde P_p≥0.5$, warmup-compensated.
**Technical formula:**
```
Step 1: hp_t = ((1-α₁)/2)(src_t - src_{t-1}) + α₁ hp_{t-1}
Step 2: filt_t = c₁(hp_t + hp_{t-1})/2 + c₂ filt_{t-1} + c₃ filt_{t-2}
Step 3: r_L = (M Σxy - Σx Σy) / √
Step 4: P_p = (Σ_{n=2}^{N} r_n cos(2πn/p))² + (Σ_{n=2}^{N} r_n sin(2πn/p))²
Step 5: D = Σ_{p∈Ω} p · ĤP_p / Σ_{p∈Ω} ĤP_p with warmup compensation
```
> 🔍 **Technical Note:** Warmup uses $c = 1 / (1 - (1 - \alpha)^{k})$ to scale early-cycle estimates, preventing low values during initial bars.
## Interpretation Details
- **Primary Dominant Cycle:**
- High $D$ (e.g., > 30) implies slow regime; adaptive MAs should lengthen.
- Low $D$ (e.g., < 15) signals rapid oscillations; shorten lookback windows.
- **Normalized Power:**
- Values > 0.8 indicate strong cycle confidence; consider cyclical strategies.
- Values < 0.3 warn of flat spectra; favor trend or volatility approaches.
- **Regime Shifts:**
- Rapid drop in $D$ alongside rising power often precedes volatility expansion.
- Divergence between $D$ and price swings may highlight upcoming breakouts.
## Limitations and Considerations
- **Spectral Leakage:** Limited lag range can smear peaks during abrupt volatility shifts.
- **O(n²) Segment:** Although constrained (≤ 60 loops), wide period spans increase computation.
- **Stationarity Assumption:** Autocorrelation presumes quasi-stationary cycles; regime changes reduce accuracy.
- **Latency in Noise:** Even with roofing, extremely noisy assets may require higher `avgLength`.
- **Downtrend Bias:** Negative trends may clip high-pass output; ensure preprocessing retains signal.
## References
* Ehlers, J. F. (2016). “Past Market Cycles.” *Technical Analysis of Stocks & Commodities*, 34(9), 52-55.
* Thinkorswim Learning Center. “Ehlers Autocorrelation Periodogram.”
* Fab MacCallini. “autocorrPeriodogram.R.” GitHub repository.
* QuantStrat TradeR Blog. “Autocorrelation Periodogram for Adaptive Lookbacks.”
* TradingView Script by blackcat1402. “Ehlers Autocorrelation Periodogram (Updated).”
