Fibonacci Sequence Grid [BigBeluga]🔵 OVERVIEW
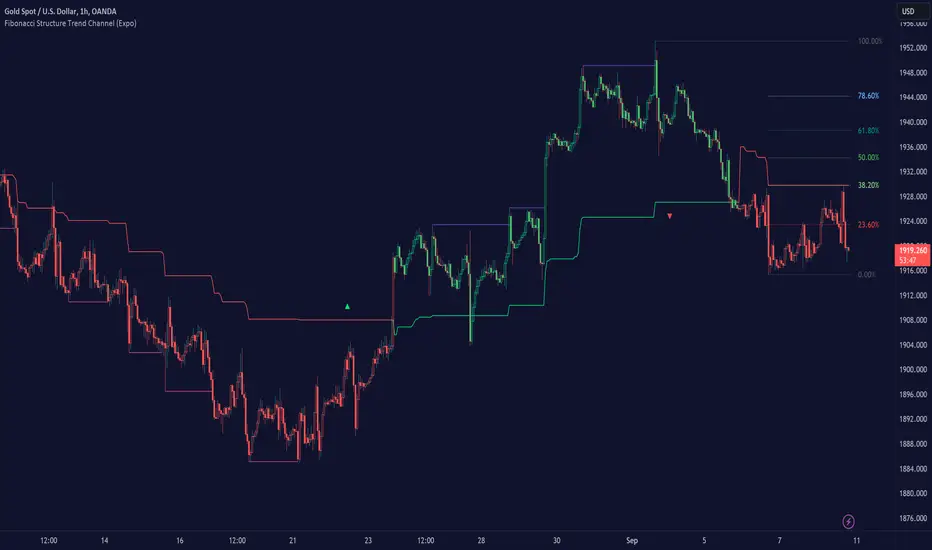
A geometric price mapping tool that projects Fibonacci sequence levels and grid structures from recent price swings to help traders visualize natural expansion and reversion zones.
This indicator overlays Fibonacci-based structures directly on the chart, utilizing both grid projections and horizontal levels based on the classic Fibonacci integer sequence (0, 1, 1, 2, 3, 5, 8, ...). It identifies recent swing highs or lows and builds precision-aligned levels based on the trend direction.
🔵 CONCEPTS
Uses the Fibonacci integer sequence (not ratios) to define distances from the most recent swing point.
Identifies a trend based on EMA cross of fast and slow periods.
Projects two types of Fibonacci tools:
A grid projection from the swing point, displaying multiple sloped levels based on the sequence.
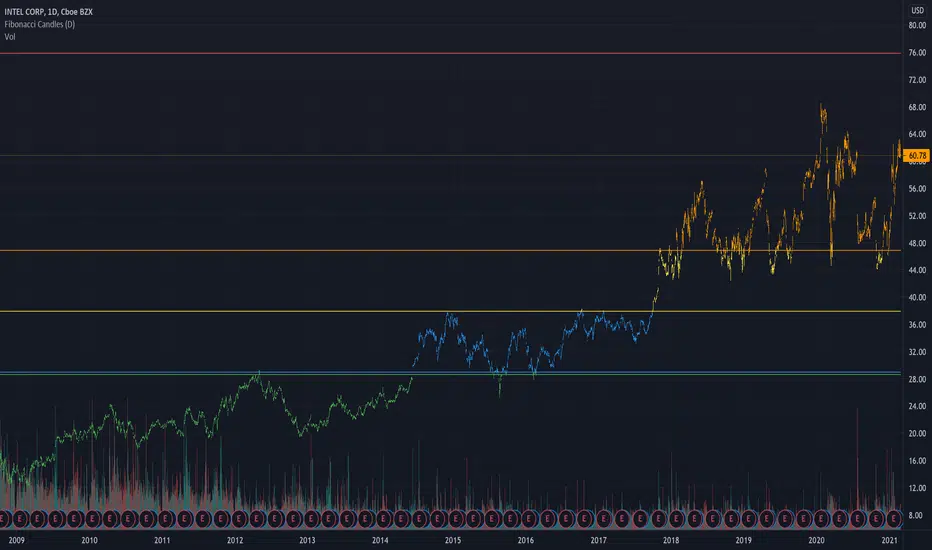
A set of horizontal Fibonacci levels for clean structural references.
Levels can be plotted from either swing low or high depending on the current trend direction.
Adjustable “Size” inputs control spacing between levels for better price alignment.
Lookback period defines how far the script searches for recent swing extremes.
🔵 FEATURES
Fibonacci Grid Projection:
Draws two mirrored Fibonacci grids—one expanding away from the swing high/low, the other converging toward price.
Swing-Based Trend Detection:
Uses a fast/slow EMA crossover to determine trend direction and reference swing points for projections.
Fibonacci Sequence Levels:
Displays horizontal levels based on the Fibonacci number sequence (0, 1, 2, 3, 5, 8, 13, 21...) for natural price targets.
Dynamic Labels and Coloring:
Each level is labeled with its sequence value and colored based on trend direction (e.g., red = downtrend, green = uptrend).
Both grids and levels can be toggled on/off independently.
Sizing controls allow tighter or looser clustering of levels depending on chart scale.
🔵 HOW TO USE
Enable Fibonacci Grid to visualize price expansion zones during impulsive trends.
Use Fibonacci Levels as horizontal support/resistance or target zones.
A label below price means the current trend is up and levels are projected from swing low.
A label above price means trend is down and levels are projected from swing high.
Adjust “Size” input to fit grid/level projection to your preferred chart scale or instrument volatility.
Use in confluence with price action, trend indicators, or volume tools for layered trading decisions.
🔵 CONCLUSION
Fibonacci Sequence Grid reimagines Fibonacci analysis using whole-number spacing from natural math progressions. Whether used for projecting grid-based expansions or horizontal support/resistance zones, it provides a powerful and intuitive structure to trade within. Perfect for traders who rely on symmetry, market geometry, and mathematically consistent levels.
Chỉ báo Pine Script®