Fib OscillatorWhat is Fib Oscillator and How to Use it?
🔶 1. Conceptual Overview
The Fib Oscillator is a Fibonacci-based relative position oscillator.
Instead of measuring momentum (like RSI or MACD), it measures where price currently sits between the recent swing high and swing low, expressed as a percentage within the Fibonacci range.
In other words:
It answers: “Where is price right now within its most recent dynamic range?”
It visualizes retracement and extension zones numerically, providing continuous feedback between 0% and 100% (and beyond if extended).
🔶 2. What the Script Does
The indicator:
Automatically detects recent high and low levels using an adaptive lookback window, which depends on ATR volatility.
Calculates the current price’s position between those levels as a percentage (0–100).
Plots that percentage as an oscillator — showing visually whether price is near the top, middle, or bottom of its recent range.
Overlays Fibonacci retracement levels (23.6%, 38.2%, 50%, 61.8%, 78.6%) as reference zones.
Generates alerts when the oscillator crosses key Fib thresholds — which can signal retracement completion, breakout potential, or pullback exhaustion.
🔶 3. Technical Flow Breakdown
(a) Inputs
Input Description Default Notes
atrLength ATR period used for volatility estimation 14 Used to dynamically tune lookback sensitivity
minLookback Minimum lookback window (candles) 20 Ensures stability even in low volatility
maxLookback Maximum lookback window 100 Limits over-expansion during high volatility
isInverse Inverts chart orientation false Useful for inverse markets (e.g. shorts or inverse BTC view)
(b) Volatility-Adaptive Lookback
Instead of using a fixed lookback, it calculates:
lookback
=
SMA(ATR,10)
/
SMA(Close,10)
×
500
lookback=SMA(ATR,10)/SMA(Close,10)×500
Then it clamps this between minLookback and maxLookback.
This makes the oscillator:
More reactive during high volatility (shorter lookback)
More stable during calm markets (longer lookback)
Essentially, it self-adjusts to market rhythm — you don’t have to constantly tweak lookback manually.
(c) High-Low Reference Points
It takes the highest and lowest points within the dynamic lookback window.
If isInverse = true, it flips the candle logic (useful if viewing inverse instruments like stablecoin pairs or when analyzing bearish setups invertedly).
(d) Oscillator Core
The main oscillator line:
osc
=
(
close
−
low
)
(
high
−
low
)
×
100
osc=
(high−low)
(close−low)
×100
0% = Price is at the lookback low.
100% = Price is at the lookback high.
50% = Midpoint (balanced).
Between Fibonacci percentages (23.6%, 38.2%, 61.8%, etc.), the oscillator indicates retracement stages.
(e) Fibonacci Levels as Reference
It overlays horizontal reference lines at:
0%, 23.6%, 38.2%, 50%, 61.8%, 78.6%, 100%
These act as support/resistance bands in oscillator space.
You can read it similar to how traders use Fibonacci retracements on charts, but compressed into a single line oscillator.
(f) Alerts
The script includes built-in alert conditions for crossovers at each major Fibonacci level.
You can set TradingView alerts such as:
“Oscillator crossed above 61.8%” → possible bullish continuation or breakout.
“Oscillator crossed below 38.2%” → possible pullback or correction starting.
This allows automated monitoring of fib retracement completions without manually drawing fib levels.
🔶 4. How to Use It
🔸 Visual Interpretation
Oscillator Value Zone Market Context
0–23.6% Deep Retracement Potential exhaustion of a down-move / early reversal
23.6–38.2% Shallow retracement zone Possible continuation phase
38.2–50% Mid retracement Neutral or indecisive structure
50–61.8% Key pivot region Common trend resumption zone
61.8–78.6% Late retracement Often “last pullback” area
78.6–100% Near high range Possible overextension / profit-taking
>100% Range breakout New leg formation / expansion
🔸 Practical Application Steps
Load the indicator on your chart (set overlay = false, so it’s below the main price chart).
Observe oscillator position relative to fib bands:
Use it to determine retracement depth.
Combine with structure tools:
Trend lines, swing points, or HTF market structure.
Use crossovers for timing:
Crossing above 61.8% in an uptrend often confirms breakout continuation.
Crossing below 38.2% in a downtrend signals renewed downside momentum.
For range markets, oscillator swings between 23.6% and 78.6% can define accumulation/distribution boundaries.
🔶 5. When to Use It
During Retracements: To gauge how deep the pullback has gone.
During Range Markets: To identify relative overbought/oversold positions.
Before Breakouts: Crossovers of 61.8% or 78.6% often precede impulsive moves.
In Multi-Timeframe Contexts:
LTF (15M–1H): Detect intraday retracement exhaustion.
HTF (4H–1D): Confirm major range expansions or key reversal zones.
🔶 6. Ideal Companion Indicators
The Fib Oscillator works best when contextualized with structure, volatility, and trend bias indicators.
Below are optimal pairings:
Companion Indicator Purpose Integration Insight
Market Structure MTF Tool Identify active trend direction Use Fib Oscillator only in trend direction for cleaner signals
EMA Ribbon / Supertrend Trend confirmation Align oscillator crossovers with EMA bias
ATR Bands / Volatility Envelope Validate breakout strength If oscillator >78.6% & ATR rising → valid breakout
Volume Oscillator Confirm retracement strength Volume contraction + oscillator under 38.2% → potential reversal
HTF Fib Retracement Tool Combine LTF oscillator with HTF fib confluence Powerful multi-timeframe setups
RSI or Stochastic Measure momentum relative to position RSI divergence while oscillator near 78.6% → exhaustion clue
🔶 7. Understanding the Settings
Setting Function Practical Impact
ATR Period (14) Controls volatility sampling Higher = smoother lookback adaptation
Min Lookback (20) Smallest window allowed Lower = more reactive but noisier
Max Lookback (100) Largest window allowed Higher = smoother but slower to react
Inverse Candle Chart Flips oscillator vertically Useful when analyzing bearish or inverse scenarios (e.g. short-side fib mapping)
Recommended Configs:
For scalping/intraday: ATR 10–14, lookback 20–50
For swing/position trading: ATR 14–21, lookback 50–100
🔶 8. Example Trade Logic (Practical Use)
Scenario: Uptrend on 4H chart
Oscillator drops to below 38.2% → retracement zone
Price consolidates → oscillator stabilizes
Oscillator crosses above 50% → pullback ending
Entry: Long when oscillator crosses above 61.8%
Exit: Near 78.6–100% zone or upon divergence with RSI
For Short Bias (Inverse Setup):
Enable isInverse = true to visually flip the oscillator (so lows become highs).
Use the same thresholds inversely.
🔶 9. Strengths & Limitations
✅ Strengths
Dynamic, self-adapting to volatility
Quantifies Fib retracement as a continuous function
Compact oscillator view (no clutter on chart)
Works well across all timeframes
Compatible with both trending and ranging markets
⚠️ Limitations
Doesn’t define trend direction — must be used with structure filters
Can whipsaw during choppy consolidations
The “lookback auto-adjust” may lag in sudden volatility shifts
Shouldn’t be used standalone for entries without structural confluence
🔶 10. Summary
The “Fib Oscillator” is a dynamic Fibonacci-relative positioning tool that merges retracement theory with adaptive volatility logic.
It gives traders an intuitive, quantified view of where price sits within its recent fib range, allowing anticipation of pullbacks, reversals, or breakout momentum.
Think of it as a "Fibonacci RSI", but instead of momentum strength, it shows positional depth — the vibrational location of price within its natural swing cycle.
Fibonaccitrading

CNagda Anchor2EntryCNagda Anchor2Entry Pine Script v6 overlay indicator pulls higher-timeframe (HTF) signal events to define anchor high/low levels and then projects visual entry labels on the lower-timeframe (LTF). It also draws auto-oriented Fibonacci retracement/extension levels for context, but it does not execute orders, stops, or targets—only visual guidance.
Inputs
Key inputs include Lookback Length for HTF scanning and a Signal Timeframe used with request.security to import HTF events onto the active chart.
Entry behavior can be set to “Confirm only” or “Wait candle,” trade side can be restricted to Buy/Sell/Both, and individual strategies (Buy WAIT/S1; Sell REV/S1/S2/S3) can be toggled.
HTF logic
The script defines WAIT/BUY setup and confirmation, SELL reversal on breaking the WAIT BUY low, and several volume/candle-based patterns (Sell S1/S2/S3, Buy S1).
It captures the associated highs/lows at those events with ta.valuewhen and imports them via request.security to form anchors (anc_hi/anc_lo) and “new trigger” booleans that gate label creation on the LTF.
Flip entries
When enabled, “Flip entries” generate contrarian labels based on breaking or confirming HTF anchors: crossing above anc_hi can trigger a flip-to-sell label, and crossing below anc_lo can trigger a flip-to-buy label.
The flip mode supports Immediate (on cross) or Confirm (on sustained break) to control how strict the trigger is.
Fibonacci drawing
User-specified Fib levels are parsed from a string, safely converted to floats, and drawn as dotted horizontal lines only when they fall inside an approximate visible viewport. Orientation (up or down) is decided automatically from pending signal direction and a simple context score (candle bias, trend, and price vs. mid), with efficient redraw/clear guards to avoid clutter.
Dynamic anchors
If HTF anchors are missing or too far from current price (checked with an ATR-based threshold), the script falls back to local swing highs/lows to keep the reference range relevant. This dynamic switch helps Fib levels and labels remain close to current market structure without manual intervention.
Signal labels
Labels are created only on confirmed bars to avoid repainting noise, with one “latest” label kept by deleting the previous one. The script places BUY/SELL labels for WAIT/CONFIRM, direct HTF patterns (Buy S1, Sell S1/S2/S3), and contrarian flip events, offset slightly from highs/lows with clear coloring and configurable sizes.
Visual context
Bars are softly colored (lime tint for bullish, orange tint for bearish) for quick context, and everything renders as an overlay on the price chart. Fib labels include a Δ readout (distance from current close), and line extension length, label sizes, and viewport padding are adjustable.
How to use
Set the Signal Timeframe and Lookback Length to establish which HTF structures and ranges will drive the anchors and entry conditions. Choose entry flow (Wait vs Confirm), enable Flip if contrarian triggers are desired, select the trade side, toggle strategies, and customize Fibonacci levels plus dynamic-anchor fallback for practical on-chart guidance.
Notes
This is a visual decision-support tool; it does not place trades, stops, or targets and should be validated on charts before live use. It is written for Pine Script v6 and relies heavily on request.security for HTF-to-LTF transfer of signals and anchors.

BE-Fib Channel 2 Sided Trading█ Overview:
"BE-Fib Channel 2 Sided Trading" indicator is built with the thought of 2 profound setups named "Cup & Handle (C&H)" and "Fibonacci Channel Trading (FCT)" with the context of "day trading" or with a minimum holding period.
█ Similarities, Day Trading Context & Error Patterns:
While the known fact is that both C&H and FCT provide setups with lesser risk with bigger returns, they both share the similar "Base Pattern".
Note: Inverse of the above Image shall switch the setups between long vs short.
Since the indicator is designed for smaller time-frame candles, there may be instances where the "base pattern" does not visually resemble a Cup & Handle (C&H) pattern. However, patterns are validated using pivot points. The points labeled "A" and "C" can be equal or slightly slanted. Settings of the Indicator allows traders a flexibility to control the angle of these points to spot the strategies according to set conditions. Therefore, understanding the nuances of these patterns is crucial for effective decision-making.
█ 2 Sided Edge: FCT suggests to take trade closer to the yellow line to get better RR ratio. this leaves a small chance of doubt as to; what if price is intended to break the Yellow line thereby activating the C&H.
Wait for the confirmation is a Big FOMO with a compromised RR.
Hence, This indicator is designed to handle both the patterns based on the strength, FIFO and pattern occurring delay.
█ How to Use this Indicator:
Step 1: Enable the Show Sample Sensitivity option to understand the angle of yellow line shown in the sample image. By enabling this option, On the last bar you shall see 4 lines being plotted depicting the max angle which is acceptable for both long and short trades.
Note: Angle can be controlled via setting "Sensitivity".
Higher Sensitivity --> Higher Setup identification --> can lead to failed setups due to 2 sided trading.
Lower Sensitivity --> Lower Setup identification --> can increase the changes of being right.
Step 2: Adjust the look back & look forward periods which shall be used for identifying patterns.
Note: Smaller values can lead to more setups being identified but can hamper the performance of the indicator while increasing the chances of failures. larger values identifies more significant setup but leads to more waiting period thereby compromising on the RR.
Step 3: Adjust the Base Range.
Note: Smaller values can lead to more setups being identified but can hamper the performance of the indicator while increasing the chances of failures. larger values identifies more significant setup but leads to more Risk on play.
Step 4: set the Entry level for FCT & Set the SL for Both FCT & C&H and Target Reward ratio for C&H.
█ Features of Indicator & How it works:
1. Patterns are being identified using Pivot Points method.
2. Tracks & validates both the setups simultaneously on every candle and traded one at a time based on FIFO, New setups found in-between, Defined Entry Levels while on wait for the other pattern to get activated.
3. Alerts added for trade events.
4. FCT setups are generally traded with trailed SL level and increasing Target level on every completed bar. while C&H has the standard SL & TP level with no Trail SL option.
DISCLAIMER: No sharing, copying, reselling, modifying, or any other forms of use are authorized for our documents, script / strategy, and the information published with them. This informational planning script / strategy is strictly for individual use and educational purposes only. This is not financial or investment advice. Investments are always made at your own risk and are based on your personal judgement. I am not responsible for any losses you may incur. Please invest wisely.
Happy to receive suggestions and feedback in order to improve the performance of the indicator better.

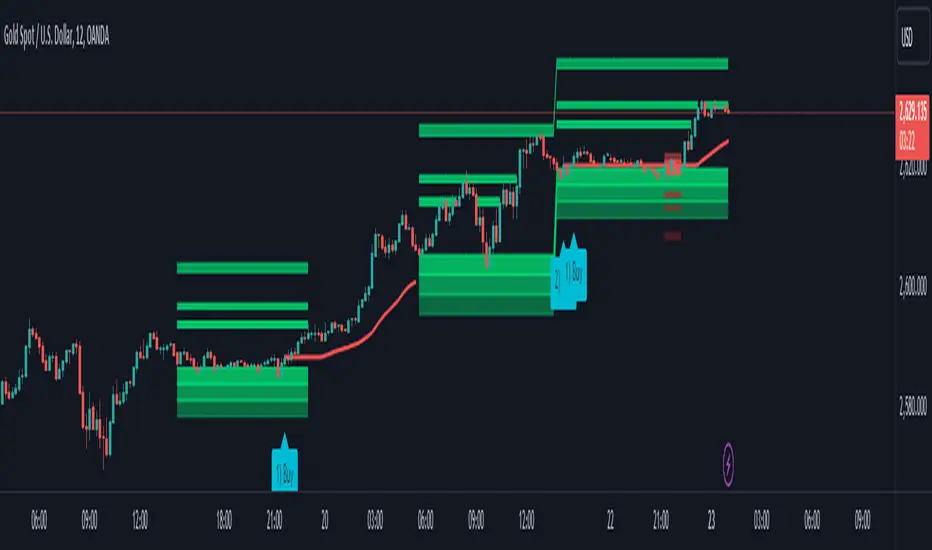
Dynamic Fib Zones [By TraderMan]📊 Dynamic Fib Zones — Indicator Overview
This indicator automatically plots dynamic Fibonacci levels and zones on your chart based on recent price action, volume, and trend direction. It helps you identify key support and resistance areas where price may react strongly.
🔍 What Does It Do?
Draws Fibonacci retracement levels dynamically over a specified lookback period.
Highlights zones around these Fibonacci levels to give you a price “buffer area” instead of just a line.
Colors the zones green or red based on volume strength and trend direction to signal potential buying or selling pressure.
Uses EMA (Exponential Moving Average) to detect if the trend is up or down.
Shows labels with Fibonacci % levels and exact price for quick reference.
⚙️ How to Use It?
Set your inputs:
Fibonacci Period: How many bars back the Fibonacci levels are calculated.
EMA Period: For trend detection.
Volume Multiplier: How much volume should exceed average to consider the signal strong.
Level Tolerance and Zone Width: Adjust the sensitivity and size of the price zones.
Interpret zones:
Green zones with high volume and price near Fibonacci level in an uptrend = potential buying area.
Red zones with high volume and price near Fibonacci level in a downtrend = potential selling area.
Gray zones = neutral, no strong signal.
Make your trading decisions:
Consider entering long positions near green zones with confirmation from other indicators or price action.
Consider entering short positions near red zones similarly.
Use zone boundaries as dynamic support/resistance for stop loss or take profit placement.
🚀 Tips for Position Opening
Combine with other confirmation tools (candlestick patterns, RSI, MACD, etc.) to avoid false signals.
Watch volume spikes carefully; strong volume near a Fibonacci zone increases the reliability.
Use the EMA trend filter to avoid trading against the main trend.
🎯 Summary
Dynamic Fib Zones give you a powerful, visual edge by combining Fibonacci, volume, and trend signals — making your entries and exits smarter and more precise!
Happy Trading! 📈✨

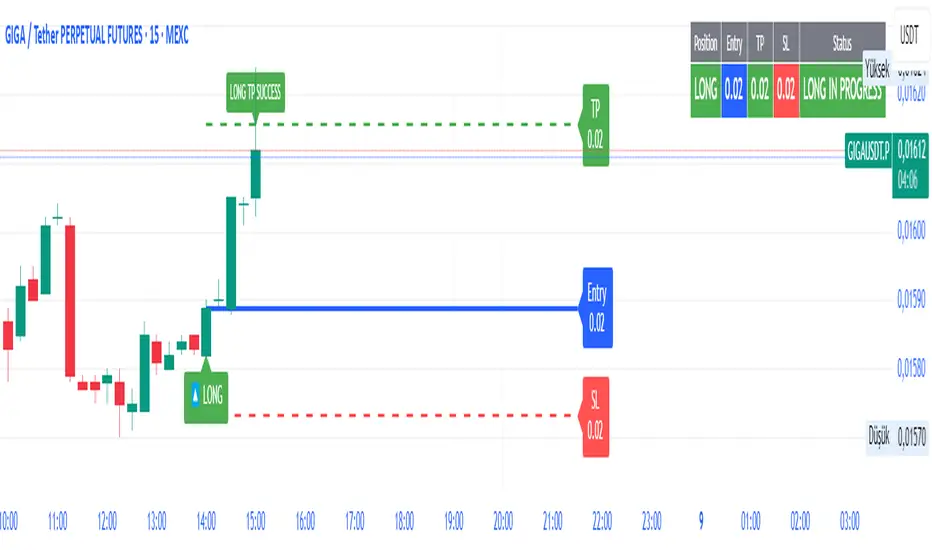
SmartFib Pro [By TraderMan]📊 SmartFib Pro — Smart Fibonacci Support & Resistance + TP/SL + Live Position Tracking
🚀 With SmartFib Pro , automatically track Fibonacci support and resistance levels on your chart!
This indicator dynamically shows long/short entry points, TP (Take Profit), and SL (Stop Loss) levels based on price movements, with easy-to-read lines. You can also monitor your position status live via a table at the top-right of your screen.
⚙️ How It Works?
📈 When price breaks key Fibonacci levels (especially 78.6% and 23.6%), the indicator automatically generates long or short signals.
Entry lines are drawn in blue, TP lines in green, and SL lines in red.
Entry, TP, and SL levels are displayed as labels next to the lines.
Active position lines and labels remain on the chart while the position is open, and past position lines are cleared automatically.
When TP or SL is hit, the indicator instantly notifies on the chart and in the table with “TP SUCCESSFUL” or “STOP HIT.”
🛠️ How to Use?
Add the indicator to your chart.
Adjust Fibonacci high and low lengths (default 50 bars) and line length (default 50 bars) from the inputs.
Long signals are generated when price breaks above the 78.6% level; short signals occur when price breaks below the 23.6% level.
TP is automatically set 3.5% away from the entry line, SL is set 1.5% away.
Follow the blue (entry), green (TP), and red (SL) lines and their labels on the chart.
Monitor your position info live in the top-right table.
When TP or SL triggers, position closes, and lines/labels are cleared for the next signal.
💡 Why SmartFib Pro?
✅ Automated position entry and exit strategy based on Fibonacci levels
✅ Live position tracking and status updates to help your trading decisions
✅ Clear, colorful, and minimalistic chart visuals eliminate clutter
✅ Ideal for both beginners and pros, providing fast and reliable signals
📣 Important Notes:
This indicator generates signals but always use proper risk management according to market conditions!
You can adjust TP/SL percentages to fit your own risk tolerance.
Always support signals with your own analysis.
💬 Catch the trend, manage your risk, and grow your profits with SmartFib Pro!
📈🔵🟢🔴
🔁 A.X.I.S Fibonacci Engine V2 – Smart Projected Pathway🔁 A.X.I.S Fibonacci Engine V2 – Smart Projected Pathway indicator
The A.X.I.S Fibonacci Engine V2 is a next-generation Fibonacci projection tool designed for traders seeking advanced, adaptive levels that respond to true multi-timeframe market structure. Built from the ground up for active traders—scalpers, swing traders, and position players—it fuses traditional Fibonacci logic with dynamic price projection and smart anchor logic.
How It Works:
Multi-Timeframe Anchoring:
Anchors your Fibonacci levels to High Timeframe (HTF) pivots for powerful bias and “macro” market structure, while also utilizing Low Timeframe (LTF) swing detection for precise “micro” projection and pathway analysis.
Dynamic Pathway Projection:
Beyond static lines, this engine allows Fibonacci levels to be projected forward, following the price path between significant swings—giving you projected targets and active “pathways” instead of just fixed retracement bands.
Trend-Adaptive Logic:
Determines bullish/bearish bias based on where HTF price closes relative to a moving average (HTF EMA-20), meaning the plotted fibs automatically adjust to uptrends or downtrends. No need to guess direction.
Auto-Cleanup & Smart Management:
Old lines and labels are deleted automatically to keep your chart clean, and levels are recalculated with every new significant swing (“leg”)—no manual intervention needed.
Key Features:
Multi-Timeframe Input:
Choose both HTF (for “anchor” pivots) and LTF (for “projection” pivots) independently.
Fine-tune swing sensitivity for both anchors and pathway pivots.
Classic + Projected Mode:
Choose between standard horizontal Fibs or enable Dynamic Pathway Mode to project levels diagonally into future bars, creating “fib pathways.”
Color Customization:
Individualize bullish/bearish fib colors, line style (solid, dashed, dotted), thickness, label position, and transparency.
Special “golden zone” highlighting for the most critical levels (0.618/0.786).
Visual Anchors:
Optionally plot markers for HTF swing pivots for extra clarity.
Chart Cleanliness:
Script manages and deletes its own objects—no more chart clutter!
Real-Time Auto-Update:
All levels and pathways update in real time as market structure changes.
User-Friendly Labels:
Toggle on/off fib level labels, with position and background adjustments.
Practical Trading Applications:
Swing/Position Trading:
Use HTF pivots for macro context, then project LTF fibs into the future for potential reversal/extension targets.
Scalping:
Deploy on lower timeframes with micro pivots for intraday levels and short-term projected moves.
Dynamic Take-Profit & Entry Zones:
Identify evolving TP and re-entry zones as price carves out new swings, even in choppy or trending conditions.
Trend Confirmation:
Let the engine determine trend direction, so your fibs are always aligned with prevailing momentum.
How to Use:
Add to Chart:
Apply the indicator to any chart or timeframe.
Set Your Anchors:
Pick the HTF (anchor) and LTF (projection) timeframes.
Adjust swing sensitivity (lookback) as needed.
Enable/Disable Dynamic Pathway:
For regular fibs, leave off.
For projected “pathways,” turn it ON—lines will project forward along the likely path of the next move.
Adjust Colors, Labels, and Styles:
Fine-tune everything for clarity and your personal style.
Watch for Changes:
As new pivots form, the script will update levels in real time, keeping your roadmap fresh.
(Optional) Show Macro Swings:
Toggle on/off to plot markers for the most recent HTF pivots.
Who Is It For?
Day traders, scalpers, and swing traders wanting true projected price targets—not just static fibs.
Traders tired of redrawing fibs after every new swing.
Anyone who wants a clean, dynamic, and truly adaptive fib tool that blends macro and micro market structure into one engine.
What Makes It Different?
True multi-timeframe awareness:
Adapts to both macro (HTF) and micro (LTF) structure.
Automatic trend recognition:
Fibs align with price action—no manual flipping.
Projected, not just static:
See where fib levels could land, not just where they were.
Cleanest chart management:
Deletes its own lines and labels on every update—no mess, ever.
Note:
This tool is for educational and informational purposes only. Not financial advice. Always use proper risk management!
Any issues or feature requests? Drop a comment below or reach out!
Happy trading and welcome to the A.X.I.S revolution.
— I5X-Albatross

Smart Directional Fib Zone (Selectable Session)🎯 Overview
This indicator plots a dynamic Fibonacci zone between the 0.5 and 0.618 levels , calculated from the previous day’s price action , and is designed specifically for intraday traders.
It visually highlights key retracement or reaction areas where the market often pauses or reverses.
🔍 How it works
At the start of each day, the script automatically captures:
the previous day’s open (pdo),
high (pdh),
low (pdl),
and close (pdc).
It then determines if the previous day was bullish (Close > Open) or bearish (Close < Open).
Based on that:
If the previous day was bullish, it projects the Fibonacci levels down from the high (typical for expecting retracements).
If bearish, it projects them up from the low.
The two key levels are:
0.5 (50%) retracement / projection
0.618 (61.8%) retracement / projection
A colored zone is plotted between these levels to act as a leading guide for intraday setups.
⏰ Time filtering & session customization
A unique feature is the dynamic session filtering:
By default, the zone is only plotted during active market hours, keeping your chart clean outside trading hours.
The script provides a dropdown selector so you can quickly switch between:
India session (9:15 to 15:30)
Europe session (9:00 to 17:30)
US session (9:30 to 16:00)
Or even define your own custom session times.
This makes it ideal for intraday traders in any region.
🎨 Visual features
The fill zone changes color based on the previous day’s sentiment:
Green zone if the previous day was bullish
Red zone if the previous day was bearish
🚨 Alerts
The script includes an alert condition, so you can easily set up TradingView alerts to notify you when:
Price enters the Fibonacci zone.
This is extremely helpful for catching retracements or reversals without staring at the screen all day.
⚙️ How to use
✅ Works on any intraday timeframe (1 min, 5 min, 15 min, etc.).
✅ Simply add it to your chart, pick your session in the dropdown, and watch the Fibonacci zone automatically adjust to your selected market hours.
Use it as a confluence tool alongside other indicators like VWAP, EMAs, Bollinger Bands, or price action patterns to time entries and exits.
💪 Why this is powerful
This is more than a simple Fib retracement tool:
It dynamically adapts to the previous day’s sentiment, helping you trade in alignment with recent market psychology.
The session filtering ensures your charts are focused only on the periods

Fibonacci Extension Strt StrategyCore Logic and Steps:
Weekly Trend Identification:
Find the last significant Higher High (HH) and Lower Low (LL) or vice-versa on the Weekly timeframe.
Determine if it's an uptrend (HH followed by LL) or a downtrend (LL followed by HH).
Plot a Fibonacci Extension (or Retracement in reverse order) from the swing point determined to the other significant swing point.
Weekly Retracement Levels:
Display horizontal lines at the 0.236, 0.382, and 0.5 Fibonacci levels from the weekly extension.
Monitor price action on these levels.
Daily Confirmation:
When price hits the Fib levels, examine the Daily chart.
Look for a rejection wick (indicating the pull back is ending) on the identified weekly retracement levels.
Confirm that the price is indeed starting to continue in the direction of the original weekly trend.
Four-Hour Entry:
On the 4H timeframe, plot a new Fib Extension in the opposite direction of the weekly.
If it's an uptrend, the Fib is plotted from last swing low to its swing high. If the weekly trend was bearish the Fib will be plotted from last swing high to the swing low.
Generate an entry when price breaks the high of that candle.
Trade Management:
Entry is on the breakout of the current candle.
Stop Loss: Place the stop loss below the wick of the breakout candle.
Take Profit 1: Close 50% of the position at the 0.5 Fibonacci level. Move the stop loss to breakeven on this position.
Take Profit 2: Close another 25% of the position at the 0.236 Fib level.
Trailing Take Profit: Keep the last 25% open, using a trailing stop loss. (You'll need to define the logic for the trailing stop, e.g., trailing stop using the last high/low)
How to Use in TradingView:
Open a TradingView Chart.
Click on "Pine Editor" at the bottom.
Copy and paste the corrected Pine Script code.
Click "Add to Chart".
The indicator should now be displayed on your chart.

xBrat SlingshotThe xBrat Slingshot Software is designed to identify measured Pull Backs during trends. The Software then identifies two different types of “with trend” trading signals and 1 “trend failure” signal (discussed further down the logic explanation). It is important to know that every pullback is NOT tradeable and a strong set of rules/logic must be used consistently to first measure the pullback. Then a set of repeatable rules/logic is used to identify trading signals when that pullback has found support or resistance within those measured pullback zones. The xBrat Slingshot Software does this all automatically using the following logic.
Long trade
If False Breakout Stochastics (Stoch) closes below 20%, and then closes above 80%, identify a swing low as the lowest price reached since the close below 20%.
When Stoch then closes back down below N%, the algorithm will identify a swing high as the highest price reached since the close above 80.
Behind the chart the software draws a fib retracement from swing low to swing high.
If price ever closed below the 61.8 at any time between the swing high bar and the bar that closed below N%, the software cancels the setup (and undraws pullback zone visuals).
Otherwise our software draws pullback zones at the following fib percentages that are commonly used when measuring pullbacks against a trend.
Pullback zone 1: 23.6-38.2 (default green, light opacity)
Pullback zone 2: 38.2-50 (default green, medium opacity)
Pullback zone 3: 50-61.8 (default green, dark opacity)
If price enters (either closes inside of or touches) a pullback zone and then closes above it without ever closing past (below) it, the setup is confirmed and fib extension targets are drawn (distance from high swing to end of the pullback, extended from the end of the pullback):
Target zone 1: 110-127 (default green, light opacity)
Target zone 2: 161-176 (default green, medium opacity)
Target zone 3: 262-286 (default green, dark opacity)
If price closes past (below) Pullback zone 3 before the setup is confirmed, cancel the setup (and undraw visuals).
Once target zones are drawn, the setup is confirmed and never undrawn.
Short trade
Reverse of the above long trade logic.
Pullback confirmation value: N%
Default zone colour: Red
Once the pullback zone is identified and sufficient initial Support or Resistance occurs within the pullback zones, they are locked along with the target Target Zones for the current move.
Then further confluences are used with our proprietary logic to identify 3 types of Trading Signals. Just because we have a pullback during a trend, doesn't mean we are going to get straight back to the trend. We have identified 2 special sets of confluences that occur in a predefined order to ensure the trend is being returned to with momentum.
These are the Type 1 and Type 2 Trading Signals Below. Then we have another set of circumstances/confluence for when a Trend Fails and traders need to be able to trade these. This is the 3rd type of Trade, a Type 3 below.
Type 1 Trade Signals - Trend Continuation - The following MUST occur within the 3 pullback zones. This signal uses Crosses of Fast and Slow EMA’s which denote the switch back for slingshot and the trend to resume in its original direction after a measured pullback. Then we apply our proprietary EMA cloud for moving out of the pull back zones as a final confirmation for the signal to be Printed.
Type 1 Buy Signals: Fast EMA (default period N, displacement 0) closes below the slow EMA (default period N, displacement N) while in a green pullback zone, and then the fast EMA closes back above the slow EMA without price ever breaking below the last pullback zone (green zones must still be printing). Draw a horizontal line N ticks for entry above the close of the confirmation bar and extend until the lower EMA cloud line breaks it – at which point the lower EMA cloud line is shown as trailing stop
Type 1 Sell Signals: Fast EMA (default period N, displacement 0) closes above the slow EMA (default period N, displacement N) while in a red pullback zone, and then the fast EMA closes back below the slow EMA without price ever breaking above the last pullback zone (red zones must still be printing). Draw a horizontal line N ticks below the close of the confirmation bar and extend until the upper EMA cloud line breaks it – at which point the upper EMA cloud line is shown as trailing stop.
These are the most common of the trading signals when price action follows all of our standard logic rules for a pullback and starts to return in the direction of the main trend after the measured pullback. The highest probability move is to Target 2.
Type 2 Trades - Trend Continuation - For this signal type the Fast and Slow EMA’s DO NOT Cross. BUT price action has to Enter our proprietary EMA cloud and close in the cloud. Then on a set “N” bars must move back out and close outside of the EMA Cloud back in the direction of the original trend. Again, All this must be done within the Pull back Zones.
Type 2 Buy Signal: A bar closes below the upper cloud line while in a green pullback zone, and then within N bars, a bar closes above the upper cloud line without ever breaking below the last pullback zone or the lower EMA Cloud line (green zones must still be printing). Draw a horizontal line N ticks above the close of this bar and extend until the lower EMA cloud line breaks it – at which point the lower EMA cloud line is shown as trailing stop.
Type 2 Sell Signal: A bar closes above the lower cloud line while in a red pullback zone, and then within N bars, a bar closes below the lower cloud line without ever breaking above the last pullback zone or upper EMA cloud line (red zones must still be printing). Draw a horizontal line N ticks below the close of this bar and extend until the upper cloud line breaks it – at which point the upper cloud line is shown as trailing stop.
These are Shallow pullbacks, but still hit the pullback zones. The price action in this instance returns to the direction of the main trend more quickly but still follows a different set of rules to that of Type 1 trades. The Highest Probability move is to target Two
Type 3 Trades - Trend failure - These are trend failure signals where the pullback zones are printed but the price action does not return to the main trend, BUT breaks the third pullback zone and breaks the slingshot rules for a Trend following trade setup. Our proprietary EMA Cloud positioning is then used to confirm and print the signal once the leading edge( direction dependent) moves out of the last pullback zone and we get a candle close with “N” percentage of the pull backs zone's depth.
Type 3 Buy Signal: A bar closes above the highest red pullback zone without pricing previously having ever touched the first red target zone for previous short with trend move. Draw a horizontal line N ticks above the close of the bar that broke the last zone and extend until the lower cloud line breaks it – at which point the lower cloud line is shown as a trailing stop.
Type 3 Sell Signal: A bar closes below the lowest green pullback zone without pricing having ever touched the previous first green target zone for previous long with trend move. Draw a horizontal line N ticks below the close of the bar that broke the last zone and extend until the upper cloud line breaks it – at which point the upper cloud line is shown as a trailing stop.
The Trailing Stop Line is also printed to help with trade management of these 3 different types of trades. This EMA trailing stop is adjustable.
This strategy is designed for Scalping, Day Trading and even Swing Trading. Works with Forex, Crypto, Futures and Stocks.
Logarithmic and Linear Fibonacci LevelsIntroduction
Fibonacci levels are a technical analysis tool used by some traders to identify potential support and resistance levels. The principle for determining these levels is to take the distance between selected reference high and low points (swing high and swing low in general) as 1 unit and mark the ratios derived from the Fibonacci sequence, such as 0.236, 0.382, 0.618, etc., over this 1 unit. In the conventional method of level determination, the 1 unit is divided into equal distances within itself, and Fibonacci levels are determined based on these equal distances. These types of levels are called Linear Levels . A relatively less common method involves dividing the 1 unit into progressively smaller, more accurately described as proportionally equal, distances and determining Fibonacci levels based on these distances. These types are called Logarithmic Levels . The purpose of this indicator is to provide ease of use in determining both Linear and Logarithmic levels.
Where can it be Used?
Logarithmic Levels can be used in any instrument where volatility is high for any reason. Specifically in crypto, Logarithmic Levels work very well for BINANCE:BTCUSDT (to observe this, please study the wick from January 23, 2024). As another example, Logarithmic Levels can be used to identify potential accumulation and distribution schemes in altcoins with relatively high volume and market capitalization (refer to the chart provided above BINANCE:FETUSDT ). Additionally, when analyzing traditional markets, Logarithmic Levels can be beneficial for stocks with highly inflated or deflated prices (e.g., NASDAQ:TSLA , NASDAQ:NVDA ), in stock markets of countries battling high inflation (e.g., BIST:XU100 ), or in currency pairs of countries experiencing a recession (e.g., FX_IDC:JPYUSD ).
How can it be Used?
It is designed similarly to the Fibonacci Tool provided by Trading View to ensure users feel familiar with it. When you start the indicator, select the reference levels (Level 1 and Level 0), then click on the indicator settings to choose specific levels and customize them according to your preferences.
What Makes it Unique?
Indeed, in the Fibonacci Tool provided by Trading View, we can see both linear and logarithmic levels. However, to view logarithmic levels, it is necessary to switch the relevant instrument's Super Chart to a logarithmic scale. This causes the levels we want to remain 'linear' to also be displayed in their logarithmic form, potentially leading to errors in other indicators we use, incorrect functioning of trend lines drawn in linear scaling, and so on. Additionally, when the Super Chart is scaled logarithmically, it prevents the ability to set alerts for prices and trend lines. This indicator was created to avoid these problems without needing to change the chart's scaling method and to allow the simultaneous viewing of both Linear and Logarithmic levels.

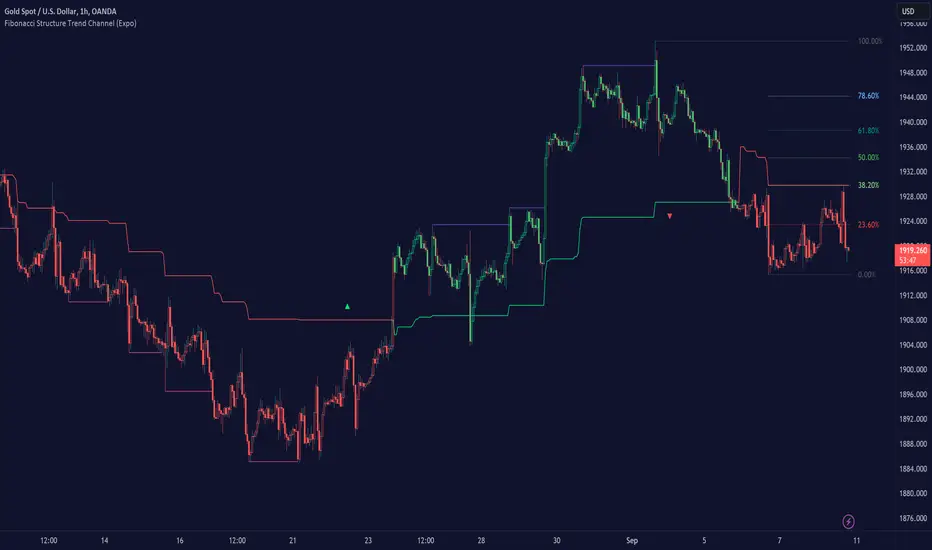
Fibonacci Structure & Trend Channel (Expo)█ Overview
The Fibonacci Structure & Trend Channel (Expo) is designed to identify trend direction and potential reversal levels and offer insights into price structure based on Fibonacci ratios. The algorithm plots a Fibonacci channel, making it easier for traders to identify potential retracement points. Additionally, the Fibonacci market structure is plotted to enhance traders' understanding of the underlying order flow.
█ How to Use
Identify Trends
Use the plotted Fibonacci Trend Line to identify the direction of the market trend. A green line typically signifies a bullish trend, while a red line signifies a bearish trend.
Retracement Levels
The plotted Fibonacci levels can act as potential support or resistance levels. Look for price action signs at these levels for entry or exit points.
Channel Trading
If you enable the Fibonacci channel, the upper and lower bounds can act as overbought or oversold levels.
Market Structure
The plotted Fibonacci market structure serves as a valuable tool for dissecting the underlying order flow and gauging the strength or weakness of a trend. By analyzing these structures, traders can identify key levels where supply and demand intersect, which often act as pivotal points for trend reversals or accelerations. This visual representation simplifies complex market dynamics. Whether you're looking to catch a new trend early or seeking confirmation for a potential reversal, understanding the market structure plotted by the Fibonacci ratios can provide actionable insights for various trading strategies.
Use the Table
The information table can provide quick insights into the current trend and when it started.
█ Settings
The Fibonacci settings allow traders to specify the Fibonacci retracement levels that will be used to calculate the trend and its channel.
The Fibonacci Structure Trend Channel structure settings enable traders to fine-tune how the indicator identifies and plots the underlying price structure.
-----------------
Disclaimer
The information contained in my Scripts/Indicators/Ideas/Algos/Systems does not constitute financial advice or a solicitation to buy or sell any securities of any type. I will not accept liability for any loss or damage, including without limitation any loss of profit, which may arise directly or indirectly from the use of or reliance on such information.
All investments involve risk, and the past performance of a security, industry, sector, market, financial product, trading strategy, backtest, or individual's trading does not guarantee future results or returns. Investors are fully responsible for any investment decisions they make. Such decisions should be based solely on an evaluation of their financial circumstances, investment objectives, risk tolerance, and liquidity needs.
My Scripts/Indicators/Ideas/Algos/Systems are only for educational purposes!
Fibonacci compressionThis script will search x-bars back, if it can find a triangle formation that meets certain Fibonacci ratios.
Based on the trend-based fib extension tool from the first high to the first low and then the 2nd high (in a bullish structure, inverse for bearish), we can predict the take profit levels.
The main target is the 0.618, first take profit is at the 0.236. In a strong trend, one can aim for the 1 fib ratio.
Once the 3 points are known, the script will already plot the take profit levels. It is better to wait until the full pattern develops with a 2nd lower high and a 2nd higher low.
The way I use it, is closing 20% at TP1, 80% of the remainder at TP2 and final close out at TP3.
Stop loss is the red line which will show up after a full pattern is formed.
Plot out the profit levels with the trend based fib extension tool, because once there's a break-out of the pattern, the script won't show the compression any more. (or use the replay button to go back in time to plot it again)
The volume label will appear once there's a divergence between the low and higher low or the high and lower high. It is based on my cumulative volume script. It only works well on timeframes above 4 hour, but volume in favor of a short, doesn't always guarantee a good short setup, so don't take it for granted.
It has around a 30 - 33% chance of hitting your TP2, so make sure the risk to reward is at least 3.
Happy trading!

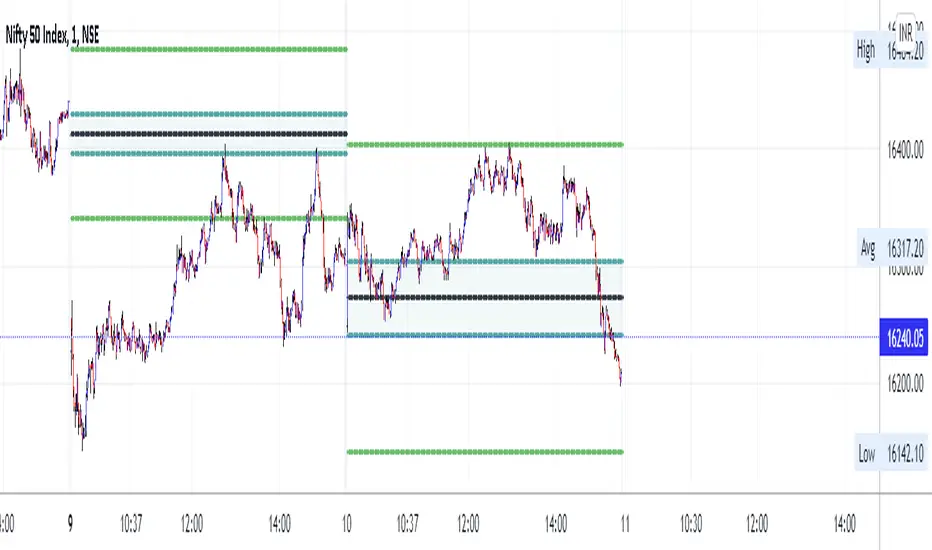
LA_Periodic_Fibonacci LevelsThis indicator is used to plot the previous high and low of the chosen timeframe along with the Fibonacci levels of 0.50, +/- 0.618 and +/- 0.786.
Provision is given to plot levels for three different time frames at a time.
Options are given to select/unselect the levels as per the user requirement. For plotting the Fibonacci levels of a specific period, user has to select the option "TF1_Fib" or "TF2_Fib" or "TF3_Fib" along with the respective levels (50, +/- 0.618, +/- 0.786).
User has to add different time frames in their layout which can then be used in the drop down menu. By default, daily, weekly and monthly time frames are given.
Indicator is plotted as the candle progresses and not plotted for future time frames in advance.
Below are few examples on larger timeframes.
BTCUSD on 1 min TF (timeframe)
BTCUSD on Daily TF
DJI on Daily TF
Simple Fibonacci Candles + LevelsThis is a simpler alternative to the auto-fibonacci indicators. Calculates the fibonacci levels based on the all-time high and all-time low prices. Candles are then colored based on the current closing price's relation to the 5 levels.
Fibonacci Disciples Auto Levels (ES/NQ/GC/NQ WIDE) - APPROVEDPVTEvery Index, every ETF , every sector started somewhere.
That starting point defines Zones that follow that Index, or ETF forever.
What i am saying is - everything you are trading has a pre-defined range of movement that was established when the stock Index became available to the market.
It is this range that defines specific levels that will always play a significant part in the movement of that stock, or Index for its entire lifespan.
This script will automatically multiply that original price range to the stock or index’s current real time value using Fibonacci sequence and a proprietary pre-calculated Fibonacci formula to draw custom Golden Ratios on your chart in real-time. Each gold line represents a new “Golden Ratio” that is, or has already emerged as price moves up and down.
This phenomenon becomes possible by sealing the gaps between Fibonacci Fractal retracements making each gold line a measured .618:1.618 Golden Ratio.
Having these unique Golden Ratios displayed automatically on your chart allows you as the Trader to always have a price target in mind rather than having to guess where price might be headed on a naked chart.
From there you are welcome to add your favorite moving average or any other tool you wish to help determine the overall direction of the trend whilst using these Golden Ratio targets for scalping opportunities. If you do not know how to identify fractal W’s and M’s may I suggest you utilize a public Williams Fractal tool to accompany this indicator script.
Due to the scalping nature of this tool it will be best used on all time frames from 1min up to 4hrs.
Each measured line is customizable to your liking. If you wish to see less you can unclick individual measurements. I suggest leaving the “Baseline” and each “.618%” line active.
You can also change the color of the lines if you wish.
If you would like access to this script you can either DM me on TradingView
