Perfect Price-Anchored % Fib Grid This indicator generates support and resistance levels anchored to a fixed price of your choice.
You can also specify a percentage for the indicator to calculate potential highs and lows.
Commonly used values are 3.5% or 7%, as well as smaller decimal versions like 0.35% or 0.7%, depending on the volatility you expect.
In addition, the indicator can highlight potential stop-run levels in multiples of 27 — ranging from 0 up to 243. This automatically places the 243 GB range directly onto your chart.
The tool is versatile and can be applied not only to equities, but also to ES futures and Forex markets.
Goldbach

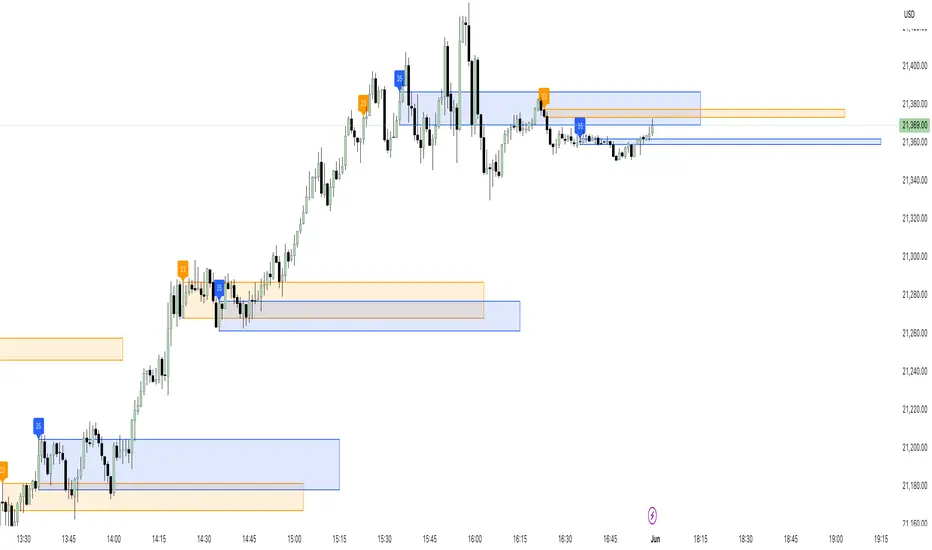
23/35 SR Channels (Hitchhikers Guide To Goldbach)This indicator highlights potential short-term support and resistance zones based on the 23rd and 35th minute of each hour. At each of these time points, it draws a zone from the high to the low of the candle, extending it forward for a fixed number of bars.
Key features:
🔸 Orange zones mark the 23-minute candle
🔹 Blue zones mark the 35-minute candle
📏 Zones extend for a customizable number of bars (channelLength)
🔄 Existing zones are removed if they overlap significantly with a new one
🏷️ Optional labels show when a 23 or 35 zone is created
This tool is ideal for traders looking to identify time-based micro-structures and intraday reaction zones.