DeltaFlow Volume Profile [BigBeluga]🔵 OVERVIEW
The DeltaFlow Volume Profile builds a compact volume profile next to price and enriches every bin with flow context : bullish vs. bearish participation (%), a per-bin Delta % , an optional Delta Heat Map , and a PoC band with the bin’s absolute volume. This lets you see not just where volume clustered, but who (buyers or sellers) dominated inside each price slice.
🔵 CONCEPTS
Binned Volume Profile : Price range over a user-defined LookBack is split into Bins ; each bin aggregates traded volume.
Bull/Bear Split : Within every bin, volume is separated by candle direction into Bull Volume and Bear Volume , then normalized to % of the bin’s displayed size.
Delta % : The difference between Bull % and Bear % for the bin. Positive = buyer dominance; negative = seller dominance.
Delta Heat Map : Bin background shading that scales with both total volume strength and delta bias.
PoC (Point of Control) : The most significant bin gets a PoC band and a label with its absolute volume.
🔵 FEATURES
Profile with Flow : A clean horizontal volume bar per bin plus stacked Bull % and Bear % .
Per-Bin Delta Label : A readable “Δ xx%” tag at the start of each bin shows dominance at a glance.
Delta Heat Map : Optional gradient that intensifies with higher volume and stronger delta.
PoC Highlight : Optional PoC band colored separately, labeled with absolute volume (e.g., “1.23M”).
Configurable Inputs : LookBack, number of Bins (10–100), toggles for Delta, Heat Map, Volume Bars, and PoC color.
Readable Colors : Separate inputs for bullish (volume +) and bearish (volume –) hues.
🔵 HOW TO USE
Set the window : Choose LookBack and Bins to balance detail vs. performance (more bins = finer resolution).
Enable “Volume Bars” to display the bull/bear split as two stacked percent bars inside each bin.
High Bull % near support → constructive demand.
High Bear % near resistance → active supply.
Use Δ labels (toggle “Delta”) to quickly spot bins with clear buyer/seller control; combine with price position for confluence.
Turn on Delta Heat Map to prioritize areas with both large volume and strong imbalance.
Watch the PoC : The PoC band marks the most traded (and often magnet) level; its label shows absolute size for context.
Trade ideas :
Breakout continuation when Δ stays positive across consecutive upper bins.
Reversion risk when price enters a large bearish-Δ cluster below.
Manage risk around the PoC; reactions there can be sharp.
🔵 CONCLUSION
DeltaFlow Volume Profile upgrades a classic profile with flow intelligence. The bull/bear split, explicit Δ %, heat-weighted backdrop, and PoC volume label make dominant participation and key price shelves obvious. Use it to filter levels, time entries with imbalance, and validate breakouts or fades with objective volume-flow evidence.
Heatmap-visualization

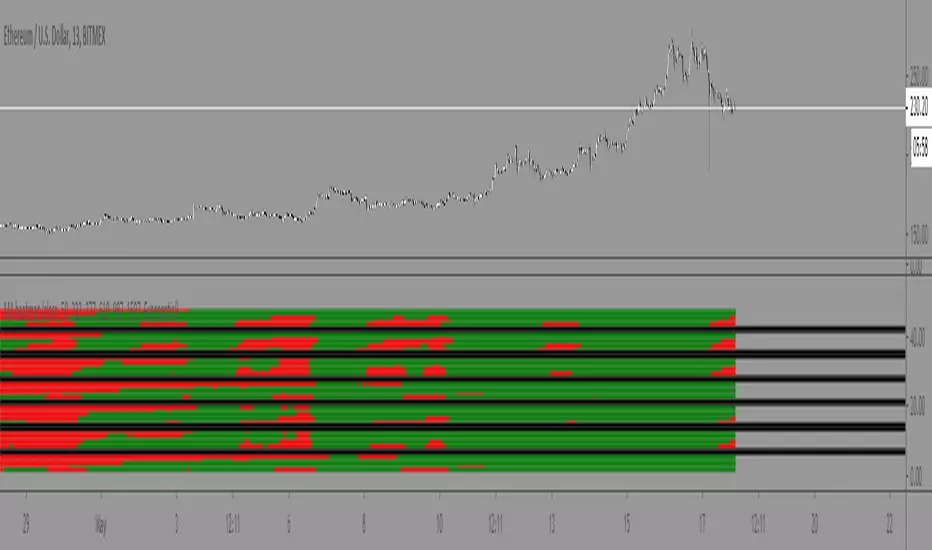
Moving Average Heatmap Visualization7 different types of moving averages (5 different lengths of each) compared to a base moving average. Base moving average can be configured to be a slew of different types of moving averages (credit to @mortdiggiddy for the code) and have a custom length.
Red = base moving average is over other moving average (bearish)
Green = base moving average is under other moving average (bullish)
lengths for the different MAs are just fibonacci numbers due to lack of creativity.
First 5 moving averages are Simple moving average the next 5 are Exponential moving averages and after that it is weighted moving averages, volume weighted moving average (VWAP), Exponential volume weighted moving average (thanks again @mortdiggiddy ), hull moving averages and lastly zero lag moving averages.
The indicator might lag your chart out a bit so be ready for that.
Have fun!