Intraday Uncertainty [PhenLabs]📊 Intraday Uncertainty
Version: PineScript™ v6
📌 Description
The Intraday Uncertainty indicator offers traders a visual representation of market certainty/uncertainty during trading sessions. By comparing each price bar’s range to the Average True Range (ATR), it provides an intuitive way to gauge market conviction through a color gradient system.
This tool helps traders identify periods of high certainty (potentially trending markets) versus high uncertainty (potentially choppy or volatile markets) without complex calculations or multiple indicators. The color-coded bars create an immediate visual cue to support decision-making in varying market conditions.
🚀 Points of Innovation
Automated range-to-ATR ratio calculation that adapts to changing market volatility
Dynamic color gradient system that visually distinguishes between certain and uncertain price action
Customizable gradient clamping to fine-tune sensitivity to market conditions
Integrated dashboard that provides clear interpretation guidance
Position-flexible legend that accommodates different chart layouts
Highly optimized for performance with minimal calculation overhead
🔧 Core Components
ATR Calculation: Measures market volatility using a configurable lookback period
Range-to-ATR Ratio: Compares current bar’s high-low range against average volatility
Gradient Mapping System: Converts numerical uncertainty values into an intuitive color scale
Dashboard Legend: Provides clear interpretation guidance with customizable positioning
🔥 Key Features
Bar Coloring: Instantly identifies market certainty levels through intuitive color gradients
Customizable ATR Period: Adjust sensitivity to historical volatility based on trading style
Gradient Clamping: Fine-tune the color sensitivity using the Range/ATR multiplier
Color Customization: Personalize the color scheme to match your chart aesthetics
Informative Dashboard: Quickly interpret color meanings with the optional on-chart legend
Flexible Display Options: Customize dashboard position and text size for your chart layout
🎨 Visualization
Color Gradient: Bars colored on a spectrum from green (high certainty) to red (high uncertainty)
Dashboard Legend: Optional on-chart guide explaining the color interpretation
Color Intensity: Stronger colors indicate more extreme certainty/uncertainty levels
At-a-glance Interpretation: Quickly identify market conviction without analyzing numbers
📖 Usage Guidelines
Calculation Settings
ATR Period
Default: 14
Range: 1+
Description: Controls the lookback period for ATR calculation. Lower values increase sensitivity to recent volatility, while higher values provide more stability.
Gradient Clamp (Range/ATR Multiplier)
Default: 2.0
Range: 0.1+
Description: Sets the maximum Range/ATR ratio for gradient scaling. Ranges above this value display the end color (high uncertainty).
Color Settings
Gradient Start Color (High Certainty)
Default: Green
Description: Color representing high market certainty (low Range/ATR ratio)
Gradient End Color (Low Certainty)
Default: Red
Description: Color representing low market certainty (high Range/ATR ratio)
Dashboard Settings
Show Dashboard Legend
Default: True
Description: Toggles the visibility of the on-chart interpretation guide
Dashboard Position
Options: top_right, top_left, bottom_right, bottom_left, middle_right, middle_left
Default: bottom_right
Description: Controls the placement of the dashboard on your chart
Dashboard Text Size
Options: tiny, small, normal, large, huge
Default: normal
Description: Adjusts the text size of the dashboard for readability
✅ Best Use Cases
Identifying potential trend shifts when certainty levels change dramatically
Confirming trend strength through consistent certainty levels
Detecting choppy/sideways markets with persistent high uncertainty
Filtering trading signals from other indicators based on certainty levels
Gauging market conviction behind price breakouts or pullbacks
Optimizing entry/exit timing based on certainty/uncertainty transitions
⚠️ Limitations
Does not predict future price direction, only measures current bar certainty
May provide false signals during news events or unexpected volatility spikes
Requires context within the broader market environment for optimal interpretation
Color interpretation is relative rather than absolute across different securities
ATR-based calculation means sensitivity varies across different timeframes
💡 What Makes This Unique
Simplicity: Single visual indicator that doesn’t require multiple technical tools
Adaptability: Automatically adjusts to changing market volatility conditions
Contextual Analysis: Provides market conviction context beyond just price movement
Intuitive Design: Color-based system that requires minimal learning curve
Efficiency: Lightweight calculation that doesn’t impact chart performance
🔬 How It Works
1. ATR Calculation:
Calculates the Average True Range using the specified period
Establishes a baseline for normal market volatility
2. Range Analysis:
Measures each bar’s high-low range
Compares this range to the current ATR value to create a ratio
3. Gradient Mapping:
Converts the Range/ATR ratio to a normalized value between 0 and 1
Maps this value onto a color gradient between the start and end colors
Applies the resulting color to the price bar
4. Dashboard Creation:
Constructs an information panel on the last visible bar
Populates it with color samples and interpretation guidance
💡 Note:
This indicator works best when used in conjunction with other technical analysis tools rather than in isolation. The certainty/uncertainty measure provides context for your trading decisions but should not be the sole basis for entries and exits. Consider using higher certainty periods for trend-following strategies and exercise caution during periods of high uncertainty.
Intraday

Reversal Strength Meter – Adib NooraniThe Reversal Strength Meter is an oscillator designed to identify potential reversal zones based on supply and demand dynamics. It uses smoothed stochastic logic to reduce noise and highlight areas where momentum may be weakening, signaling possible market turning points.
🔹 Smooth, noise-reduced stochastic oscillator
🔹 Custom zones to highlight potential supply and demand imbalances
🔹 Non-repainting, compatible across all timeframes and assets
🔹 Visual-only tool — intended to support discretionary trading decisions
This oscillator assists scalpers and intraday traders in tracking subtle shifts in momentum, helping them identify when a market may be preparing to reverse — always keeping in mind that trading is based on probabilities, not certainties.
📘 How to Use the Indicator Efficiently
For Reversal Trading:
Buy Setup
– When the blue line dips below the 20 level, wait for it to re-enter above 20.
– Look for reversal candlestick patterns (e.g., bullish engulfing, hammer, or morning star).
– Enter above the pattern’s high, with a stop loss below its low.
Sell Setup
– When the blue line rises above the 80 level, wait for it to re-enter below 80.
– Look for bearish candlestick patterns (e.g., bearish engulfing, inverted hammer, or evening star).
– Enter below the pattern’s low, with a stop loss above its high.
🛡 Risk Management Guidelines
Risk only 0.5% of your capital per trade
Book 50% profits at a 1:1 risk-reward ratio
Trail the remaining 50% using price action or other supporting indicators

Reversal Scalping Ribbon - Adib NooraniThe Reversal Scalping Ribbon is a trend-following overlay tool designed to visually identify potential reversal zones based on price extremes and dynamic volatility bands. It calculates adaptive upper and lower bands using price action and custom ATR logic, helping traders quickly assess market direction and possible turning points
🔹 Volatility-adjusted bands based on price highs/lows
🔹 Color-coded ribbons to indicate trend bias and potential reversal shifts
🔹 No repainting, works on all timeframes and assets
🔹 Visual-only display, no trade signals — supports discretion-based entries
This ribbon is designed for scalpers and intraday traders to spot reversal setups with clarity. It enhances your trading by showing real-time market bias without unnecessary distractions. By focusing on probabilities, it helps to improve decision-making in fast-paced environments
How to use the indicator efficiently
For Reversal Trading:
Buy: When price closes below the green ribbon with a red candle, then re-enters with a green candle. Enter above the high of the green candle with a stop loss below the lowest low of the recent green/red candles
Sell: When price closes above the red ribbon with a green candle, then re-enters with a red candle. Enter below the low of the red candle with a stop loss above the highest high of the recent red/green candles
Risk Management:
Limit risk to 0.5% of your capital per trade
Take 50% profit at a 1:1 risk-reward ratio
For the remaining 50%, trail using the lower edge of the green band for buys and the upper edge of the red band for sells

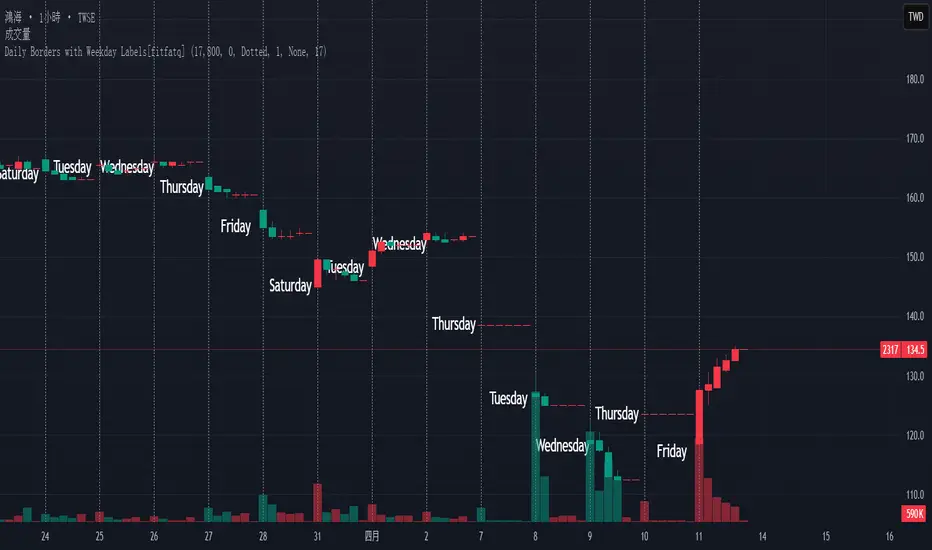
Daily Borders with Weekday Labels[fitfatq]Indicator Overview
This indicator displays daily vertical border lines and the previous day’s weekday label on intraday charts (i.e., charts with a timeframe lower than Daily). It draws a vertical line at the start of each new trading day and places a label displaying the previous day’s weekday (e.g., Monday) at the horizontal midpoint between the previous and the current day. Users can customize various visual aspects such as the separator line style and width, label style, text color, and text size. Additionally, the indicator offers an option to fix the label’s Y coordinate at a specified price level to prevent it from being overlapped by candlesticks.
Parameter Details
Use Fixed Weekday Label Y Coordinate
Type: Boolean
Default: false
Description: When enabled, the weekday label’s vertical position will be fixed at a specified price level (see next parameter). Otherwise, the label’s Y position is determined dynamically (typically based on the current bar’s low minus 3 ticks).
Fixed Weekday Label Y Coordinate (price)
Type: Float
Default: 130.0
Description:
This parameter sets the fixed price level at which the weekday label will be displayed if the "Use Fixed Weekday Label Y Coordinate" option is enabled. Please input a value that corresponds to your chart’s price scale (e.g., 130.50). Note: In charts with high price levels (for example, stocks trading at 3000 or above), it is recommended to set this value to 3000 or above. The higher the value, the closer the label will appear to the candlesticks.
Separator Line Style
Type: String (Options: "Solid", "Dotted", "Dashed")
Default: "Dotted"
Description: Specifies the style of the vertical separator line drawn at the start of each new day. "Solid" displays a continuous line, "Dotted" shows a dotted line, and "Dashed" provides a dashed line.
Separator Line Width
Type: Integer
Default: 1
Description: Determines the thickness of the separator line. A higher number results in a thicker line; the minimum value is 1.
Label Style
Type: String (Options: "None", "Label Up", "Label Down", "Label Left", "Label Right", "Label Center")
Default: "None"
Description: Sets the built-in style for the weekday label. "None" means no background or border (plain text only), while other options apply predefined visual effects.
Text Color
Type: Color
Default: Black
Description: Determines the text color of the weekday label.
Label Text Size
Type: String (Options: "Tiny", "Small", "Normal", "Large", "Huge")
Default: "Normal"
Description: Specifies the text size of the weekday label. Adjust according to preference to ensure the label is readable.
Usage Summary
How It Works:
The indicator detects the start of a new trading day using a change in the daily timeframe (via ta.change(time("D"))). When a new day begins, it draws a vertical separator line at the first bar of that day. If previous day data is available, the indicator calculates the horizontal midpoint between the start of the previous day and the current day and displays the previous day’s weekday label at that position. If the fixed Y coordinate option is enabled, the label is drawn at the specified price level; otherwise, it is positioned relative to the current bar’s low.
Customization:
Users can adjust all visual aspects, including the line style and width as well as the label style, text color, and text size. The fixed Y coordinate option allows the label’s vertical position to remain constant, which helps prevent overlapping with price bars.
Chart Requirement:
This indicator only operates on intraday charts (timeframes lower than Daily) and will not display on Daily or higher timeframe charts.
License
This indicator is released under the Mozilla Public License 2.0. Please credit the original author (fitfatq) when using or sharing this script.
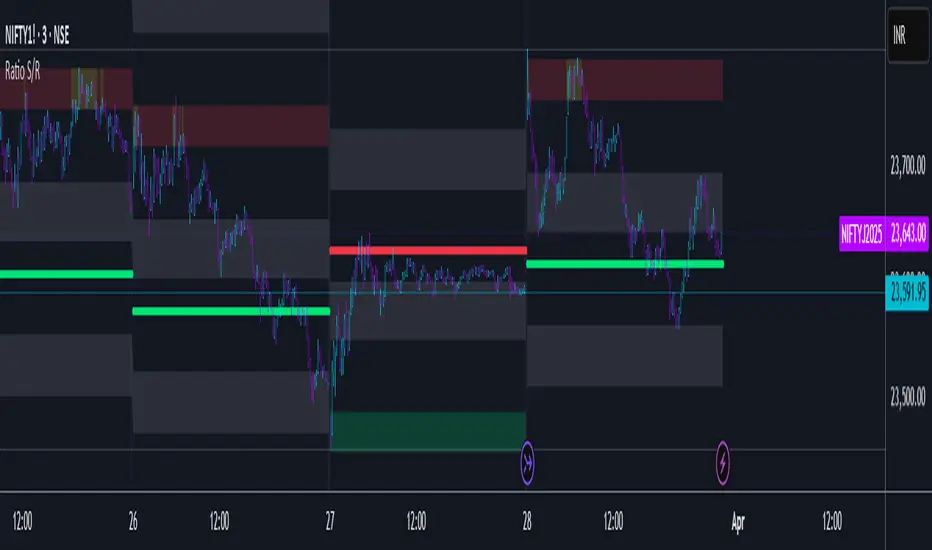
Ratio S/RRatio S/R - Intraday Support & Resistance Levels
Introduction
This script identifies key intraday support and resistance (S/R) levels where price tends to reverse frequently. It is designed specifically for intraday trading and aims to help traders find high-probability reversal zones.
The logic behind the script revolves around logarithmic returns, historical volatility, and ratio-based price levels. The script dynamically calculates price ranges using standard deviation-based volatility and applies preset ratio levels to determine potential support and resistance zones.
How It Works
Dynamic Range Calculation
The script calculates the price range based on the previous day’s logarithmic return volatility.
The range is then used to project different levels of price movement.
Reference Price
You can choose whether the reference price is from today’s open or yesterday’s close (oporcl setting).
This helps adapt the levels based on market behavior.
Ratio-Based Levels
The script applies specific ratios to the calculated range:
0.0833 (Minor Reversal Zone)
0.25 & 0.38 (Primary Reversal Zones)
0.62 & 0.75 (Significant Reversal Zones)
1.0 & 1.25 (Extreme Reversal Zones)
These levels act as potential support and resistance points.
Disclaimer: This is just for educational purpose . Trading is risky activity and how you use this tool is your own responsibility. The publisher of this tool does not make any claims.
Intraday Anchored FanSimilar to an Anchored VWAP, this lets you click a bar on an Intraday chart to add an "Anchored Fan" which displays lines at up to 6 levels above and below the chosen Anchor Point. Useful to measure the retracement during swing moves.
You can reposition the fan by either hovering over the anchor or by clicking the name of the study to "activate" it, and then dragging. You can also change the Anchor Point in Settings.
By default the anchor uses the bar Close, but you can change this manually in settings OR you can use the fancy "Auto high/low" mode which is handy if you are mainly dropping the fan on local swing highs and lows.
The default line measures were chosen for ES (Futures) but the study should be usable with nearly anything as long as you adjust the settings to something appropriate for the ticker. If you want to use this on NQ, for example, it would be reasonable to multiple each of these settings by 3.5 or so.
NOTE: If the fan is off the left side of the chart, one way to see the Anchor handle again easily is to switch to a higher timeframe; for example if you are on the 5min maybe use the 15min or hourly to find the handle -- if it is WAY off the left side (for example if you let many days pass without advancing it) it's generally easiest to use Settings to move it back to "now".

Multi-Timeframe ATR Levels by Hitesh2603Description:
"Multi-Timeframe ATR Levels by Hitesh2603" is a versatile and adaptive indicator designed to help traders identify key price levels based on the Average True Range (ATR) from a higher timeframe. The script automatically adapts to the current chart’s timeframe and allows you to customize the higher timeframe for ATR calculations, making it ideal for intraday and swing trading strategies.
The indicator plots upper and lower price levels based on the ATR multiplier, providing clear visual cues for potential profit-taking or exit points. It also includes features like editable timeframe presets , historical level plotting , labels , and alerts , making it a powerful tool for traders of all experience levels.
---
Key Features:
1. Automatic Timeframe Adaptation : - The script automatically detects the current chart’s timeframe and selects the appropriate higher timeframe for ATR calculations.
2. Editable Preset Timeframe Pairs : - Customize the higher timeframe for each chart timeframe directly in the indicator settings.
3. Dynamic ATR-Based Levels :- Plots upper and lower price levels using the formula:
- Upper Level = Current Candle Open + (Previous Candle ATR * Multiplier)
- Lower Level = Current Candle Open - (Previous Candle ATR * Multiplier)
4. Customizable Inputs :
- Adjust ATR length, multiplier, line length, colors, and more.
5. Labels :
- Displays the exact values of the upper and lower levels for easy reference.
6. Historical Levels :
- Optionally plots historical levels for all candles.
7. Alerts :
- Get notified when the price crosses the upper or lower levels.
---
Use Cases:
1. Intraday Trading :
- Use the script on a 5-minute or 15-minute chart with a 1-hour higher timeframe to identify intraday profit-taking or exit points.
2. Swing Trading :
- Use the script on a 1-hour or 4-hour chart with a daily higher timeframe to identify swing trading opportunities.
3. Position Trading :
- Use the script on a daily chart with a weekly higher timeframe to identify key levels for position trading.
4. Breakout Confirmation :
- Use the upper and lower levels as confirmation points for breakouts or reversals.
5. Risk Management :
- Use the levels to set stop-loss or take-profit targets based on market volatility.
---
How to Use:
1. Add the Script to Your Chart :
- Search for "Multi-Timeframe ATR Levels by Hitesh2603" in the TradingView indicator library and add it to your chart.
2. Customize the Settings :
- Adjust the inputs (e.g., ATR length, multiplier, line length, colors, etc.) to suit your trading strategy.
3. Set the Higher Timeframe :
- The script will automatically display an input for the higher timeframe based on the current chart’s timeframe. Customize it as needed.
4. Interpret the Levels :
- The script will plot two horizontal lines (upper and lower levels) on the chart. Use these levels for profit-taking, exits, or breakout confirmation.
5. Enable Alerts :
- Set up alerts to get notified when the price crosses the upper or lower levels.
---
Input Parameters:
1. ATR Length :
- The period used to calculate the ATR (default: 14).
2. ATR Multiplier :
- The multiplier applied to the ATR to calculate the levels (default: 0.65).
3. Line Length :
- The number of candles to extend the lines (default: 10).
4. Show Labels :
- Toggle to display the exact values of the levels (default: true).
5. Show Historical Levels :
- Toggle to plot historical levels for all candles (default: false).
6. Line Colors :
- Customize the colors of the upper and lower levels.
7. Line Width :
- Adjust the thickness of the lines (default: 2).
---
Example:
- Current Chart : 5-minute
- Higher Timeframe : 1-hour
- Previous Hour’s ATR : 4.6
- Current Hour’s Open : 102
- Multiplier : 0.65
Levels :
- Upper Level = 102 + (4.6 * 0.65) = 105.0
- Lower Level = 102 - (4.6 * 0.65) = 99.0
The script will plot horizontal lines at 105.0 and 99.0 on the 5-minute chart.
---
Alerts:
- Price Crosses Upper Level :
- Triggered when the price crosses above the upper level.
- Price Crosses Lower Level :
- Triggered when the price crosses below the lower level.
---
Notes:
- The script is designed to be flexible and adaptable to various trading styles and timeframes.
- Always backtest and validate the indicator with your trading strategy before using it in live trading.
---
Credits:
- Developed by Hitesh2603 .
- Special thanks to the TradingView community for inspiration and support.

Sideways Scalper Peak and BottomUnderstanding the Indicator
This indicator is designed to identify potential peaks (tops) and bottoms (bottoms) within a market, which can be particularly useful in a sideways or range-bound market where price oscillates between support and resistance levels without a clear trend. Here's how it works:
RSI (Relative Strength Index): Measures the speed and change of price movements to identify overbought (above 70) and oversold (below 30) conditions. In a sideways market, RSI can help signal when the price might be due for a reversal within its range.
Moving Averages (MAs): The Fast MA and Slow MA provide a sense of the short-term and longer-term average price movements. In a sideways market, these can help confirm if the price is at the upper or lower extremes of its range.
Volume Spike: Looks for significant increases in trading volume, which might indicate a stronger move or a potential reversal point when combined with other conditions.
Divergence: RSI divergence occurs when the price makes a new high or low, but the RSI does not, suggesting momentum is weakening, which can be a precursor to a reversal.
How to Use in a Sideways Market
Identify the Range: First, visually identify the upper resistance and lower support levels of the sideways market on your chart. This indicator can help you spot these levels more precisely by signaling potential peaks and bottoms.
Peak Signal :
When to Look: When the price approaches the upper part of the range.
Conditions: The indicator will give a 'Peak' signal when:
RSI is over 70, indicating overbought conditions.
There's bearish divergence (price makes a higher high, but RSI doesn't).
Volume spikes, suggesting strong selling interest.
Price is above both Fast MA and Slow MA, indicating it's at a potentially high point in the range.
Action: This signal suggests that the price might be at or near the top of its range and could reverse downwards. A trader might consider selling or shorting here, expecting the price to move towards the lower part of the range.
Bottom Signal:
When to Look: When the price approaches the lower part of the range.
Conditions: The indicator will give a 'Bottom' signal when:
RSI is below 30, indicating oversold conditions.
There's bullish divergence (price makes a lower low, but RSI doesn't).
Volume spikes, suggesting strong buying interest.
Price is below both Fast MA and Slow MA, indicating it's at a potentially low point in the range.
Action: This signal suggests that the price might be at or near the bottom of its range and could reverse upwards. A trader might consider buying here, expecting the price to move towards the upper part of the range.
Confirmation: In a sideways market, false signals can occur due to the lack of a strong trend. Always look for confirmation:
Volume Confirmation: A significant volume spike can add confidence to the signal.
Price Action: Look for price action like candlestick patterns (e.g., doji, engulfing patterns) that confirm the reversal.
Time Frame: Consider using this indicator on multiple time frames. A signal on a shorter time frame (like 15m or 1h) might be confirmed by similar conditions on a longer time frame (4h or daily).
Risk Management: Since this is designed for scalping in a sideways market:
Set Tight Stop-Losses: Due to the quick nature of reversals in range-bound markets, place stop-losses close to your entry to minimize loss.
Take Profit Levels: Set profit targets near the opposite end of the range or use a trailing stop to capture as much of the move as possible before it reverses again.
Practice: Before trading with real money, practice with this indicator on historical data or in a paper trading environment to understand how it behaves in different sideways market scenarios.
Key Points for New Traders
Patience: Wait for all conditions to align before taking a trade. Sideways markets require patience as the price might hover around these levels for a while.
Not All Signals Are Equal: Sometimes, even with all conditions met, the market might not reverse immediately. Look for additional context or confirmation.
Continuous Learning: Understand that this indicator, like any tool, isn't foolproof. Learn from each trade, whether it's a win or a loss, and adjust your strategy accordingly.
By following these guidelines

Overnight vs Intra-day Performance█ STRATEGY OVERVIEW
The "Overnight vs Intra-day Performance" indicator quantifies price behaviour differences between trading hours and overnight periods. It calculates cumulative returns, compound growth rates, and visualizes performance components across user-defined time windows. Designed for analytical use, it helps identify whether returns are primarily generated during market hours or overnight sessions.
█ USAGE
Use this indicator on Stocks and ETFs to visualise and compare intra-day vs overnight performance
█ KEY FEATURES
Return Segmentation : Separates total returns into overnight (close-to-open) and intraday (open-to-close) components
Growth Tracking : Shows simple cumulative returns and compound annual growth rates (CAGR)
█ VISUALIZATION SYSTEM
1. Time-Series
Overnight Returns (Red)
Intraday Returns (Blue)
Total Returns (White)
2. Summary Table
Displays CAGR
3. Price Chart Labels
Floating annotations showing absolute returns and CAGR
Color-coded to match plot series
█ PURPOSE
Quantify market behaviour disparities between active trading sessions and overnight positioning
Provide institutional-grade attribution analysis for returns generation
Enable tactical adjustment of trading schedules based on historical performance patterns
Serve as foundational research for session-specific trading strategies
█ IDEAL USERS
1. Portfolio Managers
Analyse overnight risk exposure across holdings
Optimize execution timing based on return distributions
2. Quantitative Researchers
Study market microstructure through time-segmented returns
Develop alpha models leveraging session-specific anomalies
3. Market Microstructure Analysts
Identify liquidity patterns in overnight vs daytime sessions
Research ETF premium/discount mechanics
4. Day Traders
Align trading hours with highest probability return windows
Avoid overnight gaps through informed position sizing

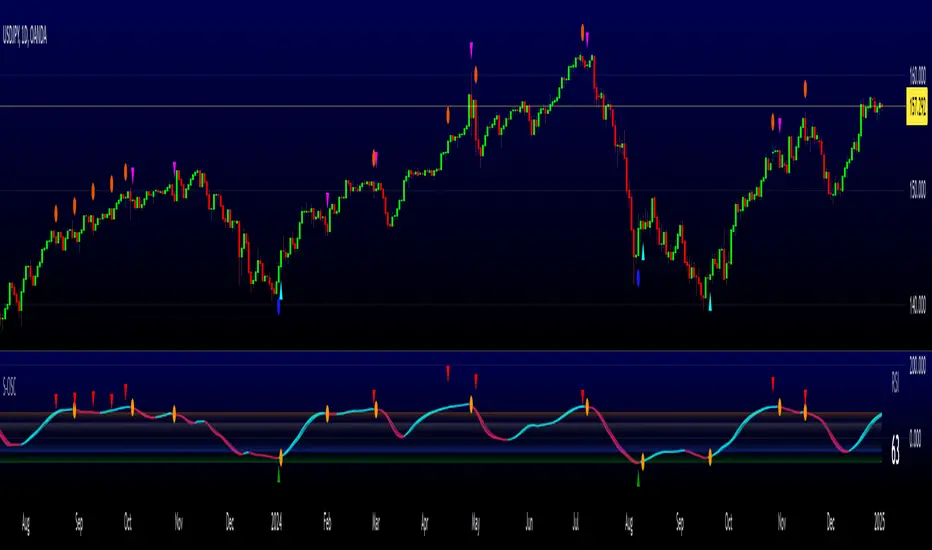
Stochastics Oscillator with Buy/Sell Indicator [iSTAGs]iSTAGs "Stochastics Oscillator" with Buy/Sell Indicator
Overview
The Stochastics Oscillator is a versatile trading indicator designed to provide comprehensive insights into market momentum and potential price reversals. With its multi-layered approach, it incorporates a blend of oscillators, smoothed averages, and relative strength measures to deliver actionable trading signals.
Disclaimer
This indicator is provided for study purposes only . While it may assist in identifying potential buy and sell opportunities, please note:
1. False Signals: The buy/sell indicators may generate false signals. Always validate signals using additional analysis or tools.
2. Trading Strategies: Use appropriate exit points and stop-loss levels as part of your overall trading strategy.
3. No Guarantees: Do not rely solely on this indicator for trading decisions. Market conditions may change, and no indicator guarantees accurate results.
4. Strategy Testing: The strategy associated with this indicator is not tested, and backtesting features are not available at this time.
Key Features
1. Stochastics Oscillator
• Combines the smoothed ranges of price movement to identify overbought and oversold conditions.
• Inbuilt signal lines helps pinpoint potential crossovers for trend reversals.
2. Zones Highlighting
• Clearly visualized zones for:
o Overbought (70–100): Caution for potential reversals.
o Bullish (0–40): Positive momentum.
o Bearish (0 to -40): Negative momentum.
o Oversold (-70 to -100): Potential buying opportunities.
3. Buy and Sell Signals
• Primary Buy/Sell Indicator: Highlighted directly on the chart for ease of use.
• Potential Buy/Sell Signals: Secondary indicators based on advanced crossover conditions that can generate early signals.
4. RSI Integration
• Realtime RSI value display for an additional layer of confirmation.
• Color-coded RSI values to easily interpret market strength:
o Red: Overbought (>80)
o Orange: Strong momentum (70–80)
o White: Neutral (30–70)
o Blue: Weak momentum (20–30)
o Green: Oversold (<20)
5. Limited Customizable Visuals
o Clean and color-coded plots and fills make it intuitive to identify trends and trading opportunities at a glance.
How to Use
1. Trading Signals:
• Use buy/sell shapes and flags for identifying potential entry and exit points.
• Combine primary buy/sell indicator and secondary buy/sell signals for higher confidence.
2. Trend Confirmation:
• Monitor the oscillator and signal crossovers alongside zone fills to gauge market direction.
3. RSI Analysis:
• Keep an eye on the RSI value and its color coding for confirmation of overbought or oversold conditions.
Settings
• Enable/Disable Features: Customize the visibility of Buy/Sell indicators, Potential Signals, and RSI display.
• Editable Zones: Adjust zone colors and ranges to suit your trading strategy.
Conclusion
The Stochastics Oscillator is a powerful tool for traders seeking to enhance their technical analysis. Its layered approach provides clarity, precision, and adaptability for a wide range of trading strategies, whether you're a scalper, swing trader, or long-term investor.
________________________________________
Developed by iSTAGs
________________________________________
Happy Trading! 🎯
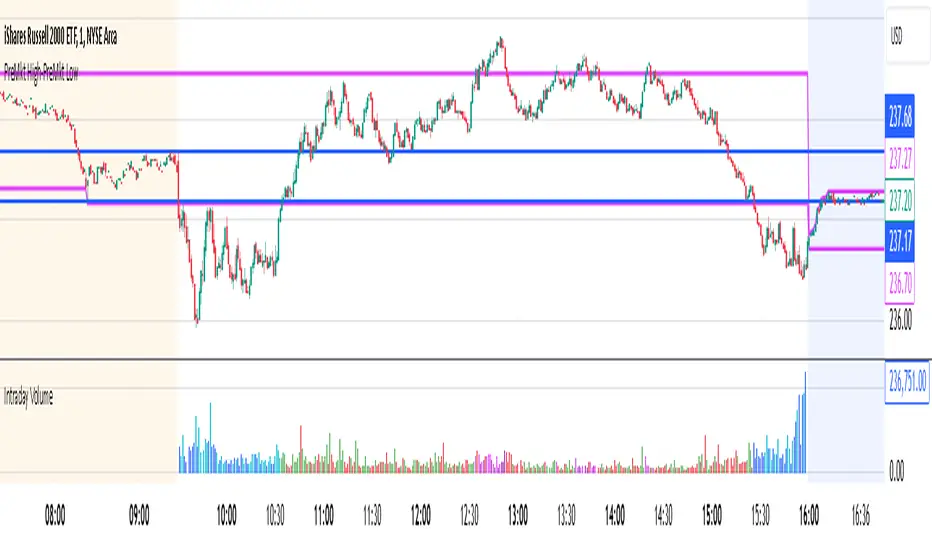
Intraday Volume### Intraday Volume Indicator Explanation
--- this was Mostly created by OpenAI ChatGPT --- it's pretty good!
--- My Commentary: One of the problems I find is with Volume is - it is skewed by the overwhelming volume around the Open and Close. So, as an experiment, I asked ChatGPT to create an indicator to plot the volume everywhere BUT the open.
I added in the CandleColor() function and set the times.
I also changed the Intraday Volume calculation from Cumulative to live.
still Chat GPT - did about 90% of the heavy lift! And, wrote the summary !
----
The "Intraday Volume" indicator is a custom script designed for use on the TradingView platform. It provides a visual representation of the total accumulated trading volume during the intraday trading session, specifically between the market open and close times. Below is a detailed explanation of its functionality:
#### **Key Features:**
1. **Session Times:**
- The indicator defines the intraday session as the period between 9:30 AM EST (market open) and 4:00 PM EST (market close).
- It uses the `timestamp` function to set these times dynamically for each trading day.
2. **Intraday Volume Calculation:**
- During the defined intraday session, the indicator accumulates the trading volume from each bar (candlestick).
- Outside the intraday session, the volume is reset to `na` (not available) to ensure only intraday data is plotted.
3. **Plotting the Volume:**
- The accumulated intraday volume is plotted as a blue column chart in a separate pane below the price chart.
- This provides a clear visualization of how the trading volume evolves throughout the trading session.
4. **Horizontal Reference Line:**
- A horizontal line is added at zero as a visual reference, making it easier to interpret the volume data.
#### **Use Cases:**
- **Volume Analysis:**
- Traders can use the indicator to identify periods of high or low trading activity during the intraday session.
- Peaks in the volume chart may correspond to key market events, such as news releases or significant price movements.
- **Trend Confirmation:**
- Comparing intraday volume with price action can help traders confirm the strength of a trend or the likelihood of a reversal.
- **Custom Time Frames:**
- Although this script is tailored for regular U.S. market hours, it can be adapted for other markets or time zones by modifying the session times.
#### **Customization:**
- **Colors and Styles:**
- The plot color (blue) and style (columns) can be customized to suit user preferences.
- **Session Times:**
- Users can change the session start and end times to match their trading needs or regional market hours.
This indicator is especially useful for intraday traders seeking insights into trading volume dynamics within the trading day. By visualizing the intraday volume, traders can gain a deeper understanding of market behavior and make informed decisions.
Bondar Drive v2.1Title: Bondar Drive v2.1 — Real-time print and delta tick volume visualization
Description:
Bondar Drive v2.1 is a tool for visualizing real-time order flow data. It highlights price movements and volume deltas in an intuitive, easy-to-read format. Indicator can be used in conjunction with the Anchored Volume Profile and Volume Footprint (Type: Total).
Features:
Real-Time Print Visualization:
Displays order flow prints with delta colors for buy/sell dominance.
Adjustable size and transparency for varying order thresholds.
Volume Delta Analysis:
Categorizes orders into Tiny, Small, Session, Large, and Huge based on user-defined thresholds.
Provides a tooltip showing order time and price.
Customizable Time Range:
Keeps prints visible for a specified duration (in seconds).
Flexible User Inputs:
Adjustable time zones, print sizes, starting bar index, and volume thresholds.
Visual Enhancements:
Line connections between prints show progression of orders and market direction.
How It Works:
The indicator gathers volume delta and price data in real time.
It dynamically displays circular labels with varying sizes and colors, reflecting the size and type of orders. Labels and lines are automatically removed after the specified time range, ensuring a clean and uncluttered chart.
Customization Options:
Number of Prints: Control how many prints are displayed.
Order Size Filters: Exclude small trades to highlight significant orders.
Color Options: Customize print colors, text, and connecting lines.
Time Offset: Adjust for your local time zone.
Use Cases:
Identify order flow imbalances and price levels dominated by buyers or sellers.
Track the progression of large orders for better trade execution.
Spot market reversals and momentum shifts using real-time prints and delta.

Daily Moving Averages on Intraday ChartsThis moving average script displays the chosen 5 daily moving averages on intraday (minute) charts. It automatically adjusts the intervals to show the proper moving averages.
In a day there are 375 trading minutes from 9:15 AM to 3:30PM in Indian market. In 5 days there are 1875 minutes. For other markets adjust this data accordingly.
If 5DMA is chosen on a five minute chart the moving average will use 375 interval values (1875/5 = 375) of 5minute chart to calculate moving average. Same 5DMA on 25minute chart will use 75 interval values (1875/25 = 75).
On a 1minute chart the 5DMA plot will use 1875 interval values to arrive at the moving average.
Since tradingview only allows 5000 intervals to lookback, if a particular daily moving average on intraday chart needs more than 5000 candle data it won't be shown. E.g 200DMA on 5minute chart needs 15000 candles data to plot a correct 200DMA line. Anything less than that would give incorrect moving average and hence it won't be shown on the chart.
MA crossover for the first two MAs is provided. If you want to use that option, make sure you give the moving averages in the correct order.
You can enhance this script and use it in any way you please as long as you make it opensource on TradingView. Feedback and improvement suggestions are welcome.
Special thanks to @JohnMuchow for his moving averages script for all timeframes.

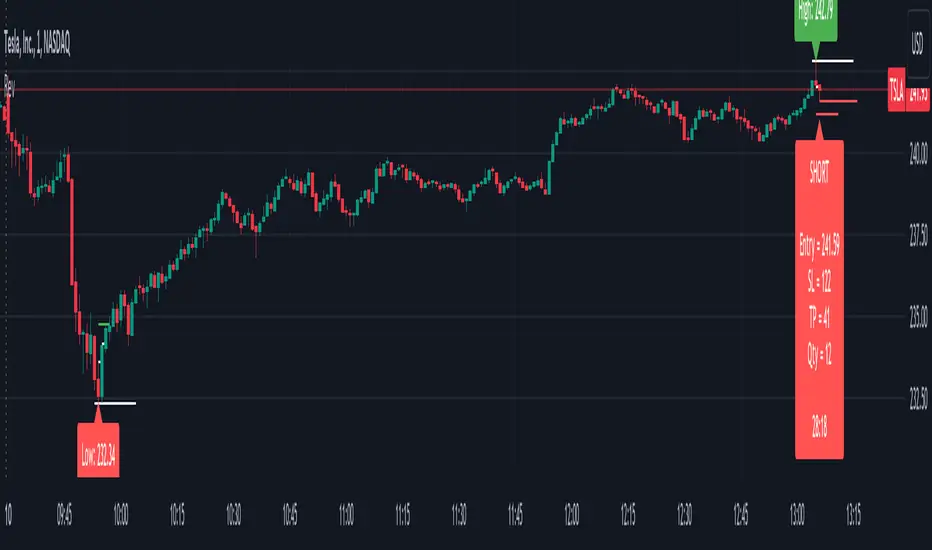
Intraday ReversalReversal Indicator
This Reversal Indicator is designed to capture high-probability reversal trades by analyzing price action at the day’s high or low. It identifies key levels, confirms breaks, and provides clear trade entry parameters based on trader margin, offering a simple yet effective approach for managing risk and potential profit. Best timeframe for trading is 1m.
Key Features:
1. Marks the Day's High and Low Candle:
- Automatically identifies and marks the high and low of the current trading day, acting as potential reversal zones.
2. Entry Trigger:
- A trade signal is generated when the price breaks below the high/low candle.
3. Trade Entry Parameters Display:
- Before the trade entry, the indicator presents a trade entry label on the chart, displaying essential information such as Stop Loss, Take Profit, and Shares Quantity, calculated according to the trader's available margin.
4. Stop Loss:
- The Stop Loss is automatically set a specified number of ticks above the day's high (for shorts) or below the day's low (for longs), ensuring tight risk management.
5. Take Profit:
- The Take Profit level is calculated as a percentage of the Stop Loss distance, providing proportional reward-to-risk ratios based on customizable preferences.
6. Visual Take Profit Line:
- Once a trade is entered, the indicator draws a visible Take Profit line on the chart. This line is initially red, signaling an active trade. If the market hits the Take Profit target, the line turns green, indicating a successful exit.
7. Setup Reset:
- The indicator resets itself with new high / low of the day
This Reversal Indicator simplifies trade execution by automating key decisions, allowing traders to focus on managing the trade rather than constantly monitoring price action. Perfect for traders looking to capitalize on daily reversal patterns with clear risk/reward parameters.
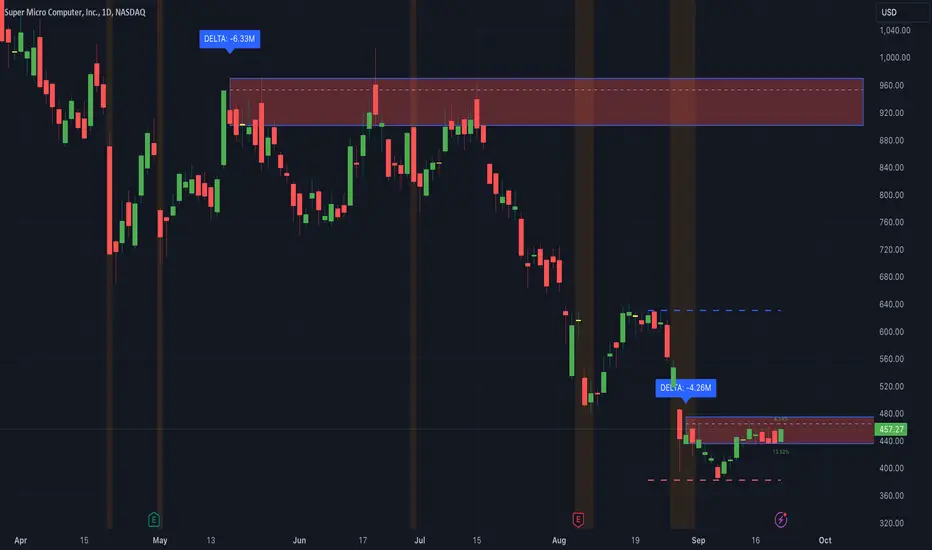
Thrax - Intraday Market Pressure ZonesTHRAX - INTRADAY MARKET PRESSURE ZONES
This indicator identifies potential support and resistance zones based on areas of significant market pressure. It dynamically plots these zones and adjusts their visibility based on real-time price action and user-defined thresholds. The indicator is useful for traders seeking to understand intraday market pressure, visualize zones of potential price reversals, and analyze volume imbalances at critical levels.
1. Support/Resistance Zones: Wherever the price retraces significantly from its high a support zone is drawn and when it retraces significantly from it low a resistance zone is drawn. The significant retracing is measured by the wick threshold percentage. For instance, if set to 75%, it implies price retracement of 75% either from high or from low for a particular candel
Volume delat: Displays volume delta information where the zones are formed. This can be used by trader to consider only those zones where delta is significant.
2. Breakout Detection: Monitors for price breakouts beyond established zones, deleting zones that are invalidated by price movement. when the price breaks a given zone with the threshold, it is considered to be mitigated and chances of trend continuation is decent.
Candle Coloring: Uses color codes (green, red, and yellow) to represent bullish, bearish, and indecisive (doji) candles, aiding quick visual assessment.
INPUTS
1. Wick Threshold (%) : Sets the minimum wick percentage required for a candle to be considered a support or resistance candidate.
2. Breakout Threshold (%) : Determines the percentage above or below a support or resistance zone that defines a breakout condition. if breaks a zone with the set threshold then the zone will be considered mititgated.
3. Max Number of Support/Resistance Zones : Limits the maximum number of support/resistance zones displayed on the chart, ranging from 1 to 5.
4. Show Wick Percentage Labels : Toggles the display of percentage values for upper and lower wicks on each candle.
TRADE SETUP
Identifying Entry Points: Look for the formation of support or resistance zones. Wait for price to retrace to these zones. if you are willing to take risk, you can consider even zones with low delta. If you want to be more cautious you should consider zones with high delta.
Volume Confirmation: Use the volume information to confirm the strength of the zone. Strong volume differences (displayed as labels) can indicate significant market pressure at these levels.
Breakout Trades: If price breaks through a support/resistance zone by more than the breakout threshold, consider this a signal for a potential trend continuation in the breakout direction.
Risk Management: Set stop-loss levels slightly outside of the identified zones to minimize risk in case of false breakouts. This can be set in input setting for breakout threshold.
Bonus Tip : Mark your significant highs and lows from where prices have retraced multiple times in the near past and if the zone is near these levels it can serve s a strong candidate of support or resistance
Therefore, in conclusion monitor the zones, based on delta and volume presence filter out the zone, wait for price retracement to the zone, intiate the trade with stop loss below zone with a set percentage.
Daily Moving Average for Intraday TimeframesThis indicator provides a dynamic tool for visualizing the Daily Moving Average (DMA) on intraday timeframes.
It allows you to analyze how the price behaves in relation to the daily moving average in timeframes from 1 minute up to 1 day.
KEY FEATURES
DMA on Intraday timeframes only : This indicator is designed to work exclusively on intraday charts with timeframes between 1 minute and 1 day. It will not function on tick, second-based, or daily-and-above charts.
Color-Coded Zones for Trend Identification :
Green Zone: The price is above a rising DMA, signaling a bullish momentum.
Red Zone: The price is below a falling DMA, signaling a bearish momentum.
Yellow Zone: Signaling uncertainty or mixed conditions, where either the price is above a falling DMA or below a rising/flat DMA.
Configurable DMA Period : You can adjust the number of days over which the DMA is calculated (default is 5 days). This can be customized based on your trading strategy or market preferences.
24/7 Market Option : For assets that trade continuously (e.g., cryptocurrencies), activate the "Is trading 24/7?" setting to ensure accurate calculations.
WHAT IS THE DMA AND WHY USE IT INTRADAY?
The Daily Moving Average is a Simple Moving Average indicator used to smooth out price fluctuations over a specified period (in days) and reveal the underlying trend.
Typically, a SMA takes price value for the current timeframe and reveal the trend for this timeframe. It gives you the average price for the last N candles for the given timeframe.
But what makes the Intraday DMA interesting is that it shows the underlying trend of the Daily timeframe on a chart set on a shorter timeframe . This helps to align intraday trades with broader market movements.
HOW IS THE DMA CALCULATED?
If we are to build a N-day Daily Moving Average using a Simple Moving Average, we need to take the amount of candles A needed in that timeframe to account for a period of a day and multiply it by the number of days N of the desired DMA.
So for instance, let say we want to compute the 5-Day DMA on the 10 minute timeframe :
In the 10 minute timeframe there are 39 candles in a day in the regular session.
We would take the 39 candles per day and then multiply that by 5 days. 39 x 5 = 195.
So a 5-day moving average is represented by a simple moving average with a period of 195 when looking at a 10 minute timeframe.
So for each period, to create a 5-day DMA, you would have to set the period of your simple moving average like so :
- 195 minutes = 10 period
- 130 minutes = 15 period
- 65 minutes = 30 period
- 30 minutes = 65 period
- 15 minutes = 130 period
- 10 minutes = 195 period
- 5 minutes = 390 period
and so on.
This indicator attempts to do this calculation for you on any intraday timeframe and whatever the period you want to use is for your DMA. You can create a 10-day moving average, a 30-day moving average, etc.

Horizontal Lines 0.5, BY ROSHAN SINGHThis indicator identify support and resistance to trade in 1min time frame, based of fib 0.5 level, on 15 min time frame find major high and low means major swing, low will be our start level and high will be our end level input in setting, substract high and end level and now divide answer with 2 till the daily volatility of a index or stock, if saying about nifty suppose nifty daily travel minimum for 65 pts then interval will be 65 input in settings, now all horizontals lines means support and level will be plotted on chart, buy on support, sell on resistance

Intraday Stop Loss Calculator[fitfatq]Indicator Overview
Intraday Stop Loss Calculator is a practical tool designed for day traders. This indicator helps traders instantly calculate the loss percentage based on the high or low of the current K-bar relative to the entry price. It also displays the stop-loss risk based on the day's high or low. You can select either long or short mode, allowing the indicator to calculate the appropriate data according to your trading strategy.
Features
Current K-bar Stop Loss: Calculates and displays the loss percentage based on the high or low of the current K-bar, making it ideal for short-term trading decisions. Day Stop Loss: Calculates and displays the loss percentage based on the day's high (for short positions) or low (for long positions), helping you better manage risk by understanding the distance between the current price and key levels.
Adjustable Options
Minute Period: Users can select the minute period for the indicator, with a default of 5 minutes. Position Type: Choose between "Long" or "Short," and the indicator will automatically calculate the relevant stop-loss data based on your selection. Show Day Stop Loss: Users can choose whether to display the stop-loss percentage based on the day's high or low. The default is enabled.
Usage Instructions
Load the indicator, set the minute period, and choose the long or short mode. Depending on your trading strategy, decide whether to display the day's stop-loss percentage. When switching symbols, if the current K-bar has no movement, the indicator may temporarily not display information. This is normal behavior. Please wait for the next K-bar or manually refresh.
Basic Logic
The indicator calculates and displays the loss percentage based on the high or low of the current K-bar and the day's high or low, helping traders understand potential stop-loss risks in real-time. Users can adjust parameters such as color and transparency to ensure the indicator displays clearly and meets their expectations.
Notes
When switching symbols, if the K-bar has no movement, the indicator may not immediately update. This is due to Pine Script requiring data changes to trigger calculations. This indicator is ideal for users who frequently engage in day trading, helping you better manage risk and make timely decisions.
Additionally, please note that in the Chinese version of TradingView, the long/short options might be translated as "Short-term" and "Long-term," but this does not affect the functionality of the indicator.

B A N K $ - Advanced Session RangesThis is a simple indicator that has been designed to aid intraday trading and has a few components;
Key Features
Session Ranges + Optimal Exit Time
Asia Pip Range
New York Midnight Open Line
Session Ranges + Optimal Exit Time
Information ℹ️
This is a visual depiction of the 3 main sessions in the markets. Asia, London & New York. The default timings are set to perfectly align with each session however the Start & End times for each session can be changed in the settings. (I've added a website on the tooltip to easily convert timezones)
I have also added a 4th session range called "Optimal Exit Time". This is statistically the most probable time window for the opposite High / Low of Day to form is within this window. It helps the trader understand when they should look to take profit.
How It Works 🔑
The indicator automatically maps on two lines for the High & Low of the range between the selected Start & End time, it also colours the background.
The individual lines & background can be toggled & customised to the traders preference.
Asia Pip Range
Information ℹ️
This displays the Asia Range in pips beneath the Asia Session Low.
How It Works 🔑
This calculates the distance between the Asia High - Asia Low in pips. It will automatically recalibrate to the timings the trader sets in the settings if they change the Start / End.
New York Midnight Open Line
Information ℹ️
This helps look for Buys beneath the line for a Bullish Expansion day 📈 & Sells above the line for a Bearish Expansion day 📉
How It Works 🔑
This adds a horizontal line to the chart that is anchored to New York Midnight Open (00:00) by default. It can be changed in the settings in required. You can also toggle on the time being shown above the line.

[AlbaTherium] MTF External Ranges Analysis - ERA-Orion for SMC MTF External Ranges Analysis - ERA - Orion for Smart Money Concepts
Introduction:
The MTF External Ranges Analysis - ERA - Orion offers enhanced insights into multi-timeframe external structure points, swing structure points, POIs (Points of Interest), and order blocks (OB) . By incorporating this enhancement, your multi-timeframe analysis are streamlined, simplifying the process and reducing chart workload, no need for manual chart drawing anymore, stay focus on Low Time Frame and get High Time Frame insights in one single Time frame.
This identification process remains effective even when focusing on Lower Time Frames (LTF), providing detailed insights without sacrificing the broader market perspective.
The MTF External Ranges Analysis - ERA – Orion is specifically designed to be used in conjunction with OptiStruct™ Premium for Smart Money Concepts . This strategic combination enhances the workflow of identifying optimal entry points. OptiStruct acts as the analysis tool for Lower Time Frames (LTF), zeroing in on immediate interest areas, while Orion expands this analysis to Higher Time Frames (HTF), providing a broader view of market trends and importants key levels . The integration of Orion with OptiStruct seamlessly merges LTF and HTF analyses, ensuring a thorough understanding of market dynamics for informed and strategic decision-making. This toolkit in one package assembly is pivotal for traders relying on Smart Money Concepts, offering unmatched clarity and actionable insights to navigate the markets effectively.
This tool offers an advanced smart money technical analysis to improve your trading experience. It introduces four key concepts:
Main Features:
Entries Enhancements
Inducements HTF
High/Low Markings HTF
Multiple Timeframes and Confluences on Extreme, Dec and SMT Order Blocks
By integrating these concepts into one, traders can identify high-probability zones across multiple timeframes and develop a thorough understanding of market dynamics. These confluence zones enhance order block skills and potential, establishing them as essential pillars in smart money trading strategies and enabling traders to make more informed decisions.
Settings Overview:
HTF Settings Enable HTF Analysis
Select timeframe {Select or 4H Chart}
Labels Alignment for Lines and Boxes
Inside bar ranges HTF
Break of Structure /Change of Character HTF
Inducements HTF
High/Low Markings HTF
High/Low Sweeps HTF
Extreme Order Blocks HTF
Decisional Order Blocks HTF
Smart Money Traps HTF
IDM Demands and Supplies HTF
Historical Order Blocks HTF
OB Mitigation HTF {touch/ extended}
Understanding the Features:
Chapter 1: Entries Enhancements
In this chapter, we delve into strategies to refine trading entries, focusing on the multi-timeframe analysis of extreme or decisional order blocks in the High Time Frame timeframe as a key point of interest. We highlight the significance of transitioning to the Low Time Frame chart for observing pivotal shifts in market behavior. By examining these concepts, traders can gain deeper insights into market dynamics and make more informed entries decisions at critical junctures.
Practical Example:
We had an Order Block Extreme on the 1-hour timeframe, and currently, we are on the recommended chart for trade entry, which is the 5-minute timeframe. We are patiently waiting to observe a 5-minute ChoCh in the market to enter a buying position since it's an OB Extreme Demand on the 1-hour timeframe. Here, it's crucial and important to focus on the entry timeframe rather than checking what's happening in the higher timeframe. The indicator facilitates this task as it provides us with real-time perspective and visibility of everything happening in the higher timeframe.
Chapter 2: Inducements HTF
It is important and useful to be aware of the various liquidity points across the different timeframes we use; sometimes, a reliable entry point in the Lower Time Frame (LTF) may be surrounded by inducements. Consequently, this point becomes unreliable, and prior to the arrival of this functionality, such anomalies could not be detected, especially when focusing on the market in the LTF. From now on, there will be no more such issues.
Practical Example:
Suppose we identify an Order Block Extreme on the 5M timeframe, indicating a potential entry level. However, when we switch to the 5M timeframe to look for an entry point, we observe an accumulation of inducements around this Order Block coming from a higher timeframe, whether it's M15 or H1. This suggests a potential weakness in the entry point and significant market liquidity, which will act as a trap zone. Before the introduction of this feature, we might have missed this crucial observation, but now we can detect these anomalies and adjust our strategy accordingly.
The only practical way to see theses confluences is to use this Indicator, see the example below
Chapter 03: High/Low – Bos - ChoCh Markings HTF
The High/Low Markings HTF feature in the MTF External Ranges Analysis - ERA - Orion provides a comprehensive view into the market's heartbeat across different timeframes, right from within the convenience of the Lower Time Frame (LTF). It meticulously highlights pivotal shifts, allowing traders to seamlessly discern market sentiment and anticipate potential price reversals without needing to toggle between multiple charts. This innovation ensures that critical market movements and sentiment across various timeframes are visible and actionable from a single, focused LTF perspective, enhancing decision-making and strategic planning in trading activities.
Understanding High/Low Markings in HTF Analysis
High/Low Markings in High Time Frame (HTF) analysis mark the market's extremities within a given period, pinpointing potential areas for reversals or continuation and delineating crucial support and resistance levels. These markings are not arbitrary but represent significant market responses, serving as essential indicators for traders and analysts to gauge market momentum and sentiment.
The Role of HTF in Market Analysis
HTF analysis extends a comprehensive view over market movements, distinguishing between ephemeral fluctuations and substantial trend shifts. By scrutinizing these high and low points across wider time frames, analysts can unravel the underlying market momentum, enabling more strategic, informed trading decisions.
Identifying High/Low Markings
Identifying these crucial points entails detailed chart analysis over extended durations—daily, weekly, or monthly. The search focuses on the utmost highs and lows within these periods, which are more than mere points on a chart. They are significant market levels that have historically elicited robust market reactions, serving as key indicators for future market behavior.
Real-world Example:
Chapter 04: Multiple Timeframes and Confluences on Extreme, Dec and SMT Order Blocks Across HTF
The Orion indicator serves as a bridge between the multiple dimensions of the market, enabling a unified and strategic interpretation of potential movements. It's an indispensable tool for those seeking to capitalize on major opportunity zones, where the convergence of diverse perspectives creates ideal conditions for significant market movements.
Designed to navigate through the data of different timeframes and market analysis, Orion provides a clear and consolidated view of major points of interest. With this indicator, traders can not only spot opportunity zones where consensus is strongest but also adjust their strategies based on the dynamic interaction of various market participants, all while remaining within the Lower Time Frame (LTF).
Conclusion:
MTF External Ranges Analysis - ERA - Orion for Smart Money Concepts as “ The Orion ” indicator captures consensus among scalpers, day traders , swing traders, and investors, turning key areas into major opportunities. It allows for precise identification of areas of interest by analyzing the convergence of actions from various market participants. In short, Orion is crucial for detecting and leveraging the most promising points of convergence in the market.
This identification occurs even while focusing on Lower Time Frames (LTF), allowing for detailed insights without losing the broader market perspective.
This document provides an extensive overview of MTF External Ranges Analysis - ERA - Orion , emphasizing its importance in comprehending market dynamics and utilizing essential smart money concepts trading principles.

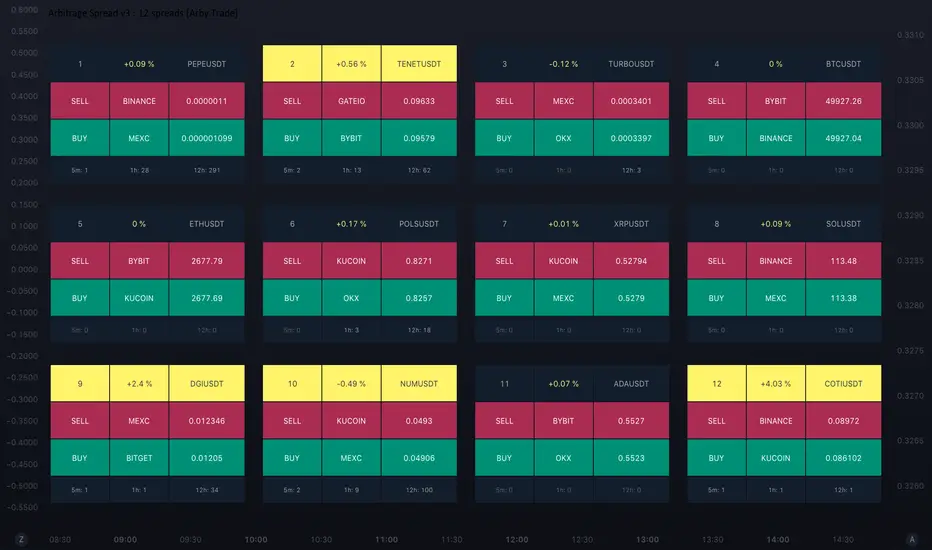
Arbitrage Spread v3 : 12 spreads dashboard [Arby.Trade]This indicator allows you to track in real time the change in the spread (the difference in the exchange rate) between two assets simultaneously for 12 trading pairs.
⚙️ How does the indicator work?
In the indicator settings menu, the user selects two trading pairs, for example BTCUSDT on the Binance exchange and BTCUSDT on the Bybit exchange, after which the script will receive prices from both exchanges and compare them with each other, calculating the percentage deviation between prices (spread). The script will do this work with all 12 trading pairs added to the script settings menu. The script can only work with those assets and exchanges that are on board TradingView, and this is not a small thing.
⚡️ How to use it?
At times when the spread value is negative, this means that the price of the asset on the first exchange is less than on the second. That is, by buying an asset on the first exchange and selling it on the second one, you can earn money (of course, it is important to take into account the commissions of the exchanges for these transactions). When the spread is above zero, the opposite is true. The exchanges and the prices at which to buy are displayed in the green Buy row. Prices and exchanges for sale are in the Sell row and highlighted in red. When the spread is zero, the prices on both exchanges are the same and there is no arbitrage situation.
To improve the accuracy of the indicator, try to use the minimum timeframe available for your TradingView subscription – minute or second.
🕒 Counter of arbitration situations
For each trading pair, the table below the Buy row shows the number of arbitrage situations that have been on the asset for a certain period of time. In this case, an arbitrage situation is understood as the moment when the spread value exceeded the Signal Threshold Level set by the user. Each time the spread value of the Signal Threshold Level is exceeded, the counter will add one. The counter takes into account only those arbitrage situations that were on the market during the time period back from the current moment. For example, for a 1-hour period (1h) of the counter, the number of arbitration situations for the last hour will be displayed. For each asset you can simultaneously track the number of arbitrage situations during three selected time periods from 5 minutes to a day.
The counter will allow you to evaluate the prospects of arbitrage of selected trading pairs. For example, if the number of arbitrage situations on a trading pair was 1-2 within an hour, then it is obvious that it is better not to waste time waiting for another such situation on this pair and look for the next one.
🔔 Setting up Alerts
In the script settings, you can set the threshold value of the spread – Spread Signal Threshold. When this level is reached, the table related to the asset whose spread has reached this level will be highlighted. Also, this level is a signal level for setting up alerts from the indicator.
To set up alerts, open the Alerts tab in the TradingView menu on the right. Click the "Create Alert" button. Then, in the window that opens, select this indicator in the "Condition" line. After that, you can set a name for this alert and complete the notification setup by clicking the "Create" button.
We, the authors of this script, have been engaged in cryptocurrency arbitrage for a long time and, first of all, created it for ourselves and our daily arbitrage trading, but this does not prevent you from using it at your discretion for any types of assets and in any markets.
We have a lighter version of the indicator that allows you to track the spread for only one trading pair or three at the same time. In these versions you can also view the chart of the spread itself, which can be useful for assessing the nature of the spread movement in the history. If this indicator seems too heavy for you and your device, you can use these lighter versions:
🧩 Arbitrage Spread v1 : 1 pair + 1 chart
🧩 Arbitrage Spread v2 : 3 pairs + 3 charts
If, on the contrary, the capabilities of your hardware allow, do not forget that you can always add several indicators to your screen – for example, use the version with 12 pairs as a dashboard with many pairs, and in addition to it one of the versions with a spread chart and look at a more detailed picture of one or three instruments separately.
--
Данный индикатор позволяет отслеживать в реальном времени изменение спреда (разницы в курсе) между двумя активами одновременно для 12 торговых пар.
⚙️ Как устроен индикатор?
В меню настроек индикатора пользователь выбирает две торговые пары, например BTCUSDT на бирже Binance и BTCUSDT на бирже Bybit, после чего скрипт получит цены с обеих бирж и сравнит их между собой, рассчитав процентное отклонение между ценами (спред). Такую работу скрипт проделает со всеми 12 торговыми парами добавленными в меню настроек скрипта. Скрипт может работать только с теми активами и биржами, которые есть на борту TradingView, и это не мало.
⚡️ Как пользоваться?
В моменты, когда значение спреда отрицательное, это означает, что цена на актив на первой бирже меньше, чем на второй. То есть, купив актив на первой бирже и продав его на второй можно заработать (конечно при этом важно учитывать комиссии бирж на совершение данных сделок). Когда спред выше нуля - наоборот. Биржи и цены, по которым надо покупать отображаются в зеленой строке Buy. Цены и биржи для продажи – в строке Sell и выделены красным цветом. Когда спред равен нулю – цены на обеих биржах одинаковы и арбитражная ситуация отсутствует.
Для повышения точности работы индикатора старайтесь использовать минимально доступный для вашей подписки TradingView таймфрейм – минутный или секундный.
🕒 Счетчик арбитражных ситуаций
По каждой торговой паре в таблице под строкой Buy отображается количество арбитражных ситуаций, которые были на инструменте в течение определенного промежутка времени. В данном случае под арбитражной ситуацией понимается момент, когда значение спреда превысило установленный пользователем сигнальный уровень спреда Signal Threshold Level. При каждом превышении значения спреда уровня Signal Threshold Level счетчик будет прибавлять единицу. Счетчик учитывает только те арбитражные ситуации, которые были на рынке в течение временного периода назад от текущего момента. К примеру, для 1-часового периода (1h) счетчика будет отображаться количество арбитражных ситуаций за последний час. По каждому инструменту одновременно можно отслеживать количество арбитражных ситуаций в течение трех выбранных временных периода от 5 минут до суток.
Счетчик позволит оценить перспективность арбитража выбранных торговых пар. К примеру, если количество арбитражных ситуаций на торговой паре в течение часа было 1-2, то очевидно, что лучше не тратить время на ожидание очередной такой ситуации на данной паре и поискать следующую.
🔔 Настройка оповещений
В настройках скрипта можно настроить пороговое значение спреда – Spread Signal Threshold. При достижении этого уровня будет подсвечена таблица относящаяся к активу, спред которого достиг этого уровня. Так же, этот уровень является сигнальным для настройки оповещений от индикатора.
Для настройки оповещений откройте вкладку «Оповещения» в меню TradingView справа. Нажмите кнопку «Создать оповещение». Затем в открывшемся окне в строке «Условие» выберете данный индикатор. После чего вы можете задать название данному оповещению и завершить настройку оповещения, нажав кнопку «Создать».
Мы, авторы данного скрипта, давно занимаемся арбитражем криптовалюты и, в первую очередь, создавали его для себя и своей каждодневной арбитражной торговли, но это не мешает вам использовать его по своему усмотрению для любых видов активов и на любых рынках.
У нас есть более легкая версия индикатора, позволяющая отслеживать спред только по одной торговой паре или одновременно по трем. В этих версиях также можно просматривать график самого спреда, что может быть полезным для оценки характера движения спреда в истории. Если данный индикатор покажется для вас и вашего устройства слишком тяжелым вы можете воспользоваться этими более легкими версиями:
🧩 Arbitrage Spread v1 : 1 pair + 1 chart
🧩 Arbitrage Spread v2 : 3 pairs + 3 charts
Если, наоборот, возможности вашего железа позволяют, не забывайте, что вы всегда можете добавить себе на экран несколько индикаторов – например, версию с 12 парами использовать как дашборд с множеством пар, а в дополнение к ней одну из версий с графиком спреда и смотреть более детальную картину по одному или трем инструментам отдельно.
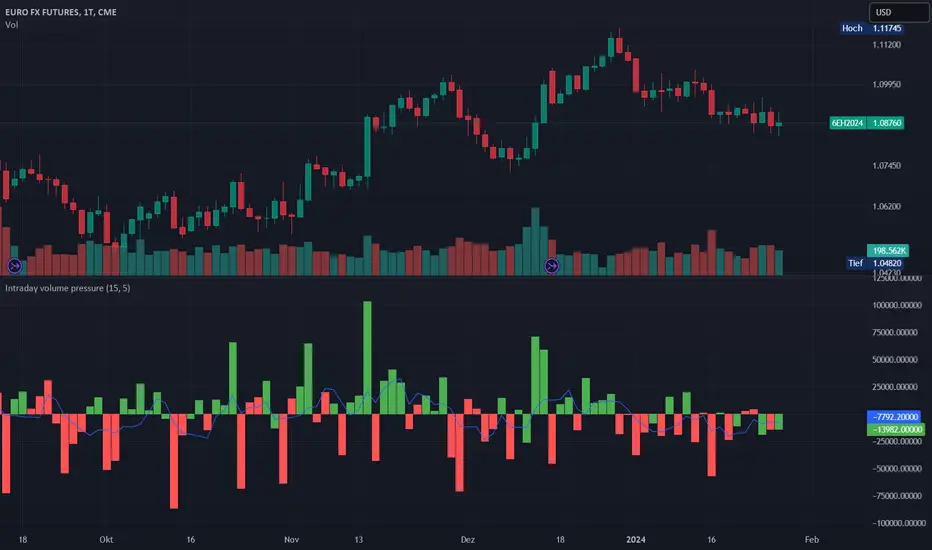
Intraday volume pressureThis indicator shows the difference of bullish and bearish trading volume during intraday
The idea
Especially in "6E1!" it caught my eye, that often outside regular trading hours the price moves in one direction with thin volume and inside regular trading hours it moves back with much higher volume. It is possible, that the market closes e.g. with a plus. And over some days maybe you can see e.g. weak rising prices. But in this time the movements with high volume are going down every day. And one day - maybe within view minutes - the market rushs a level deeper.
Maybe some are manipulating the market in this way, maybe not, it doesn't matter. So my question was, can I find a way to show such divergences? I guess I can do.
How to use this indicator
Use it at your own risk! I don't take over any responsibility. You are the only one, who is responsible for your decisions. Always collect information from different independent sources!
Watch it in the daily chart - not intraday, not weekly! Of course this indicator just analyzes the past as all indicators. Everytime everything may happen that influences the market in any direction, no indicator can predict any news.
Watch it in sideways market or when the price is moving quite slow over days! An average volume pressure
below zero shows a volume-driven bearish pressure
above zero shows a volume-driven bullish pressure
of the last days. So there is a chance, that the market may follow the volume pressure within the next days. But of course, I cannot guarantee anything. The indicator just can give you an idea, why this will happen, when it will happens. Otherwise, the indicator indicated nothing helpfull.
Of course you also can try other securities. Maybe it will work there better or worse - difficult to say. I guess, it depends on the market.
Possible settings aside of colors
Intraday minute bars: Default is 15 minutes, in 6E in my point of view it is a good value. If you choose a smaller value, the chart gets too noisy, the results are getting too small. With a bigger timeframe some moves are hidden in bigger candles, the results are getting a large spread
Average over days: Default is 5 days - so one week. In 6E in my point of view it is a good value. A smaller value is too noisy. A bigger value reacts too slow. Often 6E has a trend over weeks. Sometimes it changes within some days - the indicator may help. But sometimes the market changes with a buying or selling climax. Such a case this indicator cannot recognize. But with the 5 days average maybe you get a change in the indicator within one or two days. Anyway, it is always a good idea to learn recognizing climaxes otherwise.
How the indicator works
It uses the function request.security_lower_tf to get the intraday candles. The volume of intraday up-candles is added to the intraday summary volume. The volume of down candles is substracted from the intraday summary volume.
In the oscillator area I plot a green bar on a day with a higher close than open and a red bar on a day with a lower close than open. The bar has a positive value, if the volume pressure is positive and a negative value if the volume pressure is negative. So it happens, that a green bar has a negative value or a red bar has a positive value.
The average is calculated with a floating sum. Once we have enough days calculated, I devide the floating sum by the length of the "Average over days" and plot the result. Then I substract the first value of the queue and I remove it.
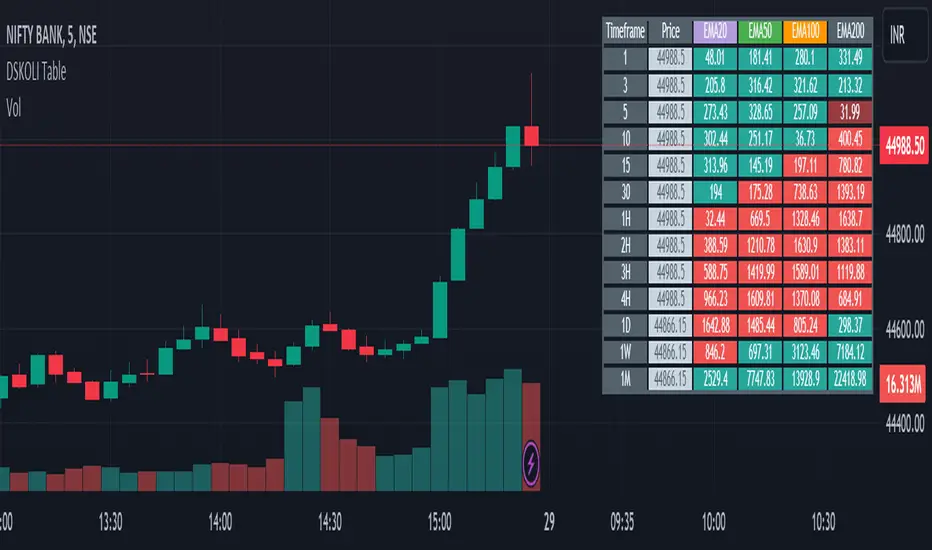
DSKOLI TableThis helps to determine bullish or bearish trend of any chart on any generally available time-frame and good to have for Intraday watch.
Details -
a. Points shown in table shows the difference of last shown price from specified EMAs, this helps to know the price movement of candles are above or below the EMA and its coloured with red and green which even further helps to determine its existing trend.
Note or Disclaimer:
1. This may be considered only for Watching as Learning and informational purpose.
2. Take advice from financial advisor before entering, holding, converting or exiting from any order or trade.
3. Always keep your acceptable stop-loss in all your transactions while trading or investing.
DSKOLI or TradingView reserves all right and don't hold any responsibilities for any loss/losses as well as accuracy of levels or price movement.