JINN: A Multi-Paradigm Quantitative Trading and Execution EngineI. Core Philosophy: A Substitute for Static Analysis
JINN (Joint Investment Neural and Network) represents a paradigm shift from static indicators to a living, adaptive analytical ecosystem. Traditional tools provide a fixed snapshot of the market. JINN operates on a fundamentally different premise: it treats the market as a dynamic, regime-driven system. It processes market data through a hierarchical suite of advanced, interacting models, arbitrates their outputs through a rules-based engine, and adapts its own logic in real-time.
It is designed as a complete framework for traders who think in terms of statistical edge, market regimes, probabilistic outcomes, and adaptive risk management.
II. The JINN Branded Architecture: Your Command and Control Centre
JINN’s power emerges from the synergy of its proprietary, branded architectural components. You do not simply "use" JINN; you command its engines.
1. JINN Signal Arbitration (JSA) Engine
The heart of JINN. The JSA is your configurable arbitration desk for weighing evidence from all internal models. As the Head Strategist, you define the entire arbitration philosophy:
• Priority and Weighting : Define a "chain of command". Specify which model's opinion must be considered first and assign custom weights to their outputs, directly controlling the hierarchy of your analytical flow.
• Arbitration Modes :
First Wins: For high-conviction, rapid signal deployment based on your most trusted leading model.
Highest Score: A "best evidence" approach that runs a full analysis and selects the signal with the highest weighted probabilistic backing.
Consensus: An ultra-conservative, "all-clear" mode that requires a unanimous pass from all active models, ensuring maximum confluence.
2. JINN Threshold Fusion (JTF) Engine
Static entry thresholds can be limiting in a dynamic market. The JTF engine replaces them with a robust, adaptive "breathing" channel.
• Kalman Filter Core : A noise-reducing, parametric filter that provides a smooth, responsive centre for the entry bands.
• Exponentially Weighted Quantile (EWQ) : A non-parametric, robust measure of the signal's recent distribution, resistant to outliers.
• Dynamic Fusion : The JTF engine intelligently fuses these two methodologies. In stable conditions, it can blend them; in volatile conditions, it can be configured to use the "Minimum Width" of the two, ensuring your entry criteria are always the most statistically relevant.
3. JINN Pattern Veto (JPV) with Dynamic Time Warping
The definitive filter for behavioural edge and pattern recognition. The JPV moves beyond value-based analysis to analyse the shape of market dynamics.
• Dynamic Time Warping (DTW) : A powerful algorithm from computer science that compares the similarity of time series.
• Pattern Veto : Define a "toxic" price action template—a pattern that has historically preceded failed signals. If the JPV detects this pattern, it will veto an otherwise valid trade, providing a sophisticated layer of qualitative, shape-based filtering.
4. JINN Flow VWAP
This is not a standard VWAP. The JINN Flow VWAP is an institutionally-aware variant that analyses volume dynamics to create a "liquidity pressure" band. It helps visualise and gate trades based on the probable activity of larger market participants, offering a nuanced view of where significant flow is occurring.
III. The Advanced Model Suite: Your Pre-Built Quantitative Toolkit
JINN provides you with a turnkey suite of institutional-grade models, saving you thousands of hours of research and development.
1. Auto-Tuning Hyperparameters Engine (Online Meta-Learning)
Markets evolve. A static strategy is an incomplete strategy. JINN’s Auto-Tuning engine is a meta-learning layer inspired by the Hedge (EWA) algorithm, designed to combat alpha decay.
• Portfolio of Experts : It treats a curated set of internal strategic presets as a portfolio of "experts".
• Adaptive Weighting : It runs an online learning algorithm that continuously measures the risk-adjusted performance of each expert (using a sophisticated reward function blending Expected Value and Brier Score).
• Dynamic Adaptation : The engine dynamically allocates more influence to the expert strategy that is performing best in the current market regime, allowing JINN’s core logic to adapt without manual intervention.
2. Lorentzian Classification and PCA-Lite EigenTrend
• Lorentzian Engine : A powerful probabilistic classifier that generates a continuous probability (0-1) of market state. Its adaptive, volatility-scaled distribution is specifically designed to handle the "fat tails" and non-Gaussian nature of financial returns.
• PCA-Lite EigenTrend : A Principal Component Analysis engine. It reduces the complex, multi-dimensional data from the Technical and Order-Flow ensembles into a single, maximally descriptive "EigenTrend". This factor represents the dominant, underlying character of the market, providing a pure, decorrelated input for the Lorentzian engine and other modules.
3. Adaptive Markov Chain Model
A forward-looking, state-based model that calculates the probability of the market transitioning between Uptrend, Downtrend, and Sideways states. Our implementation is academically robust, using an EMA-based adaptive transition matrix and Laplace Smoothing to ensure stability and prevent model failure in sparse data environments.
IV. The Execution Layer: JINN Execution Latch Options
A good signal is worthless without intelligent execution. The JINN Execution Latch is a suite of micro-rules and safety mechanisms that govern the "last mile" of a trade, ensuring signals are executed only under optimal, low-risk conditions. This is your final pre-flight check.
• Execution Latch and Dynamic Cool-Down : A core safety feature that enforces a dynamic cool-down period after each trade to prevent over-trading in choppy, whipsaw markets. The latch duration intelligently adapts, using shorter periods in low-volatility and longer periods in high-volatility environments.
• Volatility-Scaled Real-Time Threshold : A sophisticated gate for real-time entries. It dynamically raises the entry threshold during sudden spikes in volatility, effectively filtering out noise and preventing entries based on erratic, unsustainable price jerks.
• Noise Debounce : In market conditions identified as "noisy" by the Shannon Entropy module, this feature requires a real-time signal to persist for an extra tick before it is considered valid. This is a simple but powerful heuristic to filter out fleeting, insignificant price flickers.
• Liquidity Pressure Confirmation : An institutional-grade check. This gate requires a minimum threshold of "Liquidity Pressure" (a measure of volume-driven momentum) to be present before validating a real-time signal, ensuring you are entering with market participation on your side.
• Time-of-Day (ToD) Weighting : A practical filter that recognises not all hours of the trading day are equal. It can be configured to automatically raise entry thresholds during historically low-volume, low-liquidity sessions (e.g., lunch hours), reducing the risk of entering trades on "fake" moves.
• Adaptive Expectancy Gate : A self-regulating feedback mechanism. This gate monitors the strategy's recent, realised performance (its Expected Value). If the rolling expectancy drops below a user-defined threshold, the system automatically tightens its entry criteria, becoming more selective until performance recovers.
• Bar-Close Quantile Confirmation : A final layer of confirmation for bar-close signals. It requires the signal's final score to be in the top percentile (e.g., 85th percentile) of all signal scores over a lookback period, ensuring only the highest conviction signals are taken.
V. The Contextual and Ensemble Frameworks
1. Multi-Factor Ensembles and Bayesian Fusion
JINN is built on the principle of diversification. Its signals are derived from two comprehensive, fully customizable ensembles:
• Technical Ensemble : A weighted combination of over a dozen technical features, from cyclical analysis (MAMA, Hilbert Transforms) and momentum (Fisher Transform) to trend efficiency (KAMA, Fractal Efficiency Ratio).
• Order-Flow Ensemble : A deep dive into market microstructure, incorporating Volume Delta, Absorption, Imbalance, and Delta Divergence to decode institutional footprints.
• Bayesian Fusion : Move beyond simple AND/OR logic. JINN’s Bayesian engine allows you to probabilistically combine evidence from trend and order-flow filters, weighing each according to its perceived reliability to derive a final posterior probability.
2. Context-Aware Framework and Entropy Engine
JINN understands that a successful strategy requires not just a good entry, but an intelligent exit and a dynamic approach to risk.
• Shannon Entropy Filter : A direct application of information theory. JINN quantifies market randomness and allows you to set a precise entropy ceiling to automatically halt trading in unpredictable, high-entropy conditions.
• Adaptive Exits and Regime Awareness : The script uses its entropy-derived regime awareness to dynamically scale your Take Profit and Trailing Stop parameters . It can be configured to automatically take smaller profits in choppy markets and let winners run in strong trends, hard-coding adaptive risk management into your system.
VI. The Dashboard: Your Mission Control
JINN features a dynamic, dual-mode dashboard that provides a comprehensive, real-time overview of the entire system's state.
Mode 1: Signal Gate Metrics Dashboard
This dashboard is your pre-flight checklist. It displays the real-time Pass/Fail/Off status of every single gating and filtering component within JINN, including:
• Core Ensembles : Technical and Order-Flow Ensemble status.
• Trend Filters : VWAP, VWMA, ADX, ATR Slope, and Linear Regression Angle gates.
• Advanced Models : Dual-Lorentzian Consensus, Markov Probability, and JPV Veto status.
• Regime and Safety : Shannon Entropy, Execution Latch, and Expectancy Gate status.
• Final Confirmation : A master "All Hard Filters" status, giving you an at-a-glance confirmation of system readiness.
Mode 2: Quantitative Metrics Dashboard
This dashboard provides a high-level, institutional-style data readout of the current market state, as seen through JINN's analytical lens. It includes over 60 key metrics for both Signal Gate and Quantitative Metrics, such as:
• Ensemble and Confidence Scores : The raw numerical output of the Technical, Order-Flow, and Lorentzian models.
• Volatility and Volume Analysis : Realised Volatility (%), Relative Volume, Volume Sigma Score, and ATR Z-Score.
• Momentum and Market Position : ADX, RSI Z-Score, VWAP Distance (%), and Distance from 252-Bar High/Low.
• Regime Metrics : The numerical value of the Shannon Entropy score and the Model Confidence score.
VII. The User as the Head Strategist
With over 178 meticulously designed user inputs, JINN is the ultimate "glass box" engine. The internal code is proprietary, but the control surface is transparent and grants you architectural-level command.
• Prototype Sophisticated Strategies : Test complex, multi-model theses at your own pace that would otherwise take weeks of coding. Want to test a strategy that uses a Lorentzian classifier driven by the EigenTrend, arbitrated by JSA in "highest score" mode, and filtered by a strict Markov trend gate? These can be configured and unified.
• Tune the Engine to Any Market : The inputs provide the control surface to optimise JINN's behaviour for specific assets and timeframes, from crypto scalping to swing trading indices.
• Build Trust Through Configuration : The granular controls allow you to align the script's behaviour precisely with your own market view, building trust in your own deployment of the tool.
JINN is a commitment. It is a tool for the serious analyst who seeks to move from discretionary trading to a systematic, quantitative, and adaptive approach. If this aligns with your philosophy, we invite you to apply for access.
Disclaimer
This script is for informational and educational purposes only. It does not constitute financial, investment, or trading advice, nor is it a recommendation to buy or sell any asset.
All trading and investment decisions are the sole responsibility of the user. It is strongly recommended to thoroughly test any strategy on a paper trading account for at least one week before risking real capital.
Trading financial markets involves a high risk of loss, and you may lose more than your initial investment. Past performance is not indicative of future results. The developer is not responsible for any losses incurred from the use of this script.
Lorentzianclassification

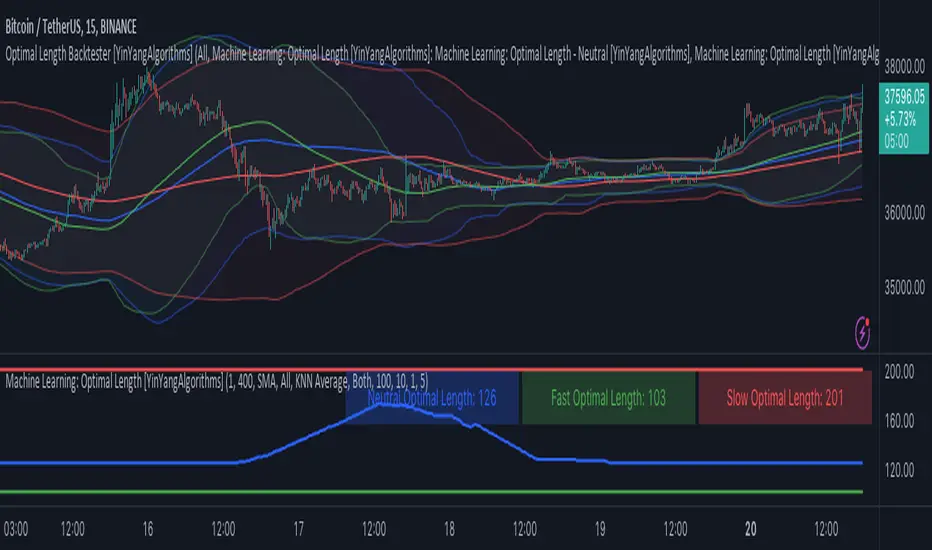
Machine Learning: Optimal Length [YinYangAlgorithms]This Indicator aims to solve an issue that most others face; static lengths. This Indicator will scan lengths from the Min to Max setting (1 - 400 by default) to calculate which is the most Optimal Length in the current market condition. Almost every Indicator uses a length in some part of their calculation, and this length is usually adjustable via the Settings; however it is generally a static fixed length. Static non changing lengths may not always produce optimal results. As market conditions change generally the optimal length will too. For this reason we have created this indicator.
This Indicator will create a Neutral (Min - Max Length), Fast (Min - Mid Length ((Max - Min) / 2)) and Slow (Mid Length ((Max - Min) / 2) - Max Length). This allows you to understand which the Optimal Fast, Slow and Neutral lengths are within the given Mix and Max length settings.
This Indicator then plots these Optimal Lengths as an Oscillator which can then be used within ANOTHER Indicator as a Source within its Settings. Stand alone this Indicator may not prove all that useful, however when its Lengths are inputted into another Indicator it may prove very useful. This allows other Indicators to use the Optimal Length within its calculations from the Settings rather than relying on simply a fixed length. Unfortunately this results in users needing to manually plug the Optimal Length plots into the second Indicator; but it also allows for endless possibilities with applying Machine Learning Optimal Lengths within both Traditional and Non-Traditional Indicators and may give other Pine Coders an easy and effective way to add Machine Learning auto adjustable lengths within their already created Indicators.
The beautiful part about this Indicator is that aside from inputting the Optimal Length Plot into another Indicator, there is no manual updating needed. When the Optimal Length changes, the change will automatically reflect in the other Indicator without the need for you to manually adjust its length. This may be very useful with both time preservation, as well as if there is an automated strategy based upon said Indicator that now won’t need manual intervention.
Tutorial:
By default this is what the Machine Learning: Optimal Length Indicator looks like. It is simply a way of both Displaying and Plotting our current Optimal Length so that we may then use it as a source within ANOTHER Indicator. This will allow the automation of an Optimal Length to be updated, rather than needing any manual input from yourself (aside from set up).
For instance if you set the start length to 1 and the end length to 400 (default settings), it will scan to find the optimal Length setting between 1 and 400. This features 3 types of lengths:
Fast (Green Line): 1-199 (from start length to half way of total)
Slow (Red Line): 200 - 400 (mid way to end length)
Neutral (Blue Line): 1 - 400 (start to end length)
By breaking down the Optimal Length detection into these 3 different types, we can see how the Optimal Length compares and changes based on the lengths allotted to them and how performance changes.
For instance, you may notice that both the Fast and Slow Optimal Length didn’t change much in the example above; however the Neutral Optimal Length changed quite a bit. This is due to the fact that the Neutral is inclusive of all lengths available and may be considered the more accurate due to that. However, this doesn’t mean the Fast and Slow lengths aren’t important and should be used. They may be useful for seeing how something fairs in a Fast and Slow standpoint.
If you change your TimeFrame from 15 minute to 1 Day, you’ll notice that the Optimal Lengths gravitate towards their upper bounds:
199 is max for Fast, it’s at 195
400 is max for Slow, its at 393
400 is max for Neutral, its at 399
The Optimal Length may move up to its upper bounds on Higher Time Frames because there is a lot of price action and long term data being displayed. This may lead to higher lengths performing better in a profitability standpoint since its data is based on so far back and such drastic price movements.
Below we’re going to go through a few examples, including the code so you may reproduce the example and have an understanding of how versatile Inputting an Optimal Length as a source may be within Traditional Indicators.
Adding the Machine Learning: Optimal Length to another Indicator:
You may add the Optimal Length to another Indicator as shown in the example above. In the example we are adding the ‘Machine Learning: Optimal Length - Neutral’ to our Neutral Length within the Settings. The external Indicator needs to have the ability to input the Optimal Length as a Source, this way it can automatically change within the external Indicator when the Optimal Length Indicator changes its Optimal Length.
Please note you may get an error within an external Indicator that accepts the Length as a Source if you don’t select the Machine Learning: Optimal Length. For instance, if you use ‘Close’ within BTC/USDT the length used would be ~36,000. This length is too long and will throw an error.
For this reason, we will ensure the Max Length that may be used is 1000.
Please note, on lower Time Frames you may need to adjust the Max Length. For instance if 20k bar data is used, the Max Length ‘may’ fail to load when going by default Min: 1 and Max: 400. Generally with most pairs it will load if your TradingView subscription is Premium or greater; however if it is less there is a chance it may fail. If it fails for you too often please lower the Max Length Amount; or send us a message we can look into a fix for this.
*** If it fails to load, please try removing the external Indicator and re-adding it and adding the Lengths back as a Source within the Settings. Sometimes it fails, but re-adding may fix it. If it keeps failing afterwards, reduce the Max Length Amount as mentioned above. ***
Simple Moving Average:
In this example above have the Fast, Slow and Neutral Optimal Length formatted as a Slow Moving Average. The first example is on the 15 minute Time Frame and the second is on the 1 Day Time Frame, demonstrating how the length changes based on the Time Frame and the effects it may have.
Here is the code for the example Indicator shown above. This example shows how you may use the Optimal Length as a Source and then use that Optimal Length and plot it as a Simple Moving Average:
//@version=5
indicator("Optimal Length - Backtesting - MA", overlay=true, max_bars_back=5000)
outputType = input.string("All", "Output Type", options= )
lengthSource = input.source(close, "Neutral Length")
lengthSource_fast = input.source(close, "Fast Length")
lengthSource_slow = input.source(close, "Slow Length")
showNeutral = outputType == "Neutral" or outputType == "Fast + Neutral" or outputType == "Slow + Neutral" or outputType == "All"
showFast = outputType == "Fast" or outputType == "Fast + Neutral" or outputType == "Fast + Slow" or outputType == "All"
showSlow = outputType == "Slow" or outputType == "Slow + Neutral" or outputType == "Fast + Slow" or outputType == "All"
//Neutral
optimalLength = math.min(math.max(math.round(lengthSource), 1), 1000)
optimalMA = ta.sma(close, optimalLength)
//Fast
optimalLength_fast = math.min(math.max(math.round(lengthSource_fast), 1), 1000)
optimalMA_fast = ta.sma(close, optimalLength_fast)
//Slow
optimalLength_slow = math.min(math.max(math.round(lengthSource_slow), 1), 1000)
optimalMA_slow = ta.sma(close, optimalLength_slow)
plot(showNeutral ? optimalMA : na, color=color.blue)
plot(showFast ? optimalMA_fast : na, color=color.green)
plot(showSlow ? optimalMA_slow : na, color=color.red)
Bollinger Bands:
In the two examples above for Bollinger Bands we have first the 15 Minute Time Frame and then the 1 Day Time Frame. As described above in ‘Adding the Machine Learning: Optimal Length to another Indicator’ sometimes it may fail to load, for this reason in the 15 Minute it was reduced to a max of 300 Length.
Bollinger Bands are a way to see a Simple Moving Average (SMA) that then uses Standard Deviation to identify how much deviation has occurred. This Deviation is than Added and Subtracted from the SMA to create the Bollinger Bands which help Identify possible movement zones that are ‘within range’. This may mean that the price may face Support / Resistance when it reaches the Outer / Inner bounds of the Bollinger Bands. Likewise, it may mean the Price is ‘Overbought’ when outside and above or ‘Underbought’ when outside and below the Bollinger Bands.
By applying All 3 different types of Optimal Lengths towards a Traditional Bollinger Band calculation we may hope to see different ranges of Bollinger Bands and how different lookback lengths may imply possible movement ranges on both a Short Term, Long Term and Neutral perspective. By seeing these possible ranges you may have the ability to identify more levels of Support and Resistance over different lengths and Trading Styles.
Below is the code for the Bollinger Bands example above:
//@version=5
indicator("Optimal Length - Backtesting - Bollinger Bands", overlay=true, max_bars_back=5000)
outputType = input.string("All", "Output Type", options= )
lengthSource = input.source(close, "Neutral Length")
lengthSource_fast = input.source(close, "Fast Length")
lengthSource_slow = input.source(close, "Slow Length")
showNeutral = outputType == "Neutral" or outputType == "Fast + Neutral" or outputType == "Slow + Neutral" or outputType == "All"
showFast = outputType == "Fast" or outputType == "Fast + Neutral" or outputType == "Fast + Slow" or outputType == "All"
showSlow = outputType == "Slow" or outputType == "Slow + Neutral" or outputType == "Fast + Slow" or outputType == "All"
mult = 2.0
src = close
neutralColor = color.blue
slowColor = color.red
fastColor = color.green
//Neutral
optimalLength = math.min(math.max(math.round(lengthSource), 1), 1000)
optimalMA = ta.sma(close, optimalLength)
//Fast
optimalLength_fast = math.min(math.max(math.round(lengthSource_fast), 1), 1000)
optimalMA_fast = ta.sma(close, optimalLength_fast)
//Slow
optimalLength_slow = math.min(math.max(math.round(lengthSource_slow), 1), 1000)
optimalMA_slow = ta.sma(close, optimalLength_slow)
//Neutral Bollinger Bands
dev = mult * ta.stdev(src, math.round(optimalLength))
upper = optimalMA + dev
lower = optimalMA - dev
plot(showNeutral ? optimalMA : na, "Neutral Basis", color=color.new(neutralColor, 0))
p1 = plot(showNeutral ? upper : na, "Neutral Upper", color=color.new(neutralColor, 50))
p2 = plot(showNeutral ? lower : na, "Neutral Lower", color=color.new(neutralColor, 50))
fill(p1, p2, title = "Neutral Background", color=color.new(neutralColor, 96))
//Slow Bollinger Bands
dev_slow = mult * ta.stdev(src, math.round(optimalLength_slow))
upper_slow = optimalMA_slow + dev_slow
lower_slow = optimalMA_slow - dev_slow
plot(showFast ? optimalMA_slow : na, "Slow Basis", color=color.new(slowColor, 0))
p1_slow = plot(showFast ? upper_slow : na, "Slow Upper", color=color.new(slowColor, 50))
p2_slow = plot(showFast ? lower_slow : na, "Slow Lower", color=color.new(slowColor, 50))
fill(p1_slow, p2_slow, title = "Slow Background", color=color.new(slowColor, 96))
//Fast Bollinger Bands
dev_fast = mult * ta.stdev(src, math.round(optimalLength_fast))
upper_fast = optimalMA_fast + dev_fast
lower_fast = optimalMA_fast - dev_fast
plot(showSlow ? optimalMA_fast : na, "Fast Basis", color=color.new(fastColor, 0))
p1_fast = plot(showSlow ? upper_fast : na, "Fast Upper", color=color.new(fastColor, 50))
p2_fast = plot(showSlow ? lower_fast : na, "Fast Lower", color=color.new(fastColor, 50))
fill(p1_fast, p2_fast, title = "Fast Background", color=color.new(fastColor, 96))
Donchian Channels:
Above you’ll see two examples of Machine Learning: Optimal Length applied to Donchian Channels. These are displayed with both the 15 Minute Time Frame and the 1 Day Time Frame.
Donchian Channels are a way of seeing potential Support and Resistance within a given lookback length. They are a way of withholding the High’s and Low’s of a specific lookback length and looking for deviation within this length. By applying our Fast, Slow and Neutral Machine Learning: Optimal Length to these Donchian Channels way may hope to achieve a viable range of High’s and Low’s that one may use to Identify Support and Resistance locations for different ranges of Optimal Lengths and likewise potentially different Trading Strategies.
The code to reproduce these Donchian Channels as displayed above is so:
//@version=5
indicator("Optimal Length - Backtesting - Donchian Channels", overlay=true, max_bars_back=5000)
outputType = input.string("All", "Output Type", options= )
lengthSource = input.source(close, "Neutral Length")
lengthSource_fast = input.source(close, "Fast Length")
lengthSource_slow = input.source(close, "Slow Length")
showNeutral = outputType == "Neutral" or outputType == "Fast + Neutral" or outputType == "Slow + Neutral" or outputType == "All"
showFast = outputType == "Fast" or outputType == "Fast + Neutral" or outputType == "Fast + Slow" or outputType == "All"
showSlow = outputType == "Slow" or outputType == "Slow + Neutral" or outputType == "Fast + Slow" or outputType == "All"
mult = 2.0
src = close
neutralColor = color.blue
slowColor = color.red
fastColor = color.green
//Neutral
optimalLength = math.min(math.max(math.round(lengthSource), 1), 1000)
optimalMA = ta.sma(close, optimalLength)
//Fast
optimalLength_fast = math.min(math.max(math.round(lengthSource_fast), 1), 1000)
optimalMA_fast = ta.sma(close, optimalLength_fast)
//Slow
optimalLength_slow = math.min(math.max(math.round(lengthSource_slow), 1), 1000)
optimalMA_slow = ta.sma(close, optimalLength_slow)
//Neutral Donchian Channels
lower_dc = ta.lowest(optimalLength)
upper_dc = ta.highest(optimalLength)
basis_dc = math.avg(upper_dc, lower_dc)
plot(showNeutral ? basis_dc : na, "Donchain Channel - Neutral Basis", color=color.new(neutralColor, 0))
u = plot(showNeutral ? upper_dc : na, "Donchain Channel - Neutral Upper", color=color.new(neutralColor, 50))
l = plot(showNeutral ? lower_dc : na, "Donchain Channel - Neutral Lower", color=color.new(neutralColor, 50))
fill(u, l, color=color.new(neutralColor, 96), title = "Donchain Channel - Neutral Background")
//Fast Donchian Channels
lower_dc_fast = ta.lowest(optimalLength_fast)
upper_dc_fast = ta.highest(optimalLength_fast)
basis_dc_fast = math.avg(upper_dc_fast, lower_dc_fast)
plot(showFast ? basis_dc_fast : na, "Donchain Channel - Fast Neutral Basis", color=color.new(fastColor, 0))
u_fast = plot(showFast ? upper_dc_fast : na, "Donchain Channel - Fast Upper", color=color.new(fastColor, 50))
l_fast = plot(showFast ? lower_dc_fast : na, "Donchain Channel - Fast Lower", color=color.new(fastColor, 50))
fill(u_fast, l_fast, color=color.new(fastColor, 96), title = "Donchain Channel - Fast Background")
//Slow Donchian Channels
lower_dc_slow = ta.lowest(optimalLength_slow)
upper_dc_slow = ta.highest(optimalLength_slow)
basis_dc_slow = math.avg(upper_dc_slow, lower_dc_slow)
plot(showSlow ? basis_dc_slow : na, "Donchain Channel - Slow Neutral Basis", color=color.new(slowColor, 0))
u_slow = plot(showSlow ? upper_dc_slow : na, "Donchain Channel - Slow Upper", color=color.new(slowColor, 50))
l_slow = plot(showSlow ? lower_dc_slow : na, "Donchain Channel - Slow Lower", color=color.new(slowColor, 50))
fill(u_slow, l_slow, color=color.new(slowColor, 96), title = "Donchain Channel - Slow Background")
Envelopes / Envelopes Adjusted:
Envelopes are an interesting one in the sense that they both may be perceived as useful; however we deem that with the use of an ‘Optimal Length’ that the ‘Envelopes Adjusted’ may work best. We will start with examples of the Traditional Envelope then showcase the Adjusted version.
Envelopes:
As you may see, a Traditional form of Envelopes even produced with our Machine Learning: Optimal Length may not produce optimal results. Unfortunately this may occur with some Traditional Indicators and they may need some adjustments as you’ll notice with the ‘Envelopes Adjusted’ version. However, even without the adjustments, these Envelopes may be useful for seeing ‘Overbought’ and ‘Oversold’ locations within a Machine Learning: Optimal Length standpoint.
Envelopes Adjusted:
By adding an adjustment to these Envelopes, we may hope to better reflect out Optimal Length within it. This is caused by adding a ratio reflection towards the current length of the Optimal Length and the max Length used. This allows for the Fast and Neutral (and potentially Slow if Neutral is greater) to achieve a potentially more accurate result.
Envelopes, much like Bollinger Bands are a way of seeing potential movement zones along with potential Support and Resistance. However, unlike Bollinger Bands which are based on Standard Deviation, Envelopes are based on percentages +/- from the Simple Moving Average.
The code used to reproduce the example above is as follows:
//@version=5
indicator("Optimal Length - Backtesting - Envelopes", overlay=true, max_bars_back=5000)
outputType = input.string("All", "Output Type", options= )
displayType = input.string("Envelope Adjusted", "Display Type", options= )
lengthSource = input.source(close, "Neutral Length")
lengthSource_fast = input.source(close, "Fast Length")
lengthSource_slow = input.source(close, "Slow Length")
showNeutral = outputType == "Neutral" or outputType == "Fast + Neutral" or outputType == "Slow + Neutral" or outputType == "All"
showFast = outputType == "Fast" or outputType == "Fast + Neutral" or outputType == "Fast + Slow" or outputType == "All"
showSlow = outputType == "Slow" or outputType == "Slow + Neutral" or outputType == "Fast + Slow" or outputType == "All"
mult = 2.0
src = close
neutralColor = color.blue
slowColor = color.red
fastColor = color.green
//Neutral
optimalLength = math.min(math.max(math.round(lengthSource), 1), 1000)
optimalMA = ta.sma(close, optimalLength)
//Fast
optimalLength_fast = math.min(math.max(math.round(lengthSource_fast), 1), 1000)
optimalMA_fast = ta.sma(close, optimalLength_fast)
//Slow
optimalLength_slow = math.min(math.max(math.round(lengthSource_slow), 1), 1000)
optimalMA_slow = ta.sma(close, optimalLength_slow)
percent = 10.0
maxAmount = math.max(optimalLength, optimalLength_fast, optimalLength_slow)
//Neutral
k = displayType == "Envelope" ? percent/100.0 : (percent/100.0) / (optimalLength / maxAmount)
upper_env = optimalMA * (1 + k)
lower_env = optimalMA * (1 - k)
plot(showNeutral ? optimalMA : na, "Envelope - Neutral Basis", color=color.new(neutralColor, 0))
u_env = plot(showNeutral ? upper_env : na, "Envelope - Neutral Upper", color=color.new(neutralColor, 50))
l_env = plot(showNeutral ? lower_env : na, "Envelope - Neutral Lower", color=color.new(neutralColor, 50))
fill(u_env, l_env, color=color.new(neutralColor, 96), title = "Envelope - Neutral Background")
//Fast
k_fast = displayType == "Envelope" ? percent/100.0 : (percent/100.0) / (optimalLength_fast / maxAmount)
upper_env_fast = optimalMA_fast * (1 + k_fast)
lower_env_fast = optimalMA_fast * (1 - k_fast)
plot(showFast ? optimalMA_fast : na, "Envelope - Fast Basis", color=color.new(fastColor, 0))
u_env_fast = plot(showFast ? upper_env_fast : na, "Envelope - Fast Upper", color=color.new(fastColor, 50))
l_env_fast = plot(showFast ? lower_env_fast : na, "Envelope - Fast Lower", color=color.new(fastColor, 50))
fill(u_env_fast, l_env_fast, color=color.new(fastColor, 96), title = "Envelope - Fast Background")
//Slow
k_slow = displayType == "Envelope" ? percent/100.0 : (percent/100.0) / (optimalLength_slow / maxAmount)
upper_env_slow = optimalMA_slow * (1 + k_slow)
lower_env_slow = optimalMA_slow * (1 - k_slow)
plot(showSlow ? optimalMA_slow : na, "Envelope - Slow Basis", color=color.new(slowColor, 0))
u_env_slow = plot(showSlow ? upper_env_slow : na, "Envelope - Slow Upper", color=color.new(slowColor, 50))
l_env_slow = plot(showSlow ? lower_env_slow : na, "Envelope - Slow Lower", color=color.new(slowColor, 50))
fill(u_env_slow, l_env_slow, color=color.new(slowColor, 96), title = "Envelope - Slow Background")
Hopefully these examples, including reproducing code, have given you some insight as to how useful this Machine Learning: Optimal Length may be and how another Indicator may easily modify their existing code to incorporate the usage of such Machine Learning: Optimal Length. We likewise will publish a Backtesting Indicator which incorporates all of the concepts we’ve gone over within here; in case you wish to take advantage of the Traditional Indicators mentioned above that allow the input of Machine Learning: Optimal Length and don’t wish to code them.
If you have any questions, comments, ideas or concerns please don't hesitate to contact us.
HAPPY TRADING!
Machine Learning: VWAP [YinYangAlgorithms]Machine Learning: VWAP aims to use Machine Learning to Identify the best location to Anchor the VWAP at. Rather than using a traditional fixed length or simply adjusting based on a Date / Time; by applying Machine Learning we may hope to identify crucial areas which make sense to reset the VWAP and start anew. VWAP’s may act similar to a Bollinger Band in the sense that they help to identify both Overbought and Oversold Price locations based on previous movements and help to identify how far the price may move within the current Trend. However, unlike Bollinger Bands, VWAPs have the ability to parabolically get quite spaced out and also reset. For this reason, the price may never actually go from the Lower to the Upper and vice versa (when very spaced out; when the Upper and Lower zones are narrow, it may bounce between the two). The reason for this is due to how the anchor location is calculated and in this specific Indicator, how it changes anchors based on price movement calculated within Machine Learning.
This Indicator changes the anchor if the Low < Lowest Low of a length of X and likewise if the High > Highest High of a length of X. This logic is applied within a Machine Learning standpoint that likewise amplifies this Lookback Length by adding a Machine Learning Length to it and increasing the lookback length even further.
Due to how the anchor for this VWAP changes, you may notice that the Basis Line (Orange) may act as a Trend Identifier. When the Price is above the basis line, it may represent a bullish trend; and likewise it may represent a bearish trend when below it. You may also notice what may happen is when the trend occurs, it may push all the way to the Upper or Lower levels of this VWAP. It may then proceed to move horizontally until the VWAP expands more and it may gain more movement; or it may correct back to the Basis Line. If it corrects back to the basis line, what may happen is it either uses the Basis Line as a Support and continues in its current direction, or it will change the VWAP anchor and start anew.
Tutorial:
If we zoom in on the most recent VWAP we can see how it expands. Expansion may be caused by time but generally it may be caused by price movement and volume. Exponential Price movement causes the VWAP to expand, even if there are corrections to it. However, please note Volume adds a large weighted factor to the calculation; hence Volume Weighted Average Price (VWAP).
If you refer to the white circle in the example above; you’ll be able to see that the VWAP expanded even while the price was correcting to the Basis line. This happens due to exponential movement which holds high volume. If you look at the volume below the white circle, you’ll notice it was very large; however even though there was exponential price movement after the white circle, since the volume was low, the VWAP didn’t expand much more than it already had.
There may be times where both Volume and Price movement isn’t significant enough to cause much of an expansion. During this time it may be considered to be in a state of consolidation. While looking at this example, you may also notice the color switch from red to green to red. The color of the VWAP is related to the movement of the Basis line (Orange middle line). When the current basis is > the basis of the previous bar the color of the VWAP is green, and when the current basis is < the basis of the previous bar, the color of the VWAP is red. The color may help you gauge the current directional movement the price is facing within the VWAP.
You may have noticed there are signals within this Indicator. These signals are composed of Green and Red Triangles which represent potential Bullish and Bearish momentum changes. The Momentum changes happen when the Signal Type:
The High/Low or Close (You pick in settings)
Crosses one of the locations within the VWAP.
Bullish Momentum change signals occur when :
Signal Type crosses OVER the Basis
Signal Type crosses OVER the lower level
Bearish Momentum change signals occur when:
Signal Type crosses UNDER the Basis
Signal Type Crosses UNDER the upper level
These signals may represent locations where momentum may occur in the direction of these signals. For these reasons there are also alerts available to be set up for them.
If you refer to the two circles within the example above, you may see that when the close goes above the basis line, how it mat represents bullish momentum. Likewise if it corrects back to the basis and the basis acts as a support, it may continue its bullish momentum back to the upper levels again. However, if you refer to the red circle, you’ll see if the basis fails to act as a support, it may then start to correct all the way to the lower levels, or depending on how expanded the VWAP is, it may just reset its anchor due to such drastic movement.
You also have the ability to disable Machine Learning by setting ‘Machine Learning Type’ to ‘None’. If this is done, it will go off whether you have it set to:
Bullish
Bearish
Neutral
For the type of VWAP you want to see. In this example above we have it set to ‘Bullish’. Non Machine Learning VWAP are still calculated using the same logic of if low < lowest low over length of X and if high > highest high over length of X.
Non Machine Learning VWAP’s change much quicker but may also allow the price to correct from one side to the other without changing VWAP Anchor. They may be useful for breaking up a trend into smaller pieces after momentum may have changed.
Above is an example of how the Non Machine Learning VWAP looks like when in Bearish. As you can see based on if it is Bullish or Bearish is how it favors the trend to be and may likewise dictate when it changes the Anchor.
When set to neutral however, the Anchor may change quite quickly. This results in a still useful VWAP to help dictate possible zones that the price may move within, but they’re also much tighter zones that may not expand the same way.
We will conclude this Tutorial here, hopefully this gives you some insight as to why and how Machine Learning VWAPs may be useful; as well as how to use them.
Settings:
VWAP:
VWAP Type: Type of VWAP. You can favor specific direction changes or let it be Neutral where there is even weight to both. Please note, these do not apply to the Machine Learning VWAP.
Source: VWAP Source. By default VWAP usually uses HLC3; however OHLC4 may help by providing more data.
Lookback Length: The Length of this VWAP when it comes to seeing if the current High > Highest of this length; or if the current Low is < Lowest of this length.
Standard VWAP Multiplier: This multiplier is applied only to the Standard VWMA. This is when 'Machine Learning Type' is set to 'None'.
Machine Learning:
Use Rational Quadratics: Rationalizing our source may be beneficial for usage within ML calculations.
Signal Type: Bullish and Bearish Signals are when the price crosses over/under the basis, as well as the Upper and Lower levels. These may act as indicators to where price movement may occur.
Machine Learning Type: Are we using a Simple ML Average, KNN Mean Average, KNN Exponential Average or None?
KNN Distance Type: We need to check if distance is within the KNN Min/Max distance, which distance checks are we using.
Machine Learning Length: How far back is our Machine Learning going to keep data for.
k-Nearest Neighbour (KNN) Length: How many k-Nearest Neighbours will we account for?
Fast ML Data Length: What is our Fast ML Length? This is used with our Slow Length to create our KNN Distance.
Slow ML Data Length: What is our Slow ML Length? This is used with our Fast Length to create our KNN Distance.
If you have any questions, comments, ideas or concerns please don't hesitate to contact us.
HAPPY TRADING!

Machine Learning: Optimal RSI [YinYangAlgorithms]This Indicator, will rate multiple different lengths of RSIs to determine which RSI to RSI MA cross produced the highest profit within the lookback span. This ‘Optimal RSI’ is then passed back, and if toggled will then be thrown into a Machine Learning calculation. You have the option to Filter RSI and RSI MA’s within the Machine Learning calculation. What this does is, only other Optimal RSI’s which are in the same bullish or bearish direction (is the RSI above or below the RSI MA) will be added to the calculation.
You can either (by default) use a Simple Average; which is essentially just a Mean of all the Optimal RSI’s with a length of Machine Learning. Or, you can opt to use a k-Nearest Neighbour (KNN) calculation which takes a Fast and Slow Speed. We essentially turn the Optimal RSI into a MA with different lengths and then compare the distance between the two within our KNN Function.
RSI may very well be one of the most used Indicators for identifying crucial Overbought and Oversold locations. Not only that but when it crosses its Moving Average (MA) line it may also indicate good locations to Buy and Sell. Many traders simply use the RSI with the standard length (14), however, does that mean this is the best length?
By using the length of the top performing RSI and then applying some Machine Learning logic to it, we hope to create what may be a more accurate, smooth, optimal, RSI.
Tutorial:
This is a pretty zoomed out Perspective of what the Indicator looks like with its default settings (except with Bollinger Bands and Signals disabled). If you look at the Tables above, you’ll notice, currently the Top Performing RSI Length is 13 with an Optimal Profit % of: 1.00054973. On its default settings, what it does is Scan X amount of RSI Lengths and checks for when the RSI and RSI MA cross each other. It then records the profitability of each cross to identify which length produced the overall highest crossing profitability. Whichever length produces the highest profit is then the RSI length that is used in the plots, until another length takes its place. This may result in what we deem to be the ‘Optimal RSI’ as it is an adaptive RSI which changes based on performance.
In our next example, we changed the ‘Optimal RSI Type’ from ‘All Crossings’ to ‘Extremity Crossings’. If you compare the last two examples to each other, you’ll notice some similarities, but overall they’re quite different. The reason why is, the Optimal RSI is calculated differently. When using ‘All Crossings’ everytime the RSI and RSI MA cross, we evaluate it for profit (short and long). However, with ‘Extremity Crossings’, we only evaluate it when the RSI crosses over the RSI MA and RSI <= 40 or RSI crosses under the RSI MA and RSI >= 60. We conclude the crossing when it crosses back on its opposite of the extremity, and that is how it finds its Optimal RSI.
The way we determine the Optimal RSI is crucial to calculating which length is currently optimal.
In this next example we have zoomed in a bit, and have the full default settings on. Now we have signals (which you can set alerts for), for when the RSI and RSI MA cross (green is bullish and red is bearish). We also have our Optimal RSI Bollinger Bands enabled here too. These bands allow you to see where there may be Support and Resistance within the RSI at levels that aren’t static; such as 30 and 70. The length the RSI Bollinger Bands use is the Optimal RSI Length, allowing it to likewise change in correlation to the Optimal RSI.
In the example above, we’ve zoomed out as far as the Optimal RSI Bollinger Bands go. You’ll notice, the Bollinger Bands may act as Support and Resistance locations within and outside of the RSI Mid zone (30-70). In the next example we will highlight these areas so they may be easier to see.
Circled above, you may see how many times the Optimal RSI faced Support and Resistance locations on the Bollinger Bands. These Bollinger Bands may give a second location for Support and Resistance. The key Support and Resistance may still be the 30/50/70, however the Bollinger Bands allows us to have a more adaptive, moving form of Support and Resistance. This helps to show where it may ‘bounce’ if it surpasses any of the static levels (30/50/70).
Due to the fact that this Indicator may take a long time to execute and it can throw errors for such, we have added a Setting called: Adjust Optimal RSI Lookback and RSI Count. This settings will automatically modify the Optimal RSI Lookback Length and the RSI Count based on the Time Frame you are on and the Bar Indexes that are within. For instance, if we switch to the 1 Hour Time Frame, it will adjust the length from 200->90 and RSI Count from 30->20. If this wasn’t adjusted, the Indicator would Timeout.
You may however, change the Setting ‘Adjust Optimal RSI Lookback and RSI Count’ to ‘Manual’ from ‘Auto’. This will give you control over the ‘Optimal RSI Lookback Length’ and ‘RSI Count’ within the Settings. Please note, it will likely take some “fine tuning” to find working settings without the Indicator timing out, but there are definitely times you can find better settings than our ‘Auto’ will create; especially on higher Time Frames. The Minimum our ‘Auto’ will create is:
Optimal RSI Lookback Length: 90
RSI Count: 20
The Maximum it will create is:
Optimal RSI Lookback Length: 200
RSI Count: 30
If there isn’t much bar index history, for instance, if you’re on the 1 Day and the pair is BTC/USDT you’ll get < 4000 Bar Indexes worth of data. For this reason it is possible to manually increase the settings to say:
Optimal RSI Lookback Length: 500
RSI Count: 50
But, please note, if you make it too high, it may also lead to inaccuracies.
We will conclude our Tutorial here, hopefully this has given you some insight as to how calculating our Optimal RSI and then using it within Machine Learning may create a more adaptive RSI.
Settings:
Optimal RSI:
Show Crossing Signals: Display signals where the RSI and RSI Cross.
Show Tables: Display Information Tables to show information like, Optimal RSI Length, Best Profit, New Optimal RSI Lookback Length and New RSI Count.
Show Bollinger Bands: Show RSI Bollinger Bands. These bands work like the TDI Indicator, except its length changes as it uses the current RSI Optimal Length.
Optimal RSI Type: This is how we calculate our Optimal RSI. Do we use all RSI and RSI MA Crossings or just when it crosses within the Extremities.
Adjust Optimal RSI Lookback and RSI Count: Auto means the script will automatically adjust the Optimal RSI Lookback Length and RSI Count based on the current Time Frame and Bar Index's on chart. This will attempt to stop the script from 'Taking too long to Execute'. Manual means you have full control of the Optimal RSI Lookback Length and RSI Count.
Optimal RSI Lookback Length: How far back are we looking to see which RSI length is optimal? Please note the more bars the lower this needs to be. For instance with BTC/USDT you can use 500 here on 1D but only 200 for 15 Minutes; otherwise it will timeout.
RSI Count: How many lengths are we checking? For instance, if our 'RSI Minimum Length' is 4 and this is 30, the valid RSI lengths we check is 4-34.
RSI Minimum Length: What is the RSI length we start our scans at? We are capped with RSI Count otherwise it will cause the Indicator to timeout, so we don't want to waste any processing power on irrelevant lengths.
RSI MA Length: What length are we using to calculate the optimal RSI cross' and likewise plot our RSI MA with?
Extremity Crossings RSI Backup Length: When there is no Optimal RSI (if using Extremity Crossings), which RSI should we use instead?
Machine Learning:
Use Rational Quadratics: Rationalizing our Close may be beneficial for usage within ML calculations.
Filter RSI and RSI MA: Should we filter the RSI's before usage in ML calculations? Essentially should we only use RSI data that are of the same type as our Optimal RSI? For instance if our Optimal RSI is Bullish (RSI > RSI MA), should we only use ML RSI's that are likewise bullish?
Machine Learning Type: Are we using a Simple ML Average, KNN Mean Average, KNN Exponential Average or None?
KNN Distance Type: We need to check if distance is within the KNN Min/Max distance, which distance checks are we using.
Machine Learning Length: How far back is our Machine Learning going to keep data for.
k-Nearest Neighbour (KNN) Length: How many k-Nearest Neighbours will we account for?
Fast ML Data Length: What is our Fast ML Length? This is used with our Slow Length to create our KNN Distance.
Slow ML Data Length: What is our Slow ML Length? This is used with our Fast Length to create our KNN Distance.
If you have any questions, comments, ideas or concerns please don't hesitate to contact us.
HAPPY TRADING!

Machine Learning: SuperTrend Strategy TP/SL [YinYangAlgorithms]The SuperTrend is a very useful Indicator to display when trends have shifted based on the Average True Range (ATR). Its underlying ideology is to calculate the ATR using a fixed length and then multiply it by a factor to calculate the SuperTrend +/-. When the close crosses the SuperTrend it changes direction.
This Strategy features the Traditional SuperTrend Calculations with Machine Learning (ML) and Take Profit / Stop Loss applied to it. Using ML on the SuperTrend allows for the ability to sort data from previous SuperTrend calculations. We can filter the data so only previous SuperTrends that follow the same direction and are within the distance bounds of our k-Nearest Neighbour (KNN) will be added and then averaged. This average can either be achieved using a Mean or with an Exponential calculation which puts added weight on the initial source. Take Profits and Stop Losses are then added to the ML SuperTrend so it may capitalize on Momentum changes meanwhile remaining in the Trend during consolidation.
By applying Machine Learning logic and adding a Take Profit and Stop Loss to the Traditional SuperTrend, we may enhance its underlying calculations with potential to withhold the trend better. The main purpose of this Strategy is to minimize losses and false trend changes while maximizing gains. This may be achieved by quick reversals of trends where strategic small losses are taken before a large trend occurs with hopes of potentially occurring large gain. Due to this logic, the Win/Loss ratio of this Strategy may be quite poor as it may take many small marginal losses where there is consolidation. However, it may also take large gains and capitalize on strong momentum movements.
Tutorial:
In this example above, we can get an idea of what the default settings may achieve when there is momentum. It focuses on attempting to hit the Trailing Take Profit which moves in accord with the SuperTrend just with a multiplier added. When momentum occurs it helps push the SuperTrend within it, which on its own may act as a smaller Trailing Take Profit of its own accord.
We’ve highlighted some key points from the last example to better emphasize how it works. As you can see, the White Circle is where profit was taken from the ML SuperTrend simply from it attempting to switch to a Bullish (Buy) Trend. However, that was rejected almost immediately and we went back to our Bearish (Sell) Trend that ended up resulting in our Take Profit being hit (Yellow Circle). This Strategy aims to not only capitalize on the small profits from SuperTrend to SuperTrend but to also capitalize when the Momentum is so strong that the price moves X% away from the SuperTrend and is able to hit the Take Profit location. This Take Profit addition to this Strategy is crucial as momentum may change state shortly after such drastic price movements; and if we were to simply wait for it to come back to the SuperTrend, we may lose out on lots of potential profit.
If you refer to the Yellow Circle in this example, you’ll notice what was talked about in the Summary/Overview above. During periods of consolidation when there is little momentum and price movement and we don’t have any Stop Loss activated, you may see ‘Signal Flashing’. Signal Flashing is when there are Buy and Sell signals that keep switching back and forth. During this time you may be taking small losses. This is a normal part of this Strategy. When a signal has finally been confirmed by Momentum, is when this Strategy shines and may produce the profit you desire.
You may be wondering, what causes these jagged like patterns in the SuperTrend? It's due to the ML logic, and it may be a little confusing, but essentially what is happening is the Fast Moving SuperTrend and the Slow Moving SuperTrend are creating KNN Min and Max distances that are extreme due to (usually) parabolic movement. This causes fewer values to be added to and averaged within the ML and causes less smooth and more exponential drastic movements. This is completely normal, and one of the perks of using k-Nearest Neighbor for ML calculations. If you don’t know, the Min and Max Distance allowed is derived from the most recent(0 index of data array) to KNN Length. So only SuperTrend values that exhibit distances within these Min/Max will be allowed into the average.
Since the KNN ML logic can cause these exponential movements in the SuperTrend, they likewise affect its Take Profit. The Take Profit may benefit from this movement like displayed in the example above which helped it claim profit before then exhibiting upwards movement.
By default our Stop Loss Multiplier is kept quite low at 0.0000025. Keeping it low may help to reduce some Signal Flashing while not taking extra losses more so than not using it at all. However, if we increase it even more to say 0.005 like is shown in the example above. It can really help the trend keep momentum. Please note, although previous results don’t imply future results, at 0.0000025 Stop Loss we are currently exhibiting 69.27% profit while at 0.005 Stop Loss we are exhibiting 33.54% profit. This just goes to show that although there may be less Signal Flashing, it may not result in more profit.
We will conclude our Tutorial here. Hopefully this has given you some insight as to how Machine Learning, combined with Trailing Take Profit and Stop Loss may have positive effects on the SuperTrend when turned into a Strategy.
Settings:
SuperTrend:
ATR Length: ATR Length used to create the Original Supertrend.
Factor: Multiplier used to create the Original Supertrend.
Stop Loss Multiplier: 0 = Don't use Stop Loss. Stop loss can be useful for helping to prevent false signals but also may result in more loss when hit and less profit when switching trends.
Take Profit Multiplier: Take Profits can be useful within the Supertrend Strategy to stop the price reverting all the way to the Stop Loss once it's been profitable.
Machine Learning:
Only Factor Same Trend Direction: Very useful for ensuring that data used in KNN is not manipulated by different SuperTrend Directional data. Please note, it doesn't affect KNN Exponential.
Rationalized Source Type: Should we Rationalize only a specific source, All or None?
Machine Learning Type: Are we using a Simple ML Average, KNN Mean Average, KNN Exponential Average or None?
Machine Learning Smoothing Type: How should we smooth our Fast and Slow ML Datas to be used in our KNN Distance calculation? SMA, EMA or VWMA?
KNN Distance Type: We need to check if distance is within the KNN Min/Max distance, which distance checks are we using.
Machine Learning Length: How far back is our Machine Learning going to keep data for.
k-Nearest Neighbour (KNN) Length: How many k-Nearest Neighbours will we account for?
Fast ML Data Length: What is our Fast ML Length?? This is used with our Slow Length to create our KNN Distance.
Slow ML Data Length: What is our Slow ML Length?? This is used with our Fast Length to create our KNN Distance.
If you have any questions, comments, ideas or concerns please don't hesitate to contact us.
HAPPY TRADING!

Machine Learning: Donchian DCA Grid Strategy [YinYangAlgorithms]This strategy uses a Machine Learning approach on the Donchian Channels with a DCA and Grid purchase/sell Strategy. Not only that, but it uses a custom Bollinger calculation to determine its Basis which is used as a mild sell location. This strategy is a pure DCA strategy in the sense that no shorts are used and theoretically it can be used in webhooks on most exchanges as it’s only using Spot Orders. The idea behind this strategy is we utilize both the Highest Highs and Lowest Lows within a Machine Learning standpoint to create Buy and Sell zones. We then fraction these zones off into pieces to create Grids. This allows us to ‘micro’ purchase as it enters these zones and likewise ‘micro’ sell as it goes up into the upper (sell) zones.
You have the option to set how many grids are used, by default we use 100 with max 1000. These grids can be ‘stacked’ together if a single bar is to go through multiple at the same time. For instance, if a bar goes through 30 grids in one bar, it will have a buy/sell power of 30x. Stacking Grid Buy and (sometimes) Sells is a very crucial part of this strategy that allows it to purchase multitudes during crashes and capitalize on sales during massive pumps.
With the grids, you’ll notice there is a middle line within the upper and lower part that makes the grid. As a Purchase Type within our Settings this is identified as ‘Middle of Zone Purchase Amount In USDT’. The middle of the grid may act as the strongest grid location (aside from maybe the bottom). Therefore there is a specific purchase amount for this Grid location.
This DCA Strategy also features two other purchase methods. Most importantly is its ‘Purchase More’ type. Essentially it will attempt to purchase when the Highest High or Lowest Low moves outside of the Outer band. For instance, the Lowest Low becomes Lower or the Higher High becomes Higher. When this happens may be a good time to buy as it is featuring a new High or Low over an extended period.
The last but not least Purchase type within this Strategy is what we call a ‘Strong Buy’. The reason for this is its verified by the following:
The outer bounds have been pushed (what causes a ‘Purchase More’)
The Price has crossed over the EMA 21
It has been verified through MACD, RSI or MACD Historical (Delta) using Regular and Hidden Divergence (Note, only 1 of these verifications is required and it can be any).
By default we don’t have Purchase Amount for ‘Strong Buy’ set, but that doesn’t mean it can’t be viable, it simply means we have only seen a few pairs where it actually proved more profitable allocating money there rather than just increasing the purchase amount for ‘Purchase More’ or ‘Grids’.
Now that you understand where we BUY, we should discuss when we SELL.
This Strategy features 3 crucial sell locations, and we will discuss each individually as they are very important.
1. ‘Sell Some At’: Here there are 4 different options, by default its set to ‘Both’ but you can change it around if you want. Your options are:
‘Both’ - You will sell some at both locations. The amount sold is the % used at ‘Sell Some %’.
‘Basis Line’ - You will sell some when the price crosses over the Basis Line. The amount sold is the % used at ‘Sell Some %’.
‘Percent’ - You will sell some when the Close is >= X% between the Lower Inner and Upper Inner Zone.
‘None’ - This simply means don’t ever Sell Some.
2. Sell Grids. Sell Grids are exactly like purchase grids and feature the same amount of grids. You also have the ability to ‘Stack Grid Sells’, which basically means if a bar moves multiple grids, it will stack the amount % wise you will sell, rather than just selling the default amount. Sell Grids use a DCA logic but for selling, which we deem may help adjust risk/reward ratio for selling, especially if there is slow but consistent bullish movement. It causes these grids to constantly push up and therefore when the close is greater than them, accrue more profit.
3. Take Profit. Take profit occurs when the close first goes above the Take Profit location (Teal Line) and then Closes below it. When Take Profit occurs, ALL POSITIONS WILL BE SOLD. What may happen is the price enters the Sell Grid, doesn’t go all the way to the top ‘Exiting it’ and then crashes back down and closes below the Take Profit. Take Profit is a strong location which generally represents a strong profit location, and that a strong momentum has changed which may cause the price to revert back to the buy grid zone.
Keep in mind, if you have (by default) ‘Only Sell If Profit’ toggled, all sell locations will only create sell orders when it is profitable to do so. Just cause it may be a good time to sell, doesn’t mean based on your DCA it is. In our opinion, only selling when it is profitable to do so is a key part of the DCA purchase strategy.
You likewise have the ability to ‘Only Buy If Lower than DCA’, which is likewise by default. These two help keep the Yin and Yang by balancing each other out where you’re only purchasing and selling when it makes logical sense too, even if that involves ignoring a signal and waiting for a better opportunity.
Tutorial:
Like most of our Strategies, we try to capitalize on lower Time Frames, generally the 15 minutes so we may find optimal entry and exit locations while still maintaining a strong correlation to trend patterns.
First off, let’s discuss examples of how this Strategy works prior to applying Machine Learning (enabled by default).
In this example above we have disabled the showing of ‘Potential Buy and Sell Signals’ so as to declutter the example. In here you can see where actual trades had gone through for both buying and selling and get an idea of how the strategy works. We also have disabled Machine Learning for this example so you can see the hard lines created by the Donchian Channel. You can also see how the Basis line ‘white line’ may act as a good location to ‘Sell Some’ and that it moves quite irregularly compared to the Donchian Channel. This is due to the fact that it is based on two custom Bollinger Bands to create the basis line.
Here we zoomed out even further and moved back a bit to where there were dense clusters of buy and sell orders. Sometimes when the price is rather volatile you’ll see it ‘Ping Pong’ back and forth between the buy and sell zones quite quickly. This may be very good for your trades and profit as a whole, especially if ‘Only Buy If Lower Than DCA’ and ‘Only Sell If Profit’ are both enabled; as these toggles will ensure you are:
Always lowering your Average when buying
Always making profit when selling
By default 8% commission is added to the Strategy as well, to simulate the cost effects of if these trades were taking place on an actual exchange.
In this example we also turned on the visuals for our ‘Purchase More’ (orange line) and ‘Take Profit’ (teal line) locations. These are crucial locations. The Purchase More makes purchases when the bottom of the grid has been moved (may dictate strong price movement has occurred and may be potential for correction). Our Take Profit may help secure profit when a momentum change is happening and all of the Sell Grids weren’t able to be used.
In the example above we’ve enabled Buy and Sell Signals so that you can see where the Take Profit and Purchase More signals have occurred. The white circle demonstrates that not all of the Position Size was sold within the Sell Grids, and therefore it was ALL CLOSED when the price closed below the Take Profit Line (Teal).
Then, when the bottom of the Donchian Channel was pushed further down due to the close (within the yellow circle), a Purchase More Signal was triggered.
When the close keeps pushing the bottom of the Buy Grid lower, it can cause multiple Purchase More Signals to occur. This is normal and also a crucial part of this strategy to help lower your DCA. Please note, the Purchase More won’t trigger a Buy if the Close is greater than the DCA and you have ‘Only Purchase If Lower Than DCA’ activated.
By turning on Machine Learning (default settings) the Buy and Sell Grid Zones are smoothed out more. It may cause it to look quite a bit different. Machine Learning although it looks much worse, may help increase the profit this Strategy can produce. Previous results DO NOT mean future results, but in this example, prior to turning on Machine Learning it had produced 37% Profit in ~5 months and with Machine Learning activated it is now up to 57% Profit in ~5 months.
Machine Learning causes the Strategy to focus less on Grids and more on Purchase More when it comes to getting its entries. However, if you likewise attempt to focus on Purchase More within non Machine Learning, the locations are different and therefore the results may not be as profitable.
PLEASE NOTE:
By default this strategy uses 1,000,000 as its initial capital. The amount it purchases in its Settings is relevant to this Initial capital. Considering this is a DCA Strategy, we only want to ‘Micro’ Buy and ‘Micro’ Sell whenever conditions are met.
Therefore, if you increase the Initial Capital, you’ll likewise want to increase the Purchase Amounts within the Settings and Vice Versa. For instance, if you wish to set the Initial Capital to 10,000, you should likewise can the amounts in the Settings to 1% of what they are to account for this.
We may change the Purchase Amounts to be based on %’s in a later update if it is requested.
We will conclude this Tutorial here, hopefully you can see how a DCA Grid Purchase Model applied to Machine Learning Donchian Channels may be useful for making strategic purchases in low and high zones.
Settings:
Display Data:
Show Potential Buy Locations: These locations are where 'Potentially' orders can be placed. Placement of orders is dependant on if you have 'Only Buy If Lower Than DCA' toggled and the Price is lower than DCA. It also is effected by if you actually have any money left to purchase with; you can't buy if you have no money left!
Show Potential Sell Locations: These locations are where 'Potentially' orders will be sold. If 'Only Sell If Profit' is toggled, the sell will only happen if you'll make profit from it!
Show Grid Locations: Displaying won't affect your trades but it can be useful to see where trades will be placed, as well as which have gone through and which are left to be purchased. Max 100 Grids, but visuals will only be shown if its 20 or less.
Purchase Settings:
Only Buy if its lower than DCA: Generally speaking, we want to lower our Average, and therefore it makes sense to only buy when the close is lower than our current DCA and a Purchase Condition is met.
Compound Purchases: Compounding Purchases means reinvesting profit back into your trades right away. It drastically increases profits, but it also increases risk too. It will adjust your Purchase Amounts for the Purchase Type you have set at the same % rate of strategy initial_capital to the amounts you have set.
Adjust Purchase Amount Ratio to Maintain Risk level: By adjusting purchase levels we generally help maintain a safe risk level. Basically we generally want to reserve X amount of % for each purchase type being used and relocate money when there is too much in one type. This helps balance out purchase amounts and ensure the types selected have a correct ratio to ensure they can place the right amount of orders.
Stack Grid Buys: Stacking Buy Grids is when the Close crosses multiple Buy Grids within the same bar. Should we still only purchase the value of 1 Buy Grid OR stack the grid buys based on how many buy grids it went through.
Purchase Type: Where do you want to make Purchases? We recommend lowering your risk by combining All purchase types, but you may also customize your trading strategy however you wish.
Strong Buy Purchase Amount In USDT: How much do you want to purchase when the 'Strong Buy' signal appears? This signal only occurs after it has at least entered the Buy Zone and there have been other verifications saying it's now a good time to buy. Our Strong Buy Signal is a very strong indicator that a large price movement towards the Sell Zone will likely occur. It almost always results in it leaving the Buy Zone and usually will go to at least the White Basis line where you can 'Sell Some'.
Buy More Purchase Amount In USDT: How much should you purchase when the 'Purchase More' signal appears? This 'Purchase More' signal occurs when the lowest level of the Buy Zone moves lower. This is a great time to buy as you're buying the dip and generally there is a correction that will allow you to 'Sell Some' for some profit.
Amount of Grid Buy and Sells: How many Grid Purchases do you want to make? We recommend having it at the max of 10, as it will essentially get you a better Average Purchase Price, but you may adjust it to whatever you wish. This amount also only matters if your Purchase Type above incorporates Grid Purchases. Max 100 Grids, but visuals will only be shown if it's 20 or less.
Each Grid Purchase Amount In USDT: How much should you purchase after closing under a grid location? Keep in mind, if you have 10 grids and it goes through each, it will be this amount * 10. Grid purchasing is a great way to get a good entry, lower risk and also lower your average.
Middle Of Zone Purchase Amount In USDT: The Middle Of Zone is the strongest grid location within the Buy Zone. This is why we have a unique Purchase Amount for this Grid specifically. Please note you need to have 'Middle of Zone is a Grid' enabled for this Purchase Amount to be used.
Sell:
Only Sell if its Profit: There is a chance that during a dump, all your grid buys when through, and a few Purchase More Signals have appeared. You likely got a good entry. A Strong Buy may also appear before it starts to pump to the Sell Zone. The issue that may occur is your Average Purchase Price is greater than the 'Sell Some' price and/or the Grids in the Sell Zone and/or the Strong Sell Signal. When this happens, you can either take a loss and sell it, or you can hold on to it and wait for more purchase signals to therefore lower your average more so you can take profit at the next sell location. Please backtest this yourself within our YinYang Purchase Strategy on the pair and timeframe you are wanting to trade on. Please also note, that previous results will not always reflect future results. Please assess the risk yourself. Don't trade what you can't afford to lose. Sometimes it is better to strategically take a loss and continue on making profit than to stay in a bad trade for a long period of time.
Stack Grid Sells: Stacking Sell Grids is when the Close crosses multiple Sell Grids within the same bar. Should we still only sell the value of 1 Sell Grid OR stack the grid sells based on how many sell grids it went through.
Stop Loss Type: This is when the Close has pushed the Bottom of the Buy Grid More. Do we Stop Loss or Purchase More?? By default we recommend you stay true to the DCA part of this strategy by Purchasing More, but this is up to you.
Sell Some At: Where if selected should we 'Sell Some', this may be an important way to sell a little bit at a good time before the price may correct. Also, we don't want to sell too much incase it doesn't correct though, so its a 'Sell Some' location. Basis Line refers to our Moving Basis Line created from 2 Bollinger Bands and Percent refers to a Percent difference between the Lower Inner and Upper Inner bands.
Sell Some At Percent Amount: This refers to how much % between the Lower Inner and Upper Inner bands we should well at if we chose to 'Sell Some'.
Sell Some Min %: This refers to the Minimum amount between the Lower Inner band and Close that qualifies a 'Sell Some'. This acts as a failsafe so we don't 'Sell Some' for too little.
Sell % At Strong Sell Signal: How much do we sell at the 'Strong Sell' Signal? It may act as a strong location to sell, but likewise Grid Sells could be better.
Grid and Donchian Settings:
Donchian Channel Length: How far back are we looking back to determine our Donchian Channel.
Extra Outer Buy Width %: How much extra should we push the Outer Buy (Low) Width by?
Extra Inner Buy Width %: How much extra should we push the Inner Buy (Low) Width by?
Extra Inner Sell Width %: How much extra should we push the Inner Sell (High) Width by?
Extra Outer Sell Width %: How much extra should we push the Outer Sell (High) Width by?
Machine Learning:
Rationalized Source Type: Donchians usually use High/Low. What Source is our Rationalized Source using?
Machine Learning Type: Are we using a Simple ML Average, KNN Mean Average, KNN Exponential Average or None?
Machine Learning Length: How far back is our Machine Learning going to keep data for.
k-Nearest Neighbour (KNN) Length: How many k-Nearest Neighbours will we account for?
Fast ML Data Length: What is our Fast ML Length?? This is used with our Slow Length to create our KNN Distance.
Slow ML Data Length: What is our Slow ML Length?? This is used with our Fast Length to create our KNN Distance.
If you have any questions, comments, ideas or concerns please don't hesitate to contact us.
HAPPY TRADING!

Machine Learning: Trend Lines [YinYangAlgorithms]Trend lines have always been a key indicator that may help predict many different types of price movements. They have been well known to create different types of formations such as: Pennants, Channels, Flags and Wedges. The type of formation they create is based on how the formation was created and the angle it was created. For instance, if there was a strong price increase and then there is a Wedge where both end points meet, this is considered a Bull Pennant. The formations Trend Lines create may be powerful tools that can help predict current Support and Resistance and also Future Momentum changes. However, not all Trend Lines will create formations, and alone they may stand as strong Support and Resistance locations on the Vertical.
The purpose of this Indicator is to apply Machine Learning logic to a Traditional Trend Line Calculation, and therefore allowing a new approach to a modern indicator of high usage. The results of such are quite interesting and goes to show the impacts a simple KNN Machine Learning model can have on Traditional Indicators.
Tutorial:
There are a few different settings within this Indicator. Many will greatly impact the results and if any are changed, lots will need ‘Fine Tuning’. So let's discuss the main toggles that have great effects and what they do before discussing the lengths. Currently in this example above we have the Indicator at its Default Settings. In this example, you can see how the Trend Lines act as key Support and Resistance locations. Due note, Support and Resistance are a relative term, as is their color. What starts off as Support or Resistance may change when the price crosses over / under them.
In the example above we have zoomed in and circled locations that exhibited markers of Support and Resistance along the Trend Lines. These Trend Lines are all created using the Default Settings. As you can see from the example above; just because it is a Green Upwards Trend Line, doesn’t mean it’s a Support Line. Support and Resistance is always shifting on Trend Lines based on the prices location relative to them.
We won’t go through all the Formations Trend Lines make, but the example above, we can see the Trend Lines formed a Downward Channel. Channels are when there are two parallel downwards Trend Lines that are at a relatively similar angle. This means that they won’t ever meet. What may happen when the price is within these channels, is it may bounce between the upper and lower bounds. These Channels may drive the price upwards or downwards, depending on if it is in an Upwards or Downwards Channel.
If you refer to the example above, you’ll notice that the Trend Lines are formed like traditional Trend Lines. They don’t stem from current Highs and Lows but rather Machine Learning Highs and Lows. More often than not, the Machine Learning approach to Trend Lines cause their start point and angle to be quite different than a Traditional Trend Line. Due to this, it may help predict Support and Resistance locations at are more uncommon and therefore can be quite useful.
In the example above we have turned off the toggle in Settings ‘Use Exponential Data Average’. This Settings uses a custom Exponential Data Average of the KNN rather than simply averaging the KNN. By Default it is enabled, but as you can see when it is disabled it may create some pretty strong lasting Trend Lines. This is why we advise you ZOOM OUT AS FAR AS YOU CAN. Trend Lines are only displayed when you’ve zoomed out far enough that their Start Point is visible.
As you can see in this example above, there were 3 major Upward Trend Lines created in 2020 that have had a major impact on Support and Resistance Locations within the last year. Lets zoom in and get a closer look.
We have zoomed in for this example above, and circled some of the major Support and Resistance locations that these Upward Trend Lines may have had a major impact on.
Please note, these Machine Learning Trend Lines aren’t a ‘One Size Fits All’ kind of thing. They are completely customizable within the Settings, so that you can get a tailored experience based on what Pair and Time Frame you are trading on.
When any values are changed within the Settings, you’ll likely need to ‘Fine Tune’ the rest of the settings until your desired result is met. By default the modifiable lengths within the Settings are:
Machine Learning Length: 50
KNN Length:5
Fast ML Data Length: 5
Slow ML Data Length: 30
For example, let's toggle ‘Use Exponential Data Averages’ back on and change ‘Fast ML Data Length’ from 5 to 20 and ‘Slow ML Data Length’ from 30 to 50.
As you can in the example above, all of the lines have changed. Although there are still some strong Support Locations created by the Upwards Trend Lines.
We will conclude our Tutorial here. Hopefully you’ve learned how to use Machine Learning Trend Lines and will be able to now see some more unorthodox Support and Resistance locations on the Vertical.
Settings:
Use Machine Learning Sources: If disabled Traditional Trend line sources (High and Low) will be used rather than Rational Quadratics.
Use KNN Distance Sorting: You can disable this if you wish to not have the Machine Learning Data sorted using KNN. If disabled trend line logic will be Traditional.
Use Exponential Data Average: This Settings uses a custom Exponential Data Average of the KNN rather than simply averaging the KNN.
Machine Learning Length: How strong is our Machine Learning Memory? Please note, when this value is too high the data is almost 'too' much and can lead to poor results.
K-Nearest Neighbour (KNN) Length: How many K-Nearest Neighbours are allowed with our Distance Clustering? Please note, too high or too low may lead to poor results.
Fast ML Data Length: Fast and Slow speed needs to be adjusted properly to see results. 3/5/7 all seem to work well for Fast.
Slow ML Data Length: Fast and Slow speed needs to be adjusted properly to see results. 20 - 50 all seem to work well for Slow.
If you have any questions, comments, ideas or concerns please don't hesitate to contact us.
HAPPY TRADING!
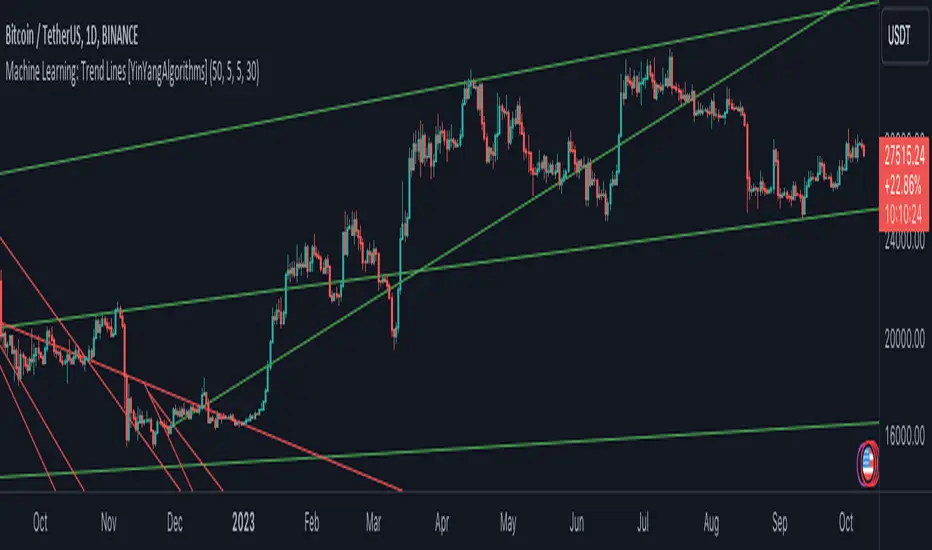
Machine Learning : Cosine Similarity & Euclidean DistanceIntroduction:
This script implements a comprehensive trading strategy that adheres to the established rules and guidelines of housing trading. It leverages advanced machine learning techniques and incorporates customised moving averages, including the Conceptive Price Moving Average (CPMA), to provide accurate signals for informed trading decisions in the housing market. Additionally, signal processing techniques such as Lorentzian, Euclidean distance, Cosine similarity, Know sure thing, Rational Quadratic, and sigmoid transformation are utilised to enhance the signal quality and improve trading accuracy.
Features:
Market Analysis: The script utilizes advanced machine learning methods such as Lorentzian, Euclidean distance, and Cosine similarity to analyse market conditions. These techniques measure the similarity and distance between data points, enabling more precise signal identification and enhancing trading decisions.
Cosine similarity:
Cosine similarity is a measure used to determine the similarity between two vectors, typically in a high-dimensional space. It calculates the cosine of the angle between the vectors, indicating the degree of similarity or dissimilarity.
In the context of trading or signal processing, cosine similarity can be employed to compare the similarity between different data points or signals. The vectors in this case represent the numerical representations of the data points or signals.
Cosine similarity ranges from -1 to 1, with 1 indicating perfect similarity, 0 indicating no similarity, and -1 indicating perfect dissimilarity. A higher cosine similarity value suggests a closer match between the vectors, implying that the signals or data points share similar characteristics.
Lorentzian Classification:
Lorentzian classification is a machine learning algorithm used for classification tasks. It is based on the Lorentzian distance metric, which measures the similarity or dissimilarity between two data points. The Lorentzian distance takes into account the shape of the data distribution and can handle outliers better than other distance metrics.
Euclidean Distance:
Euclidean distance is a distance metric widely used in mathematics and machine learning. It calculates the straight-line distance between two points in Euclidean space. In two-dimensional space, the Euclidean distance between two points (x1, y1) and (x2, y2) is calculated using the formula sqrt((x2 - x1)^2 + (y2 - y1)^2).
Dynamic Time Windows: The script incorporates a dynamic time window function that allows users to define specific time ranges for trading. It checks if the current time falls within the specified window to execute the relevant trading signals.
Custom Moving Averages: The script includes the CPMA, a powerful moving average calculation. Unlike traditional moving averages, the CPMA provides improved support and resistance levels by considering multiple price types and employing a combination of Exponential Moving Averages (EMAs) and Simple Moving Averages (SMAs). Its adaptive nature ensures responsiveness to changes in price trends.
Signal Processing Techniques: The script applies signal processing techniques such as Know sure thing, Rational Quadratic, and sigmoid transformation to enhance the quality of the generated signals. These techniques improve the accuracy and reliability of the trading signals, aiding in making well-informed trading decisions.
Trade Statistics and Metrics: The script provides comprehensive trade statistics and metrics, including total wins, losses, win rate, win-loss ratio, and early signal flips. These metrics offer valuable insights into the performance and effectiveness of the trading strategy.
Usage:
Configuring Time Windows: Users can customize the time windows by specifying the start and finish time ranges according to their trading preferences and local market conditions.
Signal Interpretation: The script generates long and short signals based on the analysis, custom moving averages, and signal processing techniques. Users should pay attention to these signals and take appropriate action, such as entering or exiting trades, depending on their trading strategies.
Trade Statistics: The script continuously tracks and updates trade statistics, providing users with a clear overview of their trading performance. These statistics help users assess the effectiveness of the strategy and make informed decisions.
Conclusion:
With its adherence to housing trading rules, advanced machine learning methods, customized moving averages like the CPMA, and signal processing techniques such as Lorentzian, Euclidean distance, Cosine similarity, Know sure thing, Rational Quadratic, and sigmoid transformation, this script offers users a powerful tool for housing market analysis and trading. By leveraging the provided signals, time windows, and trade statistics, users can enhance their trading strategies and improve their overall trading performance.
Disclaimer:
Please note that while this script incorporates established tradingview housing rules, advanced machine learning techniques, customized moving averages, and signal processing techniques, it should be used for informational purposes only. Users are advised to conduct their own analysis and exercise caution when making trading decisions. The script's performance may vary based on market conditions, user settings, and the accuracy of the machine learning methods and signal processing techniques. The trading platform and developers are not responsible for any financial losses incurred while using this script.
By publishing this script on the platform, traders can benefit from its professional presentation, clear instructions, and the utilisation of advanced machine learning techniques, customised moving averages, and signal processing techniques for enhanced trading signals and accuracy.
I extend my gratitude to TradingView, LUX ALGO, and JDEHORTY for their invaluable contributions to the trading community. Their innovative scripts, meticulous coding patterns, and insightful ideas have profoundly enriched traders' strategies, including my own.

Lorentzian Classification Strategy Based in the model of Machine learning: Lorentzian Classification by @jdehorty, you will be able to get into trending moves and get interesting entries in the market with this strategy. I also put some new features for better backtesting results!
Backtesting context: 2022-07-19 to 2023-04-14 of US500 1H by PEPPERSTONE. Commissions: 0.03% for each entry, 0.03% for each exit. Risk per trade: 2.5% of the total account
For this strategy, 3 indicators are used:
Machine learning: Lorentzian Classification by @jdehorty
One Ema of 200 periods for identifying the trend
Supertrend indicator as a filter for some exits
Atr stop loss from Gatherio
Trade conditions:
For longs:
Close price is above 200 Ema
Lorentzian Classification indicates a buying signal
This gives us our long signal. Stop loss will be determined by atr stop loss (white point), break even(blue point) by a risk/reward ratio of 1:1 and take profit of 3:1 where half position will be closed. This will be showed as buy.
The other half will be closed when the model indicates a selling signal or Supertrend indicator gives a bearish signal. This will be showed as cl buy.
For shorts:
Close price is under 200 Ema
Lorentzian Classification indicates a selling signal
This gives us our short signal. Stop loss will be determined by atr stop loss (white point), break even(blue point) by a risk/reward ratio of 1:1 and take profit of 3:1 where half position will be closed. This will be showed as sell.
The other half will be closed when the model indicates a buying signal or Supertrend indicator gives a bullish signal. This will be showed as cl sell.
Risk management
To calculate the amount of the position you will use just a small percent of your initial capital for the strategy and you will use the atr stop loss or last swing for this.
Example: You have 1000 usd and you just want to risk 2,5% of your account, there is a buy signal at price of 4,000 usd. The stop loss price from atr stop loss or last swing is 3,900. You calculate the distance in percent between 4,000 and 3,900. In this case, that distance would be of 2.50%. Then, you calculate your position by this way: (initial or current capital * risk per trade of your account) / (stop loss distance).
Using these values on the formula: (1000*2,5%)/(2,5%) = 1000usd. It means, you have to use 1000 usd for risking 2.5% of your account.
We will use this risk management for applying compound interest.
> In settings, with position amount calculator, you can enter the amount in usd of your account and the amount in percentage for risking per trade of the account. You will see this value in green color in the upper left corner that shows the amount in usd to use for risking the specific percentage of your account.
> You can also choose a fixed amount, so you will have to activate fixed amount in risk management for trades and set the fixed amount for backtesting.
Script functions
Inside of settings, you will find some utilities for display atr stop loss, break evens, positions, signals, indicators, a table of some stats from backtesting, etc.
You will find the settings for risk management at the end of the script if you want to change something or trying new values for other assets for backtesting.
If you want to change the initial capital for backtest the strategy, go to properties, and also enter the commisions of your exchange and slippage for more realistic results.
In risk managment you can find an option called "Use leverage ?", activate this if you want to backtest using leverage, which means that in case of not having enough money for risking the % determined by you of your account using your initial capital, you will use leverage for using the enough amount for risking that % of your acount in a buy position. Otherwise, the amount will be limited by your initial/current capital
I also added a function for backtesting if you had added or withdrawn money frequently:
Adding money: You can choose how often you want to add money (Monthly, yearly, daily or weekly). Then a fixed amount of money and activate or deactivate this function
Withdraw money: You can choose if you want to withdraw a fixed amount or a percentage of earnings. Then you can choose a fixed amount of money, the period of time and activate or deactivate this function. Also, the percentage of earnings if you choosed this option.
Some other assets where strategy has worked
BTCUSD 4H, 1D
ETHUSD 4H, 1D
BNBUSD 4H
SPX 1D
BANKNIFTY 4H, 15 min
Some things to consider
USE UNDER YOUR OWN RISK. PAST RESULTS DO NOT REPRESENT THE FUTURE.
DEPENDING OF % ACCOUNT RISK PER TRADE, YOU COULD REQUIRE LEVERAGE FOR OPEN SOME POSITIONS, SO PLEASE, BE CAREFULL AND USE CORRECTLY THE RISK MANAGEMENT
Do not forget to change commissions and other parameters related with back testing results!. If you have problems loading the script reduce max bars back number in general settings
Strategies for trending markets use to have more looses than wins and it takes a long time to get profits, so do not forget to be patient and consistent !
Please, visit the post from @jdehorty called Machine Learning: Lorentzian Classification for a better understanding of his script!
Any support and boosts will be well received. If you have any question, do not doubt to ask!

Lorentzian ML [Sublime Traders]Lorentzian ML
Context: The whole idea of this indicator is to use the Lorentzian Classifier (a popular machine learning model suited for analyzing data in a time series) , add some oscillators and filter them with volume averages in order to get precise swing move indications.
The Lorentzian ML indicator uses the Lorenzian Classifier (LDC) algorithm that takes into account the Commodity Channel Index (CCI) and Relative Strength Index (RSI) signals as raw material to provide buy and sell signals. The indicator is accompanied by take profit , stop loss and entry lines based on the Average True Range (ATR).
Features:
1. Lorentzian Classifier:
Uses the difference between the current and previous values of CCI and RSI to generate buy and sell signals.
The classifier threshold can be adjusted using the input parameter.
2. ATR-based Take Profit Line:
A horizontal take profit line is plotted when buy or sell signals occur.
The line is based on the ATR value and a user-defined multiplier.
3. VMA filtering
Using the simple switches: Scalper, Swing or Holder , the users can easily filter the frequency of the signals in addition to the lookback and threshold filters. This will affect the used VMA lines that use data gathered from multiple timeframes.
Visual Representation:
The indicator plots green candles for buy signals and red candles for sell signals.
Buy and sell labels are displayed on the chart to mark the points where signals occur.
The ATR-based take profit line is displayed in a user-defined color and line width.
Visual representation of the VMA lines : Red - bearish , Blue - uncertain , Green - bullish
Changes and features to come
Fix "holder" switch on sell side that sometimes bugs the whole chart.
Add more intuitive filtering methods.
Add two more oscillators to the Lorentzian pool.
Create switches for Lorentzian source.
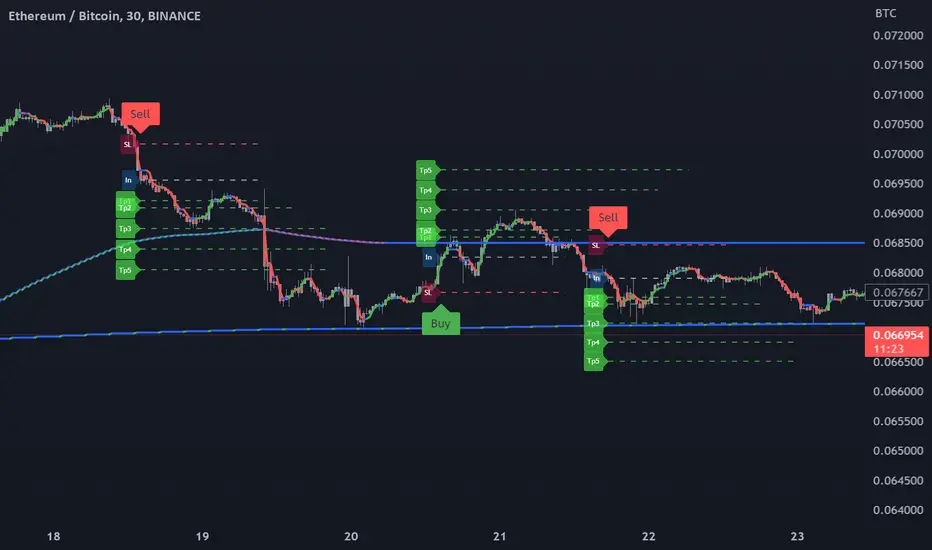
Machine Learning: Lorentzian Classification█ OVERVIEW
A Lorentzian Distance Classifier (LDC) is a Machine Learning classification algorithm capable of categorizing historical data from a multi-dimensional feature space. This indicator demonstrates how Lorentzian Classification can also be used to predict the direction of future price movements when used as the distance metric for a novel implementation of an Approximate Nearest Neighbors (ANN) algorithm.
█ BACKGROUND
In physics, Lorentzian space is perhaps best known for its role in describing the curvature of space-time in Einstein's theory of General Relativity (2). Interestingly, however, this abstract concept from theoretical physics also has tangible real-world applications in trading.
Recently, it was hypothesized that Lorentzian space was also well-suited for analyzing time-series data (4), (5). This hypothesis has been supported by several empirical studies that demonstrate that Lorentzian distance is more robust to outliers and noise than the more commonly used Euclidean distance (1), (3), (6). Furthermore, Lorentzian distance was also shown to outperform dozens of other highly regarded distance metrics, including Manhattan distance, Bhattacharyya similarity, and Cosine similarity (1), (3). Outside of Dynamic Time Warping based approaches, which are unfortunately too computationally intensive for PineScript at this time, the Lorentzian Distance metric consistently scores the highest mean accuracy over a wide variety of time series data sets (1).
Euclidean distance is commonly used as the default distance metric for NN-based search algorithms, but it may not always be the best choice when dealing with financial market data. This is because financial market data can be significantly impacted by proximity to major world events such as FOMC Meetings and Black Swan events. This event-based distortion of market data can be framed as similar to the gravitational warping caused by a massive object on the space-time continuum. For financial markets, the analogous continuum that experiences warping can be referred to as "price-time".
Below is a side-by-side comparison of how neighborhoods of similar historical points appear in three-dimensional Euclidean Space and Lorentzian Space:
This figure demonstrates how Lorentzian space can better accommodate the warping of price-time since the Lorentzian distance function compresses the Euclidean neighborhood in such a way that the new neighborhood distribution in Lorentzian space tends to cluster around each of the major feature axes in addition to the origin itself. This means that, even though some nearest neighbors will be the same regardless of the distance metric used, Lorentzian space will also allow for the consideration of historical points that would otherwise never be considered with a Euclidean distance metric.
Intuitively, the advantage inherent in the Lorentzian distance metric makes sense. For example, it is logical that the price action that occurs in the hours after Chairman Powell finishes delivering a speech would resemble at least some of the previous times when he finished delivering a speech. This may be true regardless of other factors, such as whether or not the market was overbought or oversold at the time or if the macro conditions were more bullish or bearish overall. These historical reference points are extremely valuable for predictive models, yet the Euclidean distance metric would miss these neighbors entirely, often in favor of irrelevant data points from the day before the event. By using Lorentzian distance as a metric, the ML model is instead able to consider the warping of price-time caused by the event and, ultimately, transcend the temporal bias imposed on it by the time series.
For more information on the implementation details of the Approximate Nearest Neighbors (ANN) algorithm used in this indicator, please refer to the detailed comments in the source code.
█ HOW TO USE
Below is an explanatory breakdown of the different parts of this indicator as it appears in the interface:
Below is an explanation of the different settings for this indicator:
General Settings:
Source - This has a default value of "hlc3" and is used to control the input data source.
Neighbors Count - This has a default value of 8, a minimum value of 1, a maximum value of 100, and a step of 1. It is used to control the number of neighbors to consider.
Max Bars Back - This has a default value of 2000.
Feature Count - This has a default value of 5, a minimum value of 2, and a maximum value of 5. It controls the number of features to use for ML predictions.
Color Compression - This has a default value of 1, a minimum value of 1, and a maximum value of 10. It is used to control the compression factor for adjusting the intensity of the color scale.
Show Exits - This has a default value of false. It controls whether to show the exit threshold on the chart.
Use Dynamic Exits - This has a default value of false. It is used to control whether to attempt to let profits ride by dynamically adjusting the exit threshold based on kernel regression.
Feature Engineering Settings:
Note: The Feature Engineering section is for fine-tuning the features used for ML predictions. The default values are optimized for the 4H to 12H timeframes for most charts, but they should also work reasonably well for other timeframes. By default, the model can support features that accept two parameters (Parameter A and Parameter B, respectively). Even though there are only 4 features provided by default, the same feature with different settings counts as two separate features. If the feature only accepts one parameter, then the second parameter will default to EMA-based smoothing with a default value of 1. These features represent the most effective combination I have encountered in my testing, but additional features may be added as additional options in the future.
Feature 1 - This has a default value of "RSI" and options are: "RSI", "WT", "CCI", "ADX".
Feature 2 - This has a default value of "WT" and options are: "RSI", "WT", "CCI", "ADX".
Feature 3 - This has a default value of "CCI" and options are: "RSI", "WT", "CCI", "ADX".
Feature 4 - This has a default value of "ADX" and options are: "RSI", "WT", "CCI", "ADX".
Feature 5 - This has a default value of "RSI" and options are: "RSI", "WT", "CCI", "ADX".
Filters Settings:
Use Volatility Filter - This has a default value of true. It is used to control whether to use the volatility filter.
Use Regime Filter - This has a default value of true. It is used to control whether to use the trend detection filter.
Use ADX Filter - This has a default value of false. It is used to control whether to use the ADX filter.
Regime Threshold - This has a default value of -0.1, a minimum value of -10, a maximum value of 10, and a step of 0.1. It is used to control the Regime Detection filter for detecting Trending/Ranging markets.
ADX Threshold - This has a default value of 20, a minimum value of 0, a maximum value of 100, and a step of 1. It is used to control the threshold for detecting Trending/Ranging markets.
Kernel Regression Settings:
Trade with Kernel - This has a default value of true. It is used to control whether to trade with the kernel.
Show Kernel Estimate - This has a default value of true. It is used to control whether to show the kernel estimate.
Lookback Window - This has a default value of 8 and a minimum value of 3. It is used to control the number of bars used for the estimation. Recommended range: 3-50
Relative Weighting - This has a default value of 8 and a step size of 0.25. It is used to control the relative weighting of time frames. Recommended range: 0.25-25
Start Regression at Bar - This has a default value of 25. It is used to control the bar index on which to start regression. Recommended range: 0-25
Display Settings:
Show Bar Colors - This has a default value of true. It is used to control whether to show the bar colors.
Show Bar Prediction Values - This has a default value of true. It controls whether to show the ML model's evaluation of each bar as an integer.
Use ATR Offset - This has a default value of false. It controls whether to use the ATR offset instead of the bar prediction offset.
Bar Prediction Offset - This has a default value of 0 and a minimum value of 0. It is used to control the offset of the bar predictions as a percentage from the bar high or close.
Backtesting Settings:
Show Backtest Results - This has a default value of true. It is used to control whether to display the win rate of the given configuration.
█ WORKS CITED
(1) R. Giusti and G. E. A. P. A. Batista, "An Empirical Comparison of Dissimilarity Measures for Time Series Classification," 2013 Brazilian Conference on Intelligent Systems, Oct. 2013, DOI: 10.1109/bracis.2013.22.
(2) Y. Kerimbekov, H. Ş. Bilge, and H. H. Uğurlu, "The use of Lorentzian distance metric in classification problems," Pattern Recognition Letters, vol. 84, 170–176, Dec. 2016, DOI: 10.1016/j.patrec.2016.09.006.
(3) A. Bagnall, A. Bostrom, J. Large, and J. Lines, "The Great Time Series Classification Bake Off: An Experimental Evaluation of Recently Proposed Algorithms." ResearchGate, Feb. 04, 2016.
(4) H. Ş. Bilge, Yerzhan Kerimbekov, and Hasan Hüseyin Uğurlu, "A new classification method by using Lorentzian distance metric," ResearchGate, Sep. 02, 2015.
(5) Y. Kerimbekov and H. Şakir Bilge, "Lorentzian Distance Classifier for Multiple Features," Proceedings of the 6th International Conference on Pattern Recognition Applications and Methods, 2017, DOI: 10.5220/0006197004930501.
(6) V. Surya Prasath et al., "Effects of Distance Measure Choice on KNN Classifier Performance - A Review." .
█ ACKNOWLEDGEMENTS
@veryfid - For many invaluable insights, discussions, and advice that helped to shape this project.
@capissimo - For open sourcing his interesting ideas regarding various KNN implementations in PineScript, several of which helped inspire my original undertaking of this project.
@RikkiTavi - For many invaluable physics-related conversations and for his helping me develop a mechanism for visualizing various distance algorithms in 3D using JavaScript
@jlaurel - For invaluable literature recommendations that helped me to understand the underlying subject matter of this project.
@annutara - For help in beta-testing this indicator and for sharing many helpful ideas and insights early on in its development.
@jasontaylor7 - For helping to beta-test this indicator and for many helpful conversations that helped to shape my backtesting workflow
@meddymarkusvanhala - For helping to beta-test this indicator
@dlbnext - For incredibly detailed backtesting testing of this indicator and for sharing numerous ideas on how the user experience could be improved.
