[MACLEN] TRUE RANGEThis is a true range (TR) based strategy with weighted moving average (WMA) smoothing to remove noise.
In addition, it includes a risk management strategy using 4 "safes" in the same operation to always seek to make a profit.
This is for evaluation only, and it is not recommended to use with real money.
It is a work in progress. I read your comments.
Đường Trung bình trượt

Combo 2/20 EMA & Bear Power This is combo strategies for get a cumulative signal.
First strategy
This indicator plots 2/20 exponential moving average. For the Mov
Avg X 2/20 Indicator, the EMA bar will be painted when the Alert criteria is met.
Second strategy
Bear Power Indicator
To get more information please see "Bull And Bear Balance Indicator"
by Vadim Gimelfarb.
WARNING:
- For purpose educate only
- This script to change bars colors.
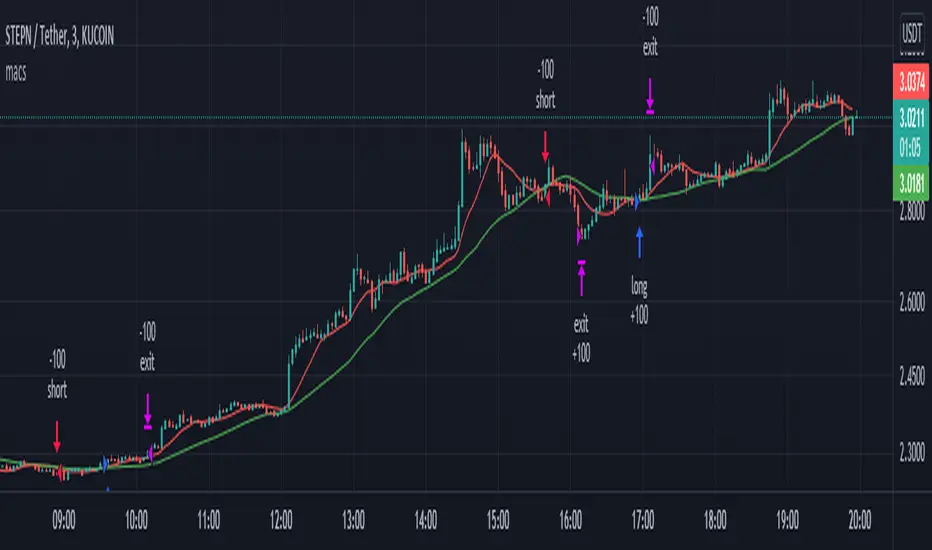
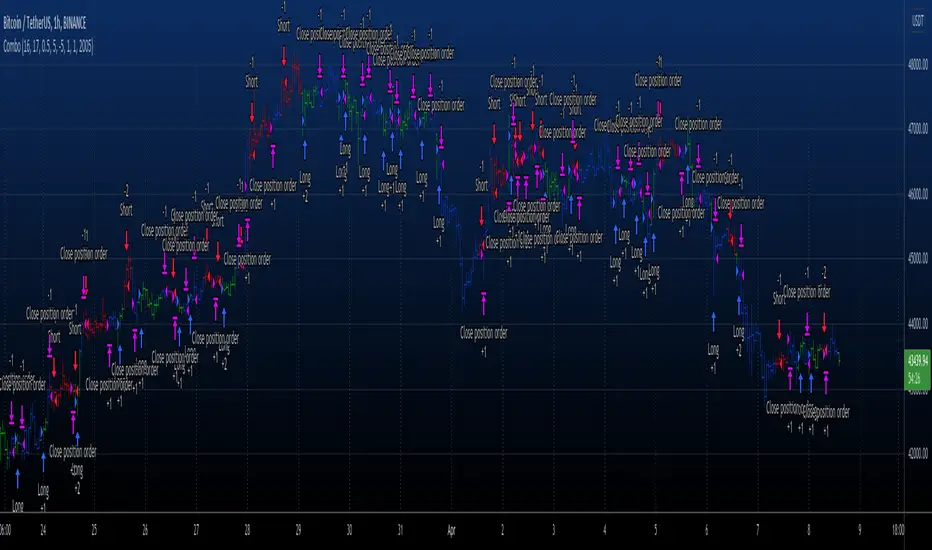
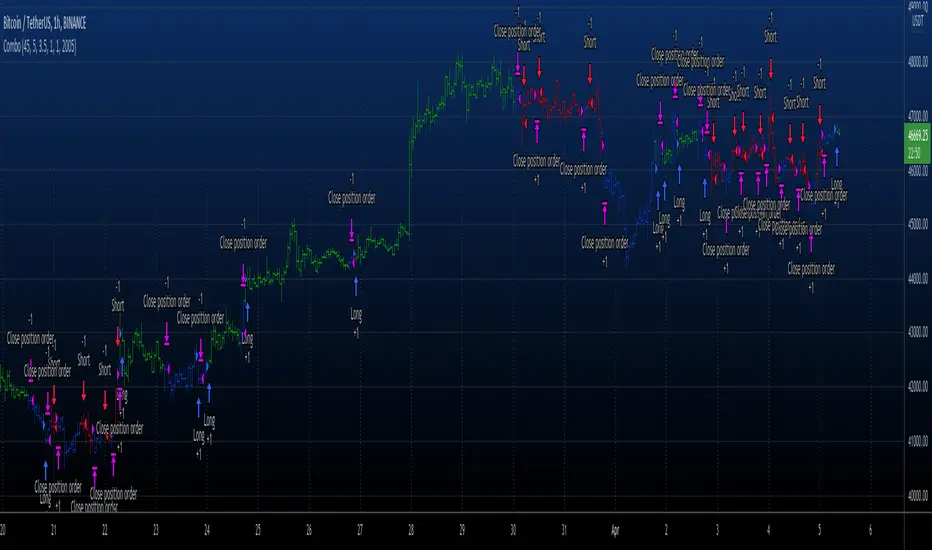
MA cross strategyI created an sma (10/30) strategy.
The script is under construction and can be changed, since i'm looking for a more profitable strategy.
If you have ideas to make it more profitable, please comment.
It is possible to change everything to your own needs.
MilleMachineHello traders,
I hereby present to you the second stage of my journey to finding a reliable, profitable trading strategy.
The "Millemachine" is based on the "Millebot", my previous published strategy. This means the backbone of the strategy is still the same: a trend following system. Instead of using a fixed TP and SL, a trailing stoploss is now used. To limit the losses when the trend weakens, the trailing stoploss automatically gets smaller, as it is based on the ATR.
A new utility is you can now easily switch between indicators on which the decision making is based. This allows the user to discover which indicators work best for entry, long/short switching and stoploss configuration.
The strategy has been proven to be very profitable in trending markets, but can suffer losses during ranging market. To make the system more robust, the strategy cannot solely rely on a trending system. Other systems must be added.
I believe that a good trading bot must consist of more than 4 different strategies, based on different systems. This is what I am currently working on.
My goal for publishing this strategy is to help other traders build their own. In my journey I found it difficult to find a good strategy that employs a decent risk management, which is truly essential for having good, consistent results. Also, a realistic commission needs to be defined to have a realistic performance prediction. This weighs on the profitability and therefore is often set at 0 by authors of other strategies, which I find misleading.
If you have found this strategy informative or useful, please leave a comment.
Greetings Michael

Combo 2/20 EMA & (H-L)/C Histogram This is combo strategies for get a cumulative signal.
First strategy
This indicator plots 2/20 exponential moving average. For the Mov
Avg X 2/20 Indicator, the EMA bar will be painted when the Alert criteria is met.
Second strategy
This histogram displays (high-low)/close
Can be applied to any time frame.
WARNING:
- For purpose educate only
- This script to change bars colors.
Combo 2/20 EMA & Bandpass Filter This is combo strategies for get a cumulative signal.
First strategy
This indicator plots 2/20 exponential moving average. For the Mov
Avg X 2/20 Indicator, the EMA bar will be painted when the Alert criteria is met.
Second strategy
The related article is copyrighted material from
Stocks & Commodities Mar 2010
WARNING:
- For purpose educate only
- This script to change bars colors.
Combo 2/20 EMA & Average True Range Reversed This is combo strategies for get a cumulative signal.
First strategy
This indicator plots 2/20 exponential moving average. For the Mov
Avg X 2/20 Indicator, the EMA bar will be painted when the Alert criteria is met.
Second strategy
Average True Range Trailing Stops Strategy, by Sylvain Vervoort
The related article is copyrighted material from Stocks & Commodities Jun 2009
Please, use it only for learning or paper trading. Do not for real trading.
WARNING:
- For purpose educate only
- This script to change bars colors.
TICK Scalping strategy, SPY 1 min1 min chart scalping version of my other TICK strategy with adjusted parameters and additional entry and exit conditions better suited for 1 min SPY chart. Please refer to my original TICK strategy for explanation.
Important notes:
1. This strategy is designed for same day SPY option scalping on the 1 min chart . All profit shown in back testing report is based on Profit/Loss (P/L) estimates from trading options with approximately 6 weeks of data. By default, it is set to 10 option contracts. By default the initial capital is set to $5000. Pyramiding is set to 3.
2. This strategy works better with non-extended market data .
3. This strategy is mainly developed for SPY trading on 1 min chart, it probably will not be very profitable with other tickers or time frame without tweaking all the parameters first.
Cheers and enjoy~! Let's all make money~!!

Combo 2/20 EMA & ADXR This is combo strategies for get a cumulative signal.
First strategy
This indicator plots 2/20 exponential moving average. For the Mov
Avg X 2/20 Indicator, the EMA bar will be painted when the Alert criteria is met.
Second strategy
The Average Directional Movement Index Rating (ADXR) measures the strength
of the Average Directional Movement Index (ADX). It's calculated by taking
the average of the current ADX and the ADX from one time period before
(time periods can vary, but the most typical period used is 14 days).
Like the ADX, the ADXR ranges from values of 0 to 100 and reflects strengthening
and weakening trends. However, because it represents an average of ADX, values
don't fluctuate as dramatically and some analysts believe the indicator helps
better display trends in volatile markets.
WARNING:
- For purpose educate only
- This script to change bars colors.

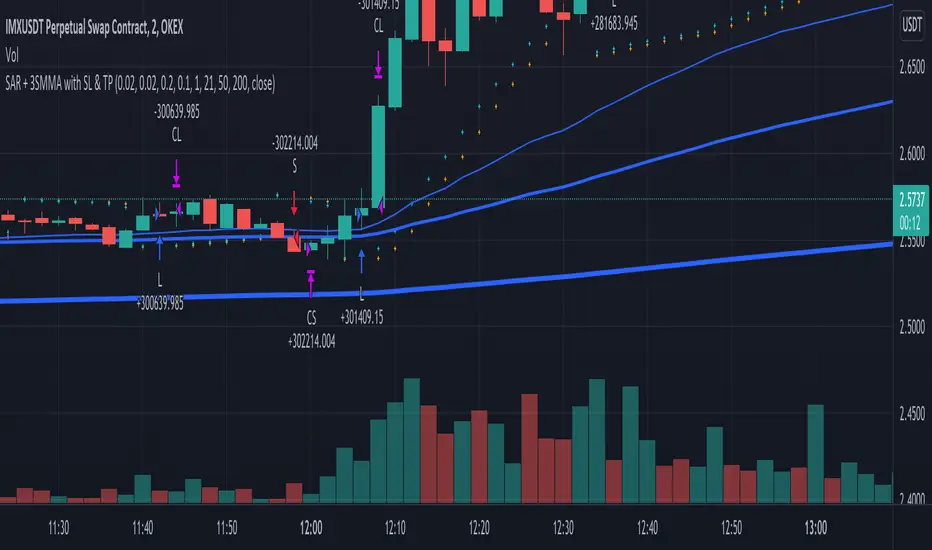
SAR + 3SMMA with SL & TPThis script is a combination of SAR strategy and 3 Smoothed Moving Averages.
Strategy:
Takes SAR longs when all 3 SMMAs are rising. Take SAR short when all 3 SMMAs are falling.
Supports StopLoss and TakeProfit.
If you have found a profitable setup for it, please share in the comments or private chat.
TICK strategy for SPY optionsImportant notes:
1. This strategy is designed for same day SPY option scalping. All profit shown in back testing report is based on Profit/Loss (P/L) estimates from trading options with approximately 6 months of data. By default, it is set to 10 option contracts. By default the initial capital is set to $5000. Pyramiding is set to 3.
2. This strategy works better with non-extended market data.
3. This strategy is mainly developed for SPY trading on 5 min chart, it probably will not be very profitable with other tickers or time frame without tweaking all the parameters first.
4. This strategy will work with QQQ as well, but please adjust the profit multiplier to match the P/L of QQQ options.
How it works:
When trading the indices, many rely on the TICK for market directions. This strategy is a trend following strategy that uses a combination of conditions using the following indicators:
- TICK
- RSI
- VIX volatility index
- EMA
For entries, the conditions are:
1. TICK moving average crossover with a delayed signal line
2. Bullish or bearish RSI signal, RSI > 50 for bullish, < 50 for bearish
3. VIX must be above a certain threshold to take advantage of high market volatility
4. Price must be on top of EMA line for long, and below for short
For exits, there are 3 scenarios:
1. Stop loss set by a percentage of the daily ATR value
2. Trend changes on the TICK and the RSI
3. Bearish or bullish divergence on price with TICK
This strategy automatically signal to close all trades at 3:50 pm EST at the end of the day.
Extras:
- There is an option to show P/L for reinvesting profits
Enjoy~!!! Let's all make $$$

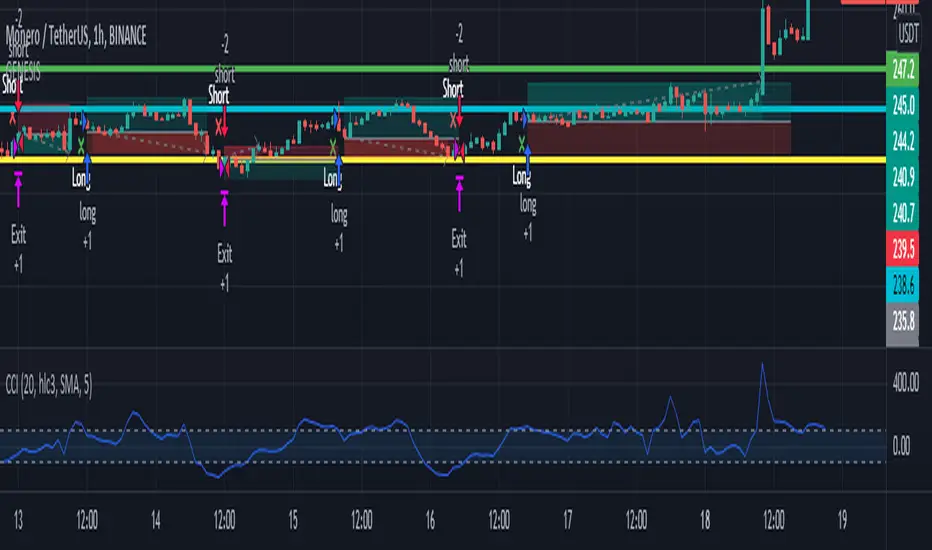
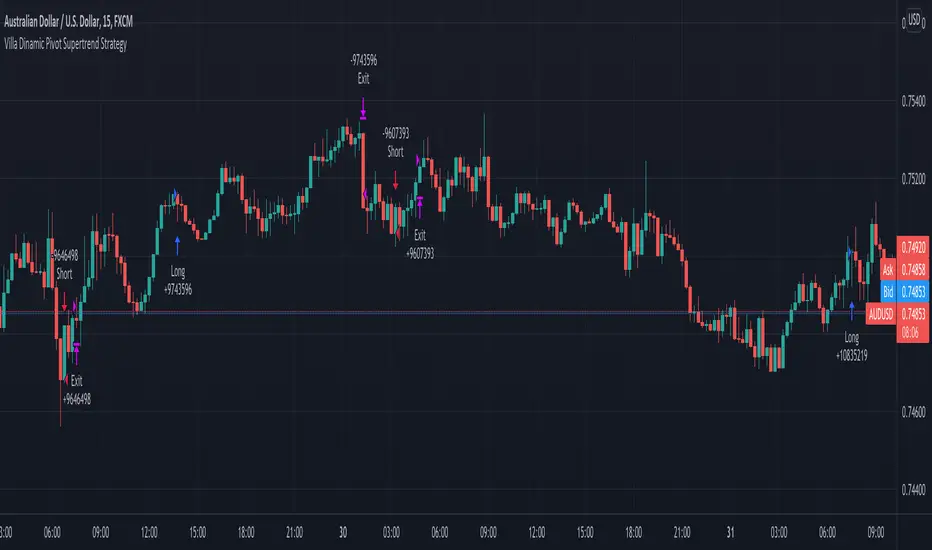
Villa Dinamic Pivot Supertrend StrategyThis strategy works better on AUD/USD in the 15 min timeframe. It uses the Pivot Supertrend to enter trades based on different filters such as:
- Simple EMA filter: that the 3 EMAs should be in order
- DEMA angle: you can choose the DEMA Angle threshold and the look back to check the angle to just trade trades with DEMA at a certain angle
- Simple DEMA filter: just check if close is above or below DEMA
- Take Every Supertrend Signal: this means to take every normal supertrend signal to not just wait for a pivot supertrend signal to enter a trade (specially on long pivot supertrend periods)
- Stop Loss at Supertrend: this means that the stop loss will be at the Normal Supertrend, if false the stop loss will be placed at the ATR level selected.
- 2 Steps Take Profit: this means if you want to close a percentage of position as soon as the normal supertrend crosses the entry price, you can select the % on the "2 Steps TP qty" input
- Stop Loss ATR Multiplier: if Stop Loss at Supertrend is off this will be the stoploss based on the atr
- Take Profit ATR Multiplier: if Stop Loss at Supertrend is off this will be the takeprofit based on the atr (you have to keep in mind that the ratio between this two will make the Risk to reward ratio of the take profit when the Stop Loss at Supertrend)
- Testing: to avoid overfitting, you can select date ranges for backtesting and forwardtesting and select which testing you wanna do
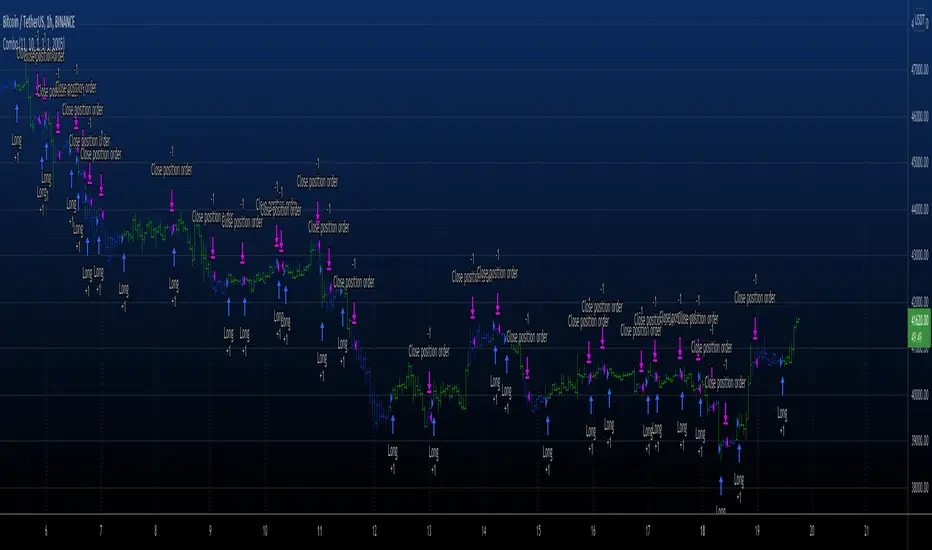
Uptrend and Oversold Index Swing Trading System 8H--- Foreword ---
The Overbought and Oversold Index Swing Trading System or short: I11L Hypertrend primarily uses money management Strategies, EMA and SMA and my momentum Ideas for trying to produce satisfactory Alpha over a timespan of multiple years.
--- How does it Work? ---
It uses 20 different EMA's and SMA's to produce a score for each Bar.
It will credit one Point If the EMA is above the SMA.
A high score means that there is a strong Uptrend.
Spotting the strong Uptrend early is important.
The I11L Hypertrend System trys to spot the "UPTREND" by checking for a crossover of the Score(EMA) / Score(SMA).
A low score means that there is a strong Downtrend.
Its quite common to see a reversal to the mean after a Downtrend and spotting the bottom is important.
The System trys to spot the reversal, or "OVERSOLD" state by a crossunder of the Score(EMA) / Score(SMA).
--- What can i customize? ---
-> Trading Mode: You can choose between two different trading modes, Oversold and Overbought(trend) and Random Buys to check if your systems Profitfactor is actually better then market.
-> Work with the total equity: The system uses the initial capital per default for Backtesting purposes but seeing the maximum drawdown in a compounding mode might help!
-> Use a trailing SL: A TSL trys to not lose too much if the trade goes against your TP
-> Lookbackdistance for the Score: A higher Lookbackdistance results in a more lagging indicator. You have to find the balance between the confirmation of the Signal and the frontrunning.
-> Leverage: To see how your strategie and your maximum Drawdown with the total equity mode enabled would have performed.
-> Risk Capital per Trade unleveraged: How much the underlying asset can go against your position before the TSL hits, or the SL if no TSL is set.
-> TPFactor: Your risk/reward Ratio. If you risk 3% and you set the ratio to 1.2, you will have a TP at 3 * 1.2 = 3.6%
-> Select Date: Works best in the 8H Timeframe for CFD's. Good for getting a sense of what overfitting actually means and how easy one can fool themself, find the highest Profitfactor setting in the first Sector (Start - 2012) and then see if the second Sector (2012 - Now) produces Alpha over the Random Buy mode.
--- I have some questions about the System ---
Dear reader, please ask the question in the comment Section and i will do my best to assist you.

EMA Cloud Intraday Strategy********NOT TRADING ADVICE - USE AT YOUR OWN RISK - TRADING IS RISKY - DO NOT BLINDLY FOLLOW THE SIGNALS FROM THIS STRATEGY********
This strategy utilizes the 9 and 20 period exponential moving averages to create a colored cloud between similar to what is seen on the Ichimoku Cloud. The strategy closes all trades by the end of the trading day. Entry is when the price closes above a Green (9 EMA above 20 EMA) cloud or below a Red (9 EMA below 20 EMA) cloud. Exit is when price closes against the 9 EMA or at the end of the trading day. Running the strategy tester on different intraday time frames will show the best time frame for a given Symbol. For example, I have found that the best results are returned by this strategy for SPY on the 30 minute time frame.
********NOT TRADING ADVICE - USE AT YOUR OWN RISK - TRADING IS RISKY - DO NOT BLINDLY FOLLOW THE SIGNALS FROM THIS STRATEGY********

Perfect OrderEntry Point
How to Entry
Perfect Order Entry
SMA5,13,21 & EMA75,90,200
Please enjoy your entry

Kahlman HullMA / WT Cross StrategyA strategy created using Hull Moving Average and WT Cross .
Hull Moving Average turns green and WT Cross crossover this is a long. Otherwise short.
Stop Loss and Take Profit settings are available. You can set it to the level you want or turn it off.
According to my measurements, it shows the best performance in the 4-hour period. But you can find the best settings that are correct from the Strategy settings.

Top 40 High Low Strategy for SPY, 5minThis strategy is developed based on my High Low Index SPY Top 40 indicator
Notes:
- this strategy is only developed for SPY on the 5 min chart . It seems to work with QQQ as well, but it isn't optimized for it
- P/L shown is based on 10 SPY option contracts, call or put, with strike price closest to the entry SPY price and expiry of 0 to 1 day. This includes commissions (can be changed). This is only an estimate calculated using an arbitrary multiplier factor, this can be changed in the setting
- P/L is based on $5000 initial capital
- Works with both regular / extended trading session turned on/off. However, max drawdown is 1/2 with extended trading session ON
- there is still a bug that doesn't allow alert to be created due to calculation error, will update once fixed
This strategy combines signals from the following indicators to determine entry signals:
- High Low Index SPY Top 40
- MACD
- Linear Regression Slope
Entry signal is triggered when:
- High Low Index line crosses the EMA line
- MACD trending in the same direction
- Linear Regression slope is accelerating above a threshold in the same direction, indicating a strong trend
Profit target(PT) and stop loss(SL) are determined using ATR value, with 2:1 Reward to Risk ratio as default.
Exit signal may be triggered prior to PT or SL trigger when:
- High Low Index SPY Top 40 shows a reversal after overbought or oversold conditions (optional)
- Opposite entry signal is triggered
There are a number of optional settings:
- Turn on/off "option trading", P/L will be calculated using share price only without multiplication factor for trading option contracts
- # of options per trade, default to 10
- Reinvest with profit made
- Trade with trailing SL after PT hit
- Take profit early based on Top 40 overbought/oversold
- Trade 0/1 day expiry. This will signal exit by the end of the day on Mon/Wed/Fri, and only exits 1/2 of positions (if in profit) on Tues/Thurs
- Can reduce the SL level without impacting PT
- No entry between 10:05 - 10:20 (don't ask me why, but statistically it performs better)
Consider donating me some of your profit if you make $$$ hahaha~ ;)
Enjoy~~

rsisma imkind dailyrsi 14
sma 8
time fram : weekly and daily
rsi 14
sma 8
time fram : weekly and daily
rsi 14
sma 8
time fram : weekly and daily
rsi 14
sma 8
time fram : weekly and daily

EMA StratIf previous day close above EMA, enter long at open the following day. Exit long position if prices close below EMA.

EDMA Scalping Strategy (Exponentially Deviating Moving Average)This strategy uses crossover of Exponentially Deviating Moving Average (MZ EDMA ) along with Exponential Moving Average for trades entry/exits. Exponentially Deviating Moving Average (MZ EDMA ) is derived from Exponential Moving Average to predict better exit in top reversal case.
EDMA Philosophy
EDMA is calculated in following steps:
In first step, Exponentially expanding moving line is calculated with same code as of EMA but with different smoothness (1 instead of 2).
In 2nd step, Exponentially contracting moving line is calculated using 1st calculated line as source input and also using same code as of EMA but with different smoothness (1 instead of 2).
In 3rd step, Hull Moving Average with 2/3 of EDMA length is calculated using final line as source input. This final HMA will be equal to Exponentially Deviating Moving Average.
EDMA Defaults
Currently default EDMA and EMA length is set to 20 period which I've found better for higher timeframes but this can be adjusted according to user's timeframe. I would soon add Multi Timeframe option in script too. Chikou filter's period is set to 25.
Additional Features
EMA Band: EMA band is shown on chart to better visualize EMA cross with EDMA .
Dynamic Coloring: Chikou Filter library is used for derivation of dynamic coloring of EDMA and its band.
Trade Confirmation with Chikou Filter: Trend filteration from Chikou filter library is used as an option to enhance trades signals accuracy.
Strategy Default Test Settings
For backtesting purpose, following settings are used:
Initial capital=10000 USD
Default quantity value = 5 % of total capital
Commission value = 0.1 %
Pyramiding isn't included.
Backtesting data never assures that the same results would occur in future and also above settings use very less of total portfolio for trades, which in a way results less maximum drawdown along with less total profit on initial capital too. For example, increasing default quantity value will definity increase maximum drawdown value. The other way is also to use fix contracts in backtesting but it all depends on users general practice. Best option is to explore backtesting results with manually modified settings on different charts, before trusting them for other uses in future.
Usage and In-Detail Backtesting
This strategy has built-in option to enable trade confirmations with Chikou filter which will reduce the total number of trades increasing profit factor.
Symmetrically Weighted Moving Average (SWMA) on input source, may risk repainting in real-time data. Better option is to run a trade on bar close or simply left this optin unchecked.
I've set Chikou filter unchecked to increase number of trades (greater than 100) on higher timeframe (12H) and this can be changed according to your precision requirement and timeframe.
Timeframes lower than 4H usually have more noise. So its better to use higher EDMA and EMA length on lower timeframes which will decrease total number of offsetting trades increasing average total number of bars within a single trade.
Original "Exponentially Deviating Moving Average (MZ EDMA )" Indicator can be found here.

Trend Follower Strategy v2 [divonn1994]The Trend Follower Strategy that I made classifies red and green candles into tiny, small, and big sizes and will send buy or sell signals depending on if the candle is classified as "big" so you get into and out of a position when there is a big candle. Out during a big green candle to take profit. Out during a big red candle in case the market is turning down. It also won't enter a position unless there is positive EMA momentum.
For the chart there is a Buy and a Sell signal. Buy = 1, Sell = 0, and when the value crosses above or below 0.5 it will trigger a long position or close the long position. The graph isn't necessary to the strategy, but can help with visualizing the trade patterns in the past if you like.
This strategy works best so far with these coins at time of posting (March 4th, 2022):
KCSUSDT (621x profit), HTUSDT (45x profit), LUNAUSDT (45x profit), BNBBTC (1553x profit), ETHBTC (219x profit), KCSBTC (1222x profit), LUNABTC (83x profit), FTMBTC (52x profit).
It can work with other pairings, but I personally like these pairings best. I didn't test it with coins outside of the top 100 coins by market cap. Use it however you want.
Works best on 1 Day charts.
The strategy would rather be in the market than out. It gets out when it see's a red flag, but can immediately go back in in the next bar if the red flags are all gone. So it makes a lot of trades.
------------------------------------------------------------------------------------------------------------------------------------------------------------------------------------------------------------------------
Update: This is the same strategy I uploaded before but I made the code Open for anyone to check it out and so it has a similar description as the previous version. Let me know what you think. I'd remove the old version if I could, but I guess it's site policy to not be able to remove scripts that have been uploaded.

DayTradingFutures Cross-StrategyOVERVIEW
This indicator was designed to help beginners use a cross over strategy that can be used for entries, exits and to for trend direction.
█ COMPONENTS
Here is a brief overview of the indicator:
Weighted Moving Averages
I find that by using a weighted moving average ( WMA ) to show a crossover, is very close to using a MACD signal line cross or using a RSI signal crossing over the 50/Mid Line. In my main strategy, I use the 5period (fast) and with the crossing of the 20period (slow) WMA for entries and the 50period WMA to show the short term trend. Please note, that I use the 50 period for day trading, if you are using a swing trade or plan on holding positions long term, a higher period may be preferred . All of the moving averages are customizable by color, length, and timeframe. **I feel comfortable trading this strategy at the 5min,10min, and 15min charts.
1 — 5 WMA- this is the white moving average closest to price and is the first part of our small cloud.
2 — 20 WMA - this is the yellow moving average and is the second part of or small cloud.
3 — 50 WMA - this is the directional trend.
Moving Average Clouds
The cloud (which is optional) appears when the trader should be looking to go Long or Sell Short. The dividing line is when both the 5 and 20 periods are over the 50 period.
Trade Management
This is a tool to help with setting your stop loss, break even, and target levels. Currently you can set these based on the current ATR ( Average True Range ).
The “Buy” and “Sell” signals are the ATR indicator based on your risk tolerance (fully customizable). Different ticker symbols will require different ATR values, please back test! When applying your stop loss, drag the stop line to small arrow of the signal callout.
Trading Session
The indicator was designed for beginners to trade during the New York Session (08:30 – 16:00 CST). However, the indicator will ONLY show signals AFTER opening and BEFORE close (09:00 – 14:30 CST). The reason for this is that there is greater volatility during the open and I do not recommend to be in a trade at the end of the session.
Buy and Sell Alerts
Alerts can also be set, when an entry can be made. This prevents a person from having to watch the charts for an extended period of time.
Faults of this strategy:
Time of RANGES/CONSOLIDATION periods and EXTREME VOLITITY KILLs this strategy!! Do not trade this strategy during these periods!!
Disclaimer:
NO strategy is 100% effective! I am not responsible for any loss trades or malfunctions of this code. I recommend to paper trade any new strategy before trading with real money! I am not a financial advisor, trading can be very risky!
