Green AverageGA (Green Average) is used as a bias and context tool. The indicator is not an entry signal by itself,
but answers the question: Should I even be looking for longs or shorts right now?
1. What the indicator shows
• BP (green line): buying pressure – how much of the upward movement is driven by green
candles.
• SP (red line): selling pressure – how much of the downward movement is driven by red candles.
• GA % (box): proportion of candles that are green (frequency / flow).
2. Quick market read (3 seconds)
• BP above SP → bullish bias
• SP above BP → bearish bias
• Lines close together → chop / uncertain market
• Both lines spiking simultaneously → high energy / volatility
3. Core rules
• Bias first, entry second: trade only in the direction of dominant pressure.
• Crossovers indicate regime shifts, not automatic entries.
• GA % is context, not a buy/sell signal.
4. Entry models
A) Trend continuation
BP > SP with clear separation. Wait for a pullback (VWAP, support, MA) and enter on trend
resumption.
B) Regime shift after crossover
After a BP/SP crossover, wait for price confirmation (15m swing break or VWAP reclaim).
C) Mean reversion (range)
Only when both lines are low and cross frequently. Small targets, defensive sizing.
5. Common mistakes
• Taking every crossover as a trade
• Oversizing when lines are glued together
• Assuming high GA % guarantees upside
6. Day types
• Trend day: BP dominates, GA % often above 52–55.
• Chop day: BP ≈ SP, GA % around 50.
• Distribution: GA % high but SP takes control.
7. Default settings (ETH 5m)
• Window N = 24 (≈ 2 hours)
• BP/SP smoothing = 3
• GA used together with VWAP and price structure
Đường Trung bình trượt

Trend Fusion Indicator🎯 Trend Fusion Indicator🎯
Professional trading indicator combining EMA momentum with Supertrend volatility for high-probability signals.
📊KEY FEATURES:
• 9 EMA & Supertrend (10,3) crossover signals
• Visual trend direction with colored fills
• Buy/Sell arrows at crossover points
• Real-time trend tracking
• Clean, professional interface
⚡SIGNAL LOGIC:
✅ BUY: When EMA crosses ABOVE Supertrend
✅ SELL: When EMA crosses BELOW Supertrend
🎨VISUAL INDICATORS:
• Green Zone/Fill: Bullish trend (EMA > Supertrend)
• Red Zone/Fill: Bearish trend (EMA < Supertrend)
• Triangle Arrows: Entry signals
• Background Colors: Trend confirmation
⚙️CUSTOMIZABLE SETTINGS:
• EMA Length (Default: 9)
• Supertrend ATR Length (Default: 10)
• Supertrend Factor (Default: 3.0)
🔔ALERTS INCLUDED:
• Buy Alert: EMA crosses above Supertrend
• Sell Alert: EMA crosses below Supertrend
📈 BEST FOR:
• Swing Trading
• Day Trading
• Trend Following
• Market Reversals
⚠️ DISCLAIMER: This indicator is for educational purposes only.
Trading involves risk. Not financial advice. Use at your own risk.

Forexsebi - DAX Future Psychological Levels - TrendflowTrendflow is an advanced TradingView indicator combining psychological price levels with trend and multi-timeframe analysis.
The indicator automatically plots psychological levels in around the current price. Each level is visualized using horizontal lines and price zones (boxes) to clearly highlight potential support and resistance areas.
Psychological Levels – Trendflow ist ein fortschrittlicher TradingView-Indikator , der wichtige psychologische Preislevel mit einer klaren Trend- und Multi-Timeframe-Analyse kombiniert.
Trend Analysis with SMAs
SMA 50 & SMA 200 plotted directly on the chart
Individually toggleable
Clear color separation for fast trend recognition
Multi-Timeframe SMA Trend Table
Trend status (BULLISH / BEARISH / NEUTRAL) across:
5M, 15M, 1H, 4H, 1D
Logic: Price relative to SMA 50 & SMA 200
Color-coded, easy-to-read table
Info Box
Current Gold price
Nearest psychological level above and below price
Alert System
Alerts when price approaches a psychological level
User-defined alert distance

Forexsebi - NASDAQ Psychological Levels - TrendflowTrendflow is an advanced TradingView indicator combining psychological price levels with trend and multi-timeframe analysis.
The indicator automatically plots psychological levels in around the current price. Each level is visualized using horizontal lines and price zones (boxes) to clearly highlight potential support and resistance areas.
Psychological Levels – Trendflow ist ein fortschrittlicher TradingView-Indikator , der wichtige psychologische Preislevel mit einer klaren Trend- und Multi-Timeframe-Analyse kombiniert.
Trend Analysis with SMAs
SMA 50 & SMA 200 plotted directly on the chart
Individually toggleable
Clear color separation for fast trend recognition
Multi-Timeframe SMA Trend Table
Trend status (BULLISH / BEARISH / NEUTRAL) across:
5M, 15M, 1H, 4H, 1D
Logic: Price relative to SMA 50 & SMA 200
Color-coded, easy-to-read table
Info Box
Current Gold price
Nearest psychological level above and below price
Alert System
Alerts when price approaches a psychological level
User-defined alert distance

Forexsebi - GBPJPY Psychological Levels - TrendflowTrendflow is an advanced TradingView indicator combining psychological price levels with trend and multi-timeframe analysis.
The indicator automatically plots psychological levels in around the current price. Each level is visualized using horizontal lines and price zones (boxes) to clearly highlight potential support and resistance areas.
Psychological Levels – Trendflow ist ein fortschrittlicher TradingView-Indikator , der wichtige psychologische Preislevel mit einer klaren Trend- und Multi-Timeframe-Analyse kombiniert.
Trend Analysis with SMAs
SMA 50 & SMA 200 plotted directly on the chart
Individually toggleable
Clear color separation for fast trend recognition
Multi-Timeframe SMA Trend Table
Trend status (BULLISH / BEARISH / NEUTRAL) across:
5M, 15M, 1H, 4H, 1D
Logic: Price relative to SMA 50 & SMA 200
Color-coded, easy-to-read table
Info Box
Current Gold price
Nearest psychological level above and below price
Alert System
Alerts when price approaches a psychological level
User-defined alert distance

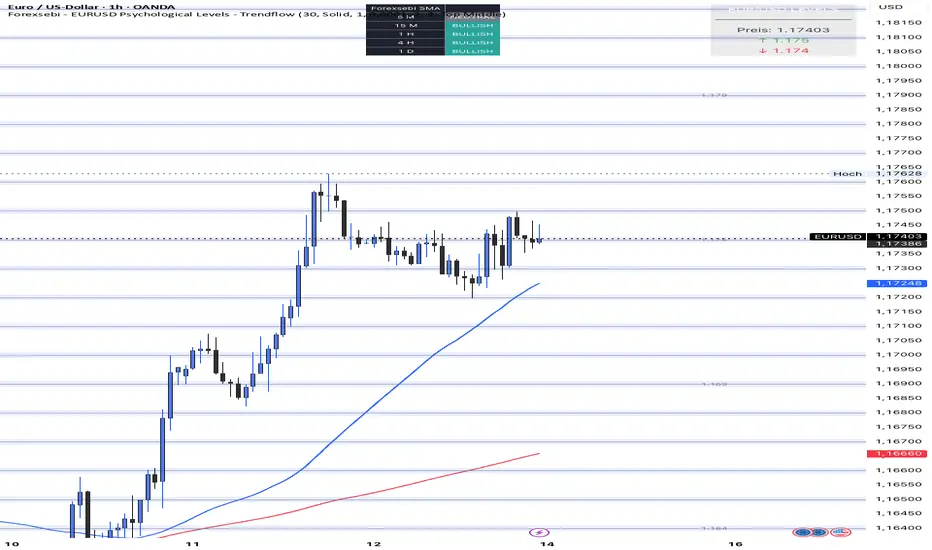
Forexsebi - EURUSD Psychological Levels - TrendflowTrendflow is an advanced TradingView indicator combining psychological price levels with trend and multi-timeframe analysis.
The indicator automatically plots psychological levels in around the current price. Each level is visualized using horizontal lines and price zones (boxes) to clearly highlight potential support and resistance areas.
Psychological Levels – Trendflow ist ein fortschrittlicher TradingView-Indikator , der wichtige psychologische Preislevel mit einer klaren Trend- und Multi-Timeframe-Analyse kombiniert.
Trend Analysis with SMAs
SMA 50 & SMA 200 plotted directly on the chart
Individually toggleable
Clear color separation for fast trend recognition
Multi-Timeframe SMA Trend Table
Trend status (BULLISH / BEARISH / NEUTRAL) across:
5M, 15M, 1H, 4H, 1D
Logic: Price relative to SMA 50 & SMA 200
Color-coded, easy-to-read table
Info Box
Current Gold price
Nearest psychological level above and below price
Alert System
Alerts when price approaches a psychological level
User-defined alert distance
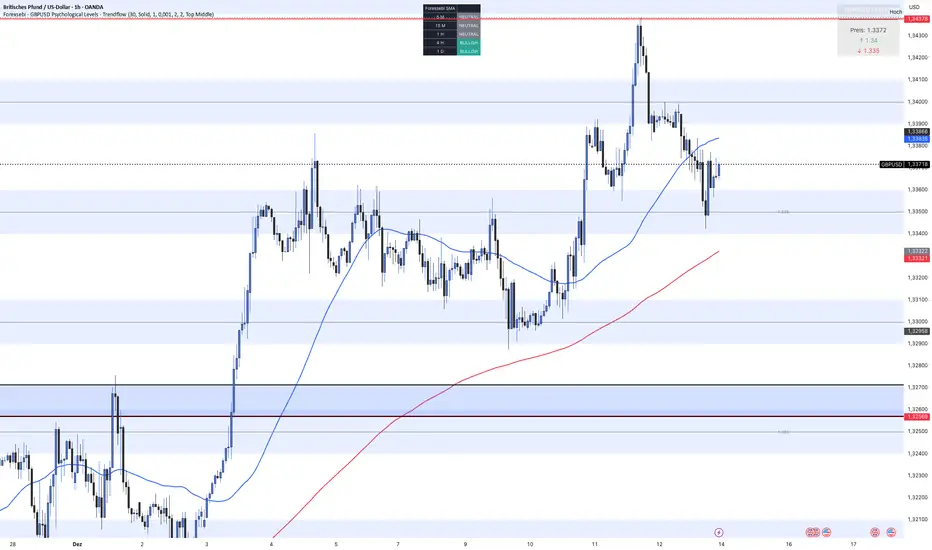
Forexsebi - GBPUSD Psychological Levels - TrendflowTrendflow is an advanced TradingView indicator combining psychological price levels with trend and multi-timeframe analysis.
The indicator automatically plots psychological levels in around the current price. Each level is visualized using horizontal lines and price zones (boxes) to clearly highlight potential support and resistance areas.
Psychological Levels – Trendflow ist ein fortschrittlicher TradingView-Indikator , der wichtige psychologische Preislevel mit einer klaren Trend- und Multi-Timeframe-Analyse kombiniert.
Trend Analysis with SMAs
SMA 50 & SMA 200 plotted directly on the chart
Individually toggleable
Clear color separation for fast trend recognition
Multi-Timeframe SMA Trend Table
Trend status (BULLISH / BEARISH / NEUTRAL) across:
5M, 15M, 1H, 4H, 1D
Logic: Price relative to SMA 50 & SMA 200
Color-coded, easy-to-read table
Info Box
Current Gold price
Nearest psychological level above and below price
Alert System
Alerts when price approaches a psychological level
User-defined alert distance
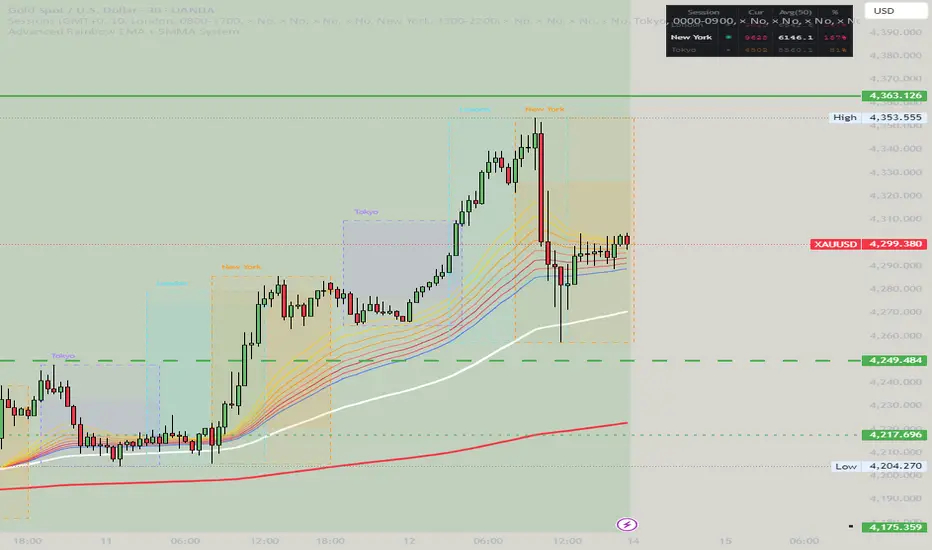
Forexsebi - GOLD Psychological Levels - TrendflowPsychological GOLD levels every $50 with clear zones, highlighted $100 & $500 levels, SMA 50 & 200, and a multi-timeframe trend table. Perfect for structure, trend, and rejection trading on XAUUSD.
Psychologische GOLD-Levels in 50-Dollar-Abständen mit klaren Zonen, 100- & 500-Dollar-Highlights, SMA 50 & 200 sowie einer Multi-Timeframe Trend-Tabelle. Ideal für Struktur-, Trend- und Rejection-Trading auf XAUUSD.
Key Features
Psychological Gold Levels
Automatic levels every $50
Adjustable number of levels above and below current price
Highlighted zones around each level for clearer reaction areas
Special Level Highlighting
$100 levels (xx00) highlighted for medium importance
$500 levels (x000 / x500) marked as major psychological levels
Different colors and stronger line thickness for key zones
Price Labels
Clean price labels displayed on the chart
Special symbols for 100 and 500 dollar levels
Trend Analysis with SMAs
SMA 50 & SMA 200 plotted directly on the chart
Individually toggleable
Clear color separation for fast trend recognition
Multi-Timeframe SMA Trend Table
Trend status (BULLISH / BEARISH / NEUTRAL) across:
5M, 15M, 1H, 4H, 1D
Logic: Price relative to SMA 50 & SMA 200
Color-coded, easy-to-read table
Displays the current trading session (Asia, Frankfurt, London, NY)
Info Box
Current Gold price
Nearest psychological level above and below price
Alert System
Alerts when price approaches a psychological level
User-defined alert distance
Distinction between normal, $100 and $500 levels

SB-VDEMA + PivotsBest use - Intraday Scalping ( 1 Mt, 3 Mts, 5 Mts )
Uses Volatility weighted DEMA for smoother and reliable signals.
One can use dynamic colour coding of VWDEMA for entering call or puts. VWAP and Henkin ashi Supertrend is also there but, i think VWDEMA is quite enogh for decision making.

SB - Ultimate Clean Trend Pro Uses dynamic Moving colour coding for spotting chage of bias. Use set up with keeping VWAP in reference.

VWAP Histogram with EMAsBased on VWAP and Moving Averages.
Bias turns +ve if dynamic colour of the moving averages turns green. All moving avaerages are customisable.

Stepped Multi Timeframe MAs with PDH PDL TDH TDL Dynamic Labels
Plots stepped (blocky) higher‑timeframe moving averages and VWAP on the current chart (HMA/EMA/VWMA/SMA/VWAP toggles).
Automatically switches MA source to the chart’s timeframe on Daily/Weekly/Monthly (e.g., Weekly chart shows weekly MAs), while intraday charts can use a user-selected higher timeframe.
Draws Previous Day High/Low (PDH/PDL) anchored from the exact candle that formed the level, then extends the line across the chart up to the latest bar.
Draws Today’s High/Low (TDH/TDL) the same way, and updates dynamically as new intraday highs/lows are made (the anchor shifts to the new wick candle).
Keeps labels readable by placing them above/below each line with no background and a clean grey style, and repositions label X based on the visible chart window (so labels stay at a consistent % from the right edge while you pan/zoom)

FL Core Signals Only FL Core shows only what matters: where to enter, where to exit, and where prof
No indicator noise — just confirmed decision points on a clean chart.
Designed for traders who value structure, patience, and clarity.
What FL Core Does
FL Core marks:
ENTER LONG
ENTER SHORT
AND
EXIT SHORT
TP1 / TP2 / TP3 profit targets
All signals are generated using a fixed, non-repainting ruleset and are confirmed only after candle close.
How It Trades (High Level)
Identifies momentum shifts using internal trend logic
Requires a full candle confirmation before signaling entries
Holds trades until momentum breaks, then signals exit
Tracks profit targets automatically in points
No guessing. No anticipation. No repainting.
Session Rules
FL Core is hard-wired to operate only between 4:00 AM and 4:00 PM (exchange time).
Signals outside of this window are intentionally ignored to avoid low-liquidity and overnight conditions.
Chart Design Philosophy
This version intentionally hides all underlying indicators and displays only:
Clean entry markers
Clean exit markers
Profit plate
A single gold Exit Rail that visually guides trade management
The focus stays on execution and decision-making, not indicator interpretation.
Profit Targets
Default profit targets are:
TP1: 25 points
TP2: 40 points
TP3: 60 p
Targets can be adjusted by the user.
Note: Default profit targets are optimized for NQ/MNQ, which was the primary instrument used during testing.
Traders using ES/MES should reduce target distances to better match volatility.
Important Notes
FL Core is an indicator, not an automated trading system
Stop-loss placement is handled manually according to your trading plan
Signals are designed to encourage discipline and patience, not over-trading
Marker placement (above/below bar) is intentional and should not be changed
Who This Is For
✔ Beginner traders
✔ Traders overwhelmed by indicators
✔ Traders who want clear structure and rules
✔ Traders focused on execution discipline
Who This Is NOT For
✘ Traders looking for fully automated execution
✘ Traders who want constant signals
✘ Traders who ignore risk management
Final Thought
FL Core does not try to predict the market.
It helps you wait for confirmation, execute cleanly, and manage trades with structure.
If you want fewer decisions, clearer trades, and a calmer trading experience — this is where you start.

Advanced Rainbow EMA + SMMA System - VILLAGE PILOT Advanced Rainbow EMA + SMMA System
This custom indicator overlays eight rainbow‑colored EMAs (20, 25, 30, 35, 40, 45, 50, 55) together with two Smoothed Moving Averages (SMMA 50 in white, SMMA 200 in red).
Features:
🌈 Rainbow EMAs: Smooth gradient from yellow → gold → orange → dark orange → tomato → crimson → red → blue, showing short‑ to medium‑term momentum.
⚪🔴 Smoothed Moving Averages: Thick white SMMA (50) and thick red SMMA (200) for long‑term trend context.
🟩🟥 Background shading: Green when EMAs align bullish and SMMA 50 > SMMA 200, red when bearish.
📈📉 Signal arrows: “BUY” labels on Golden Cross (SMMA 50 crossing above SMMA 200), “SELL” labels on Death Cross (SMMA 50 crossing below SMMA 200).
🔔 Alerts: Built‑in TradingView alerts for Golden/Death Cross and for strong bullish/bearish EMA alignment.
Use case: This tool helps traders quickly visualize short‑term momentum against long‑term smoothed trend direction. It highlights strong trending conditions, potential reversals, and crossover signals, making it suitable for swing trading, trend following, and confirmation of entries/exits.
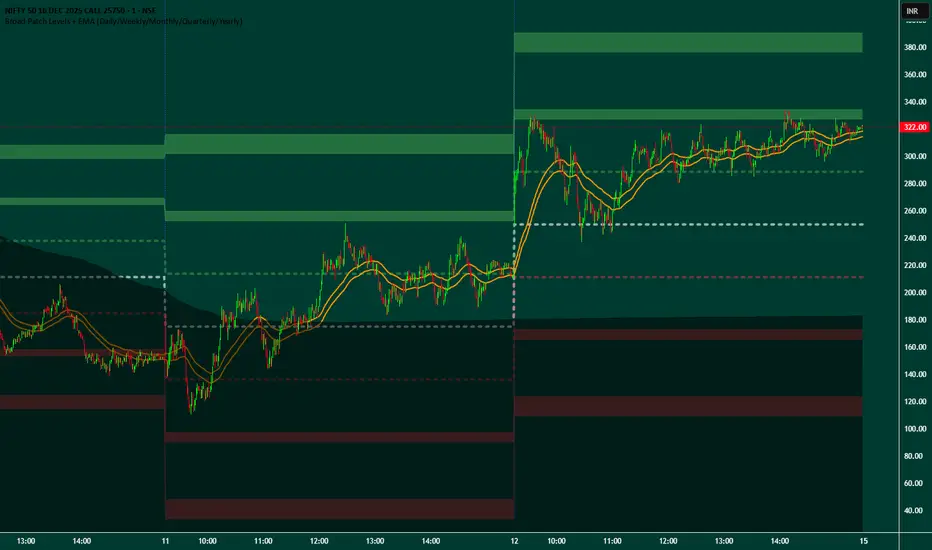
Broad Patch Levels + EMA (Daily/Weekly) with Directional AlertsThis indicator provides dynamic support and resistance levels along with trend guidance using EMA lines for daily or weekly timeframes. It is fully customizable, offering toggles for individual levels, trend lines, and alert notifications.
Key highlights:
Clearly visualize key market levels for potential trade entries and exits.
Monitor trend direction with EMA-based guidance.
Receive alerts when price interacts with important levels or trend zones.
Configurable visibility and alert options for a clean and personalized chart layout.
Ideal for professional traders looking for a structured, easy-to-read market perspective without exposing proprietary methods or calculations.
MNQ DP Levels and 1m high frequency HP+MP trading signalsidea to trade off QQQ DPs converted to NQ (dont ask me :) )on 1m chart focusing only on MP,HP triggers and scaling in down to a downside DP as an exit.
Disclaimer: This tool is for educational purposes only and does not constitute financial advice. Past performance does not guarantee future results.
