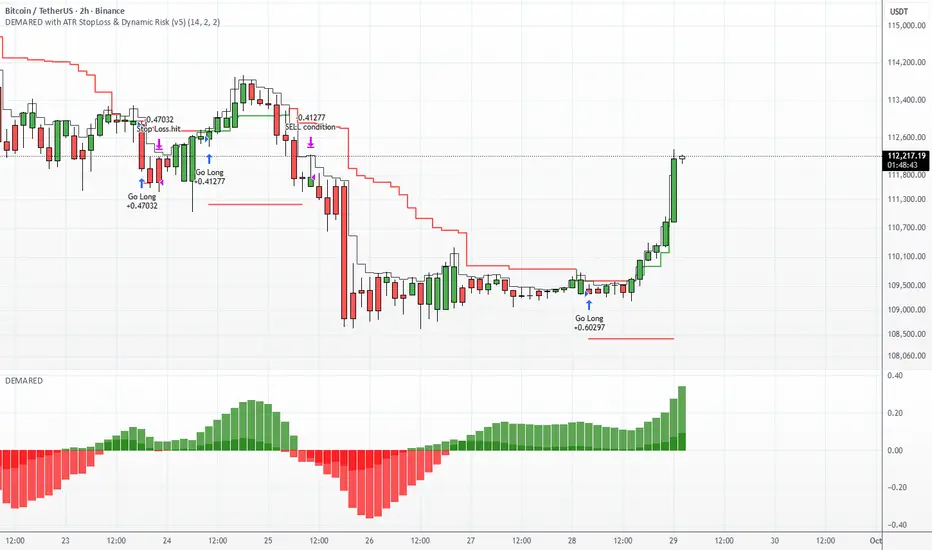
DEMARED with ATR StopLoss & Dynamic Risk (v5)DEMARED with ATR StopLoss & Dynamic Risk
This strategy combines Double Exponential Moving Averages (DEMA) with EMA and Donchian midline filters to capture trend-following signals. A long entry is triggered when both DEMA pairs are aligned bullishly, price is above EMA, and above the Donchian midpoint. Exits occur on opposite signals or when the ATR-based stop loss is hit.
Key features:
ATR Stop Loss: dynamic stop based on ATR with user-defined multiplier.
Dynamic Risk Management: position size is automatically calculated based on account equity and risk percentage.
Visualization: plots stop loss, EMA, Donchian midline, and optional bar coloring.
Flexible Display: toggle all indicator visuals on/off with a single input.
The goal is to provide a trend-following system with controlled risk and adaptability across different markets and timeframes.
Đường Trung bình trượt
AlgoAIDESIGNED FOR HEIKEN ASHI BARS
Gain Access here: algoai.store
AlgoAI
The Dark Edge of Trading
An AI-powered TradingView strategy that thrives across all markets. Short altcoin pumps. Ride NAS100 waves. Dominate gold, FX, stocks, and futures — all with one AI brain.
#1
Semi-Automatic Trading (Recommended)
Set up alerts on AlgoAI signals. As they come in, grade the setups and choose to enter manually. This gives you full control while leveraging AI precision.
#2
Fully Automated Trading
Pass signals via webhooks to TradersPost for futures or PineConnector for FX. Note: When running fully automated, it's suggested to use long-only or short-only mode to avoid side swiping and potential unintended drawdown.
BITSTAMP:BTCUSD

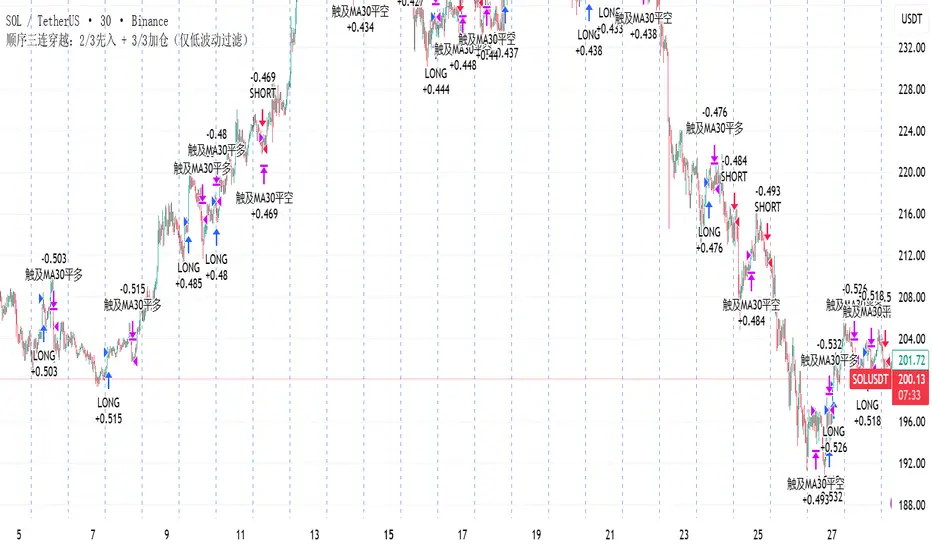
顺序三连穿越:2/3先入 + 3/3加仓(仅低波动过滤)策略描述(中文)
本策略基于 顺序三连穿越 原则:当 MA5 依次上穿 MA10、MA30、MA60 时,触发趋势做多信号;反之依次下穿时触发做空信号。
在完成 2/3 穿越时即可先行入场,完成 3/3 穿越时可选择加仓确认。
为减少震荡磨损,策略引入了布林带带宽过滤:当市场波动率过低时禁止入场。同时设有 冷静期,避免刚出场后立即反复进场。
该系统适用于趋势性较强或弱趋势行情,能够较好地捕捉单边走势,但在长时间震荡行情中仍可能遭遇利润侵蚀。
Strategy Description (English)
This strategy is built on the Sequential Triple Crossover principle:
When the 5-period moving average (MA5) sequentially crosses above MA10, MA30, and MA60, a bullish entry is triggered.
Conversely, when MA5 sequentially crosses below MA10, MA30, and MA60, a bearish entry is triggered.
An early entry is allowed once 2 out of 3 crossovers are completed, while the final crossover (3/3) can optionally serve as a confirmation add-on position.
To mitigate losses in choppy conditions, the system uses a Bollinger Bandwidth filter that blocks entries when volatility is too low. A cooldown period is also implemented to avoid immediate re-entries after closing a trade.
This setup performs well in trending or weak-trend environments, capturing directional moves effectively, but may still suffer from profit erosion during prolonged sideways markets.
BTC Momentum Strategy - RSI & Stoch RSI Entry and EMA ExitBTC Momentum Strategy: RSI & Stoch RSI Entry with EMA Exit
This strategy is designed to identify potentially strong entry points for Bitcoin (BTC) during periods of shifting momentum and then ride the trend until it shows signs of weakness. It's a straightforward, long-only strategy, meaning it only looks for opportunities to buy and then sell for a profit.
How It Works:
The strategy combines a few classic indicators to make its decisions. Think of it as a two-step confirmation system for buying, with a simple rule for selling.
1. The Buy Signal (Green Triangle)
To generate a buy signal, the strategy looks for two things to happen at the same time:
RSI Confirmation: It first waits for the Relative Strength Index (RSI) to show signs of bullish momentum. Specifically, it's looking for the RSI line to cross above its own moving average, suggesting that strength is starting to build from a lower level. This helps catch moves as they begin to turn positive.
Stochastic RSI Confirmation: As an extra layer of confirmation, it also checks the Stochastic RSI. This helps filter out weaker signals and confirm that momentum is truly shifting upwards from an oversold or "bottomed-out" condition.
When both of these conditions are met, a green "buy" triangle will appear below the candle, and the strategy will enter a long position.
2. The Sell Signal (Red Triangle)
The exit rule is simple and designed to let your winners run while protecting you when the trend reverses.
* EMA-Based Exit: The strategy plots an orange line on your chart, which is an Exponential Moving Average (EMA). The strategy will hold the position as long as the price stays above this line. If a candle closes *below* the orange EMA line, it's taken as a sign that the short-term trend is weakening, and the strategy will close the position to lock in profits or cut losses. A red "sell" triangle will appear above that candle.
Best Use:
This strategy was built with Bitcoin in mind and tends to perform best on higher timeframes like the Weekly charts. It aims to capture major swings rather than small, quick scalps.
You can adjust all the settings for the RSI, Stochastic RSI, and the Exit EMA to fine-tune the strategy to your own trading style.

EMA CROSS STRATEGY MAXTRA ENTRY LOGIC
Long Entry (Buy Signal):
Condition: Short EMA crosses above Long EMA (Golden Cross)
Interpretation: A potential upward trend is beginning
Short Entry (Sell Signal):
Condition: Short EMA crosses below Long EMA (Death Cross)
Interpretation: A potential downward trend is beginning
EXIT LOGIC
There are a few options depending on the style of strategy:
Option 1: Opposite Crossover
Exit Long: When Short EMA crosses below Long EMA
Exit Short: When Short EMA crosses above Long EMA
This method keeps you in the trade until the trend reverses.
Option 2: Fixed Stop Loss / Take Profit
Exit trade when a profit target or stop loss is hit
Example: 2% stop loss and 4% take profit
Note : In Properties, go to Initial Margin. Add one more zero to get the backtest results for futures trades. For spot, use it as it is.

Dwaggy Scalping Trio (VWAP + EMA + RSI)First attempt at pine script this is a scalping indicator that combines VWAP, EMA, and RSI to signal entry/exit for scalping lower time frames

Elite Momentum Scalper🎯 Perfect For
Scalpers Who Want:
Quick In-and-Out Trades: Designed for 1-15 minute timeframes but works very well on the higer timeframes. Especiall Designed for : Indices ie NAS100 SPX in the New York Session but does work in London session also.
High Win Rate: Multiple confirmations reduce false signals
Consistent Risk: Same risk per trade, every trade
Clean Charts: No indicator spaghetti, just clear signals
Best Markets: Indices ie NAS100 SPX New York Session
Forex Majors: EUR/USD, GBP/USD, USD/JPY
Precious Metals: XAU/USD (Gold), XAG/USD (Silver)
Crypto: BTC/USD, ETH/USD (works 24/7)
Indices: SPX, NAS, DAX during active sessions
Optimal Timeframes:
Primary: 5-minute, 15-minute charts
Works On: Any timeframe (auto-adjusts)
Session-Aware: Best during London/NY overlap
🚨 Built-in Alerts
Never miss a trade:
Entry Alerts: "LONG ENTRY at 1.2345 SL: 1.2300 TP: 1.2400"
Exact Levels: Includes entry, stop, and target prices
Mobile Friendly: Works with TradingView mobile alerts
💡 Pro Tips for Best Results
Setup Recommendations:
Start Conservative: Begin with 1% risk per trade
Respect Sessions: Best results during London/NY hours
Don't Override: Let the cooldown system work
Monitor Dashboard: Keep an eye on daily trade count
Backtest First: Test on historical data before live trading
Risk Management:
Never risk more than you can afford to lose
Use proper position sizing (built-in calculator)
Respect the stop losses (they're there for a reason)
Monitor during high-impact news events
🏆 Why The Elite One?
Based on Fabio Valentini's proven #1 scalper methodology, this isn't just another indicator—it's a complete trading system that:
✅ Eliminates Guesswork: Exact entry, stop, and target levels
✅ Manages Risk: Built-in position sizing and risk management
✅ Prevents Overtrading: Smart cooldown system
✅ Adapts to Markets: ATR-based levels adjust to volatility
✅ Saves Time: All information in one clean dashboard
✅ Works Anywhere: Any market, any timeframe
✅ Stays Clean: No chart clutter, just actionable signals
Join thousands of traders who've upgraded their scalping game with the world's #1 scalper's methodology, refined into institutional-grade precision with retail-friendly execution.
⚠️ Important Disclaimers
Past performance does not guarantee future results
Trading involves substantial risk of loss
Test thoroughly on demo accounts first
Consider broker spreads in your calculations
Not financial advice - trade at your own risk
📈 Ready to Transform Your Trading?
Add The Elite One to your chart and experience the difference that professional-grade trading tools based on proven scalping methodology can make.
Remember: The best traders don't just follow signals—they understand their tools. Take time to learn the system, backtest thoroughly, and always trade responsibly.
Happy Trading! 🚀
The Elite One - Based on Fabio Valentini's #1 Scalper Methodology ⚡️
FractalReversalStrategyFiltered(ETH 5min) The profit that is shown in the strategy report uses a capital of 240 USD with 10x leverage. Only use this strategy in ETHUSD (5 MIN timeframe).

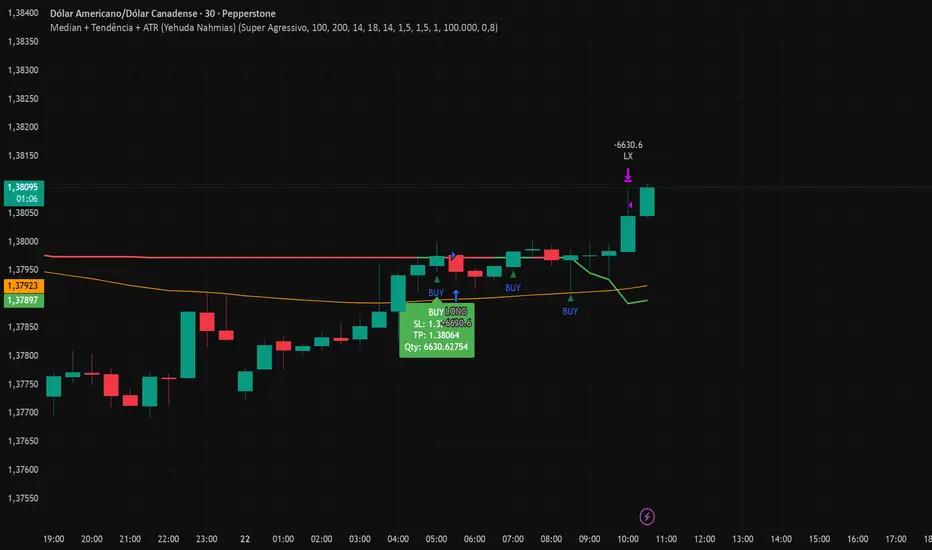
Median + Tendência + ATR (Yehuda Nahmias)📊 Median + Trend + ATR (By Yehuda Nahmias)
🚀 The indicator that combines Simplicity, Accuracy, and Risk Management
This script brings together three key pillars of professional trading:
✅ Dynamic Median → captures price midpoints and highlights reversal and breakout zones.
✅ Trend Filter (EMA) → ensures signals are aligned with the main market direction.
✅ Smart ADX + ATR → confirm trend strength and automatically calculate Stop Loss and Take Profit based on volatility.
🔔 How it works:
Buy/Sell Arrows: automatically appear when price crosses the median under valid trend and strength conditions (ADX).
Automatic Stops and Targets: SL and TP levels are plotted using ATR, ready for effective risk management.
3 Signal Modes:
🛡️ Conservative → fewer trades, stronger filtering.
⚖️ Standard → balance between frequency and accuracy.
⚡ Aggressive → more trades, captures shorter moves.
💡 Key Benefits:
Clear visuals: colored candles + BUY/SELL arrows.
Built-in risk management: position size is calculated based on % of equity.
Flexible: works on any asset (Forex, Crypto, Indices, Stocks).
🔑 Private access only.
If you’d like to use this strategy on your charts, contact me via my TradingView profile.
👉 Turn your analysis into objective signals and gain more confidence in your entries and exits!
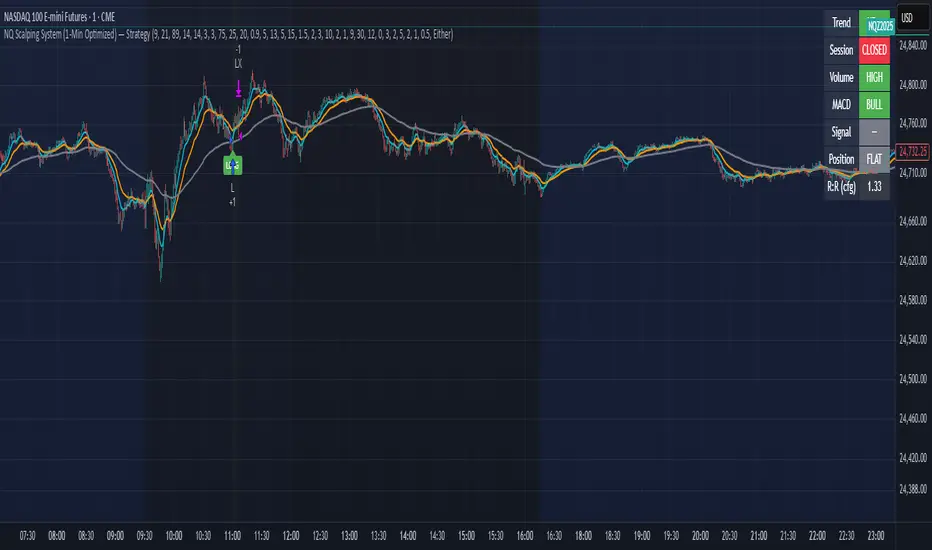
NQ Scalping System (1-Min Optimized) — StrategyNQ Scalping System — What this does (in plain English)
You’re buying pullbacks in an uptrend and selling pullbacks in a downtrend.
Trend = EMA89. Entries lean on EMA8/EMA21 touches + a StochRSI reset & cross so you’re not chasing candles. Optional Volume and MACD filters keep you out of weak moves. A time window avoids dead markets and the first noisy minute.
Long setup
Price above EMA89 (trend up)
Price pulls back to EMA8 (or EMA21 if fallback is on) by at least your Min Pullback (NQ points)
StochRSI resets to oversold and %K crosses up %D
(Optional) Volume thrust and MACD momentum confirm
Within your session window
Short = mirror image.
Exits you control
Stop/Target: ATR-based (adaptive) or fixed scalp points
Trailing stop: only arms after price moves your way by X points, then trails by your offset
Early exit options: StochRSI fade, EMA break, trend break, or opposite divergence
Quick scalp: grab a few points or bail after X bars if nothing happens
Reality check
This is a rules → orders system. It will not match eyeballed indicator labels. Fills, gaps, and trail behavior are real. That’s the point.
How I’d run it (defaults that won’t waste your time)
Use ATR stops/targets by default
EMA21 fallback = ON (you’ll miss fewer good pullbacks)
MACD filter = ON when choppy; OFF when trends are clean
Volume multiplier: start modest, bump it up if you get chopped
Session: keep RTH (e.g., 09:30–15:45 ET) and skip the first minute
Quick presets for higher timeframes
Use these as starting points and then nudge to taste.
5-Minute (intraday swings)
OB/OS: 80 / 20
Volume Multiplier: 1.3
MACD: 8 / 21 / 5
ATR Stop× / Target×: 1.8–2.2 / 2.5–3.0
Min Pullback: 1.0–1.5 pts
Quick Scalp: 6–10 pts, Bars: 12–20
Trailing: Activation 6–8 pts, Offset 3–4 pts
Divergence: Hidden ON, MTF OFF
15-Minute (session legs)
OB/OS: 85 / 15
Volume Multiplier: 1.4
MACD: 8 / 21 / 5
ATR Stop× / Target×: 2.0–2.5 / 3.0–4.0
Min Pullback: 1.5–2.5 pts
Quick Scalp: 12–18 pts, Bars: 16–30
Trailing: Activation 10–14 pts, Offset 5–6 pts
Divergence: Hidden ON, MTF ON (LTF = 5m)
30-Minute (bigger intraday trends)
OB/OS: 88 / 12
Volume Multiplier: 1.5
MACD: 12 / 26 / 9 (or 8 / 21 / 5 if you want faster)
ATR Stop× / Target×: 2.2–2.8 / 3.5–5.0
Min Pullback: 2.5–4.0 pts
Quick Scalp: 18–28 pts, Bars: 20–40
Trailing: Activation 16–24 pts, Offset 6–8 pts
Divergence: Hidden ON, MTF ON (LTF = 5m or 15m)
1-Hour (multi-hour swings)
OB/OS: 90 / 10
Volume Multiplier: 1.6–1.8
MACD: 12 / 26 / 9
ATR Stop× / Target×: 2.5–3.5 / 4.0–6.0
Min Pullback: 4–7 pts
Quick Scalp: 30–50 pts, Bars: 24–60
Trailing: Activation 28–40 pts, Offset 10–15 pts
Divergence: Hidden ON, MTF ON (LTF = 15m)
Tuning tips (read this)
Getting chopped? Raise Min Pullback, raise Volume Multiplier, leave MACD ON, and narrow your session.
Missing moves? Turn EMA21 fallback ON, lower Volume Multiplier, relax OB/OS (e.g., 75/25 on 5m).
Flat days? Use Quick Scalp and a tighter Trail Activation to lock gains.
The Best Strategy Template[LuciTech]Hello Traders,
This is a powerful and flexible strategy template designed to help you create, backtest, and deploy your own custom trading strategies. This template is not a ready-to-use strategy but a framework that simplifies the development process by providing a wide range of pre-built features and functionalities.
What It Does
The LuciTech Strategy Template provides a robust foundation for building your own automated trading strategies. It includes a comprehensive set of features that are essential for any serious trading strategy, allowing you to focus on your unique trading logic without having to code everything from scratch.
Key Features
The LuciTech Strategy Template integrates several powerful features to enhance your strategy development:
•
Advanced Risk Management: This includes robust controls for defining your Risk Percentage per Trade, setting a precise Risk-to-Reward Ratio, and implementing an intelligent Breakeven Stop-Loss mechanism that automatically adjusts your stop to the entry price once a specified profit threshold is reached. These elements are crucial for capital preservation and consistent profitability.
•
Flexible Stop-Loss Options: The template offers adaptable stop-loss calculation methods, allowing you to choose between ATR-Based Stop-Loss, which dynamically adjusts to market volatility, and Candle-Based Stop-Loss, which uses structural price points from previous candles. This flexibility ensures the stop-loss strategy aligns with diverse trading styles.
•
Time-Based Filtering: Optimize your strategy's performance by restricting trading activity to specific hours of the day. This feature allows you to avoid unfavorable market conditions or focus on periods of higher liquidity and volatility relevant to your strategy.
•
Customizable Webhook Alerts: Stay informed with advanced notification capabilities. The template supports sending detailed webhook alerts in various JSON formats (Standard, Telegram, Concise Telegram) to external platforms, facilitating real-time monitoring and potential integration with automated trading systems.
•
Comprehensive Visual Customization: Enhance your analytical clarity with extensive visual options. You can customize the colors of entry, stop-loss, and take-profit lines, and effectively visualize market inefficiencies by displaying and customizing Fair Value Gap (FVG) boxes directly on your chart.
How It Does It
The LuciTech Strategy Template is meticulously crafted using Pine Script, TradingView's powerful and expressive programming language. The underlying architecture is designed for clarity and modularity, allowing for straightforward integration of your unique trading signals. At its core, the template operates by taking user-defined entry and exit conditions and then applying a sophisticated layer of risk management, position sizing, and trade execution logic.
For instance, when a longCondition or shortCondition is met, the template dynamically calculates the appropriate position size. This calculation is based on your specified risk_percent of equity and the stop_distance (the distance between your entry price and the calculated stop-loss level). This ensures that each trade adheres to your predefined risk parameters, a critical component of disciplined trading.
The flexibility in stop-loss calculation is achieved through a switch statement that evaluates the sl_type input. Whether you choose an ATR-based stop, which adapts to market volatility, or a candle-based stop, which uses structural price points, the template seamlessly integrates these methods. The ATR calculation itself is further refined by allowing various smoothing methods (RMA, SMA, EMA, WMA), providing granular control over how volatility is measured.
Time-based filtering is implemented by comparing the current bar's time with user-defined start_hour, start_minute, end_hour, and end_minute inputs. This allows the strategy to activate or deactivate trading during specific market sessions or periods of the day, a valuable tool for optimizing performance and avoiding unfavorable conditions.
Furthermore, the template incorporates advanced webhook alert functionality. When a trade is executed, a customizable JSON message is formatted based on your webhook_format selection (Standard, Telegram, or Concise Telegram) and sent via alert function. This enables seamless integration with external services for real-time notifications or even automated trade execution through third-party platforms.
Visual feedback is paramount for understanding strategy behavior. The template utilizes plot and fill functions to clearly display entry prices, stop-loss levels, and take-profit targets directly on the chart. Customizable colors for these elements, along with dedicated options for Fair Value Gap (FVG) boxes, enhance the visual analysis during backtesting and live trading, making it easier to interpret the strategy's actions.
How It's Original
The LuciTech Strategy Template distinguishes itself in the crowded landscape of TradingView scripts through its unique combination of integrated, advanced risk management features, highly flexible stop-loss methodologies, and sophisticated alerting capabilities, all within a user-friendly and modular framework. While many templates offer basic entry/exit signal integration, LuciTech goes several steps further by providing a robust, ready-to-use infrastructure for managing the entire trade lifecycle once a signal is generated.
Unlike templates that might require users to piece together various risk management components or code complex stop-loss logic from scratch, LuciTech offers these critical functionalities out-of-the-box. The inclusion of dynamic position sizing based on a user-defined risk percentage, a configurable risk-to-reward ratio, and an intelligent breakeven mechanism significantly elevates its utility. This comprehensive approach to capital preservation and profit targeting is a cornerstone of professional trading and is often overlooked or simplified in generic templates.
Furthermore, the template's provision for multiple stop-loss calculation types—ATR-based for volatility adaptation, and candle-based for structural support/resistance—demonstrates a deep understanding of diverse trading strategies. The underlying code for these calculations is already implemented, saving developers considerable time and effort. The subtle yet powerful inclusion of FVG (Fair Value Gap) related inputs also hints at advanced price action concepts, offering a sophisticated layer of analysis and execution that is not commonly found in general-purpose templates.
The advanced webhook alerting system, with its support for various JSON formats tailored for platforms like Telegram, showcases an originality in catering to the needs of modern, automated trading setups. This moves beyond simple TradingView pop-up alerts, enabling seamless integration with external systems for real-time trade monitoring and execution. This level of external connectivity and customizable data output is a significant differentiator.
In essence, the LuciTech Strategy Template is original not just in its individual features, but in how these features are cohesively integrated to form a powerful, opinionated, yet highly adaptable system. It empowers traders to focus their creative energy on developing their core entry/exit signals, confident that the underlying framework will handle the complexities of risk management, trade execution, and external communication with precision and flexibility. It's a comprehensive solution designed to accelerate the development of robust and professional trading strategies.
How to Modify the Logic to Apply Your Strategy
The LuciTech Strategy Template is designed with modularity in mind, making it exceptionally straightforward to integrate your unique trading strategy logic. The template provides a clear separation between the core strategy management (risk, position sizing, exits) and the entry signal generation. This allows you to easily plug in your own buy and sell conditions without altering the robust underlying framework.
Here’s a step-by-step guide on how to adapt the template to your specific trading strategy:
1.
Locate the Strategy Logic Section:
Open the Pine Script editor in TradingView and navigate to the section clearly marked with the comment //Strategy Logic Example:. This is where the template’s placeholder entry conditions (a simple moving average crossover) are defined.
2.
Define Your Custom Entry Conditions:
Within this section, you will find variables such as longCondition and shortCondition. These are boolean variables that determine when a long or short trade should be initiated. Replace the existing example logic with your own custom buy and sell conditions. Your conditions can be based on any combination of indicators, price action patterns, candlestick formations, or other market analysis techniques. For example, if your strategy involves a combination of RSI and MACD, you would define longCondition as (rsi > 50 and macd_line > signal_line) and shortCondition as (rsi < 50 and macd_line < signal_line).
3.
Leverage the Template’s Built-in Features:
Once your longCondition and shortCondition are defined, the rest of the template automatically takes over. The integrated risk management module will calculate the appropriate position size based on your Risk % input and the chosen Stop Loss Type. The Risk:Reward ratio will determine your take-profit levels, and the Breakeven at R feature will manage your stop-loss dynamically. The time filter (Use Time Filter) will ensure your trades only occur within your specified hours, and the webhook alerts will notify you of trade executions.

EMA 8/33 Optimized Crossover w/FilterThis strategy is ideal for fast-moving assets like cryptocurrencies (e.g., SOLUSDT) on intraday to swing trading timeframes. Its robust filtering aims for fewer trades but with higher accuracy, producing a smoother equity curve and lower drawdown in your backtests.
You can further optimize the EMA lengths, minimum candle size, and TP/SL percentages to suit your preferred asset and timeframe.

Triple Quad Frosty v4.5Triple Quad Frosty v4.5 is a Renko-friendly strategy that lets you trade from up to four signal sources per side. Orders are only placed when your chosen conditional filters (A/B/C) agree, giving you full control over when entries are valid. You decide how signals must line up — from simple single-source triggers to majority or full agreement across all four.
Renko-based, with customizable static stops, take profits, and trailing stops. Time/day filters, daily trade limits, and forced closures let you restrict trading to specific windows.
The HTF filters in Triple Quad Frosty v4.5 use a higher-timeframe Hull Moving Average (HMA) to confirm trend direction, while slope and distance settings on the local HMA help filter out weak or choppy setups. Longs only trigger when price is above the HTF HMA and meets slope/distance requirements, and shorts only when the opposite is true.
Color-coded labels mark each exit as a win or loss, with reversal trades labeled separately for clarity. Conditional bars plotted above and below the chart show when the A/B/C filters align on a long or short bias, giving clear visual confirmation of entry conditions. Stop loss and take profit levels are plotted directly on the chart with guide lines, so you can easily track active trade management in real time.

[K] MA Deviation Strategy Pro**This strategy is designed to demonstrate strength in sideways markets (range-bound), using envelope to determine entry and SMA to determine exit.**
**Key Points:**
• **Flexible optimization**: The strategy can be optimized by operating Long (buy) and Short (sell) positions with separate and independent settings.
• **Important risk management**: Since the maximum drawdown (maximum loss) can be significant, it is recommended to operate with low leverage.
**Strategy Summary:**
- **Entry signal**: Determined by the envelope indicator
- **Exit signal**: Determined by SMA (Simple Moving Average)
- **Ideal environment**: Range-bound (sideways) markets
- **Configuration**: Long and Short with independent parameters
- **Recommendation**: Use low leverage due to high drawdown risk
This is a strategy suitable for markets that oscillate within a defined price range, without a clear upward or downward trend.
Extremum Range MA Crossover Strategy1. Principle of Work & Strategy Logic ⚙️📈
Main idea: The strategy tries to catch the moment of a breakout from a price consolidation range (flat) and the start of a new trend. It combines two key elements:
Moving Average (MA) 📉: Acts as a dynamic support/resistance level and trend filter.
Range Extremes (Range High/Low) 🔺🔻: Define the borders of the recent price channel or consolidation.
The strategy does not attempt to catch absolute tops and bottoms. Instead, it enters an already formed move after the breakout, expecting continuation.
Type: Trend-following, momentum-based.
Timeframes: Works on different TFs (H1, H4, D), but best suited for H4 and higher, where breakouts are more meaningful.
2. Justification of Indicators & Settings ⚙️
A. Moving Average (MA) 📊
Why used: Core of the strategy. It smooths price fluctuations and helps define the trend. The price (via extremes) must cross the MA → signals a potential trend shift or strengthening.
Parameters:
maLength = 20: Default length (≈ one trading month, 20-21 days). Good balance between sensitivity & smoothing.
Lower TF → reduce (10–14).
Higher TF → increase (50).
maSource: Defines price source (default = Close). Alternatives (HL2, HLC3) → smoother, less noisy MA.
maType: Default = EMA (Exponential MA).
Why EMA? Faster reaction to recent price changes vs SMA → useful for breakout strategies.
Other options:
SMA 🟦 – classic, slowest.
WMA 🟨 – weights recent data stronger.
HMA 🟩 – near-zero lag, but “nervous,” more false signals.
DEMA/TEMA 🟧 – even faster & more sensitive than EMA.
VWMA 🔊 – volume-weighted.
ZLEMA ⏱ – reduced lag.
👉 Choice = tradeoff between speed of reaction & false signals.
B. Range Extremes (Previous High/Low) 📏
Why used: Define borders of recent trading range.
prevHigh = local resistance.
prevLow = local support.
Break of these levels on close = trigger.
Parameters:
lookbackPeriod = 5: Searches for highest high / lowest low of last 5 candles. Very recent range.
Higher value (10–20) → wider, stronger ranges but rarer signals.
3. Entry & Exit Rules 🎯
Long signals (BUY) 🟢📈
Condition (longCondition): Previous Low crosses MA from below upwards.
→ Price bounced from the bottom & strong enough to push range border above MA.
Execution: Auto-close short (if any) → open long.
Short signals (SELL) 🔴📉
Condition (shortCondition): Previous High crosses MA from above downwards.
→ Price rejected from the top, upper border failed above MA.
Execution: Auto-close long (if any) → open short.
Exit conditions 🚪
Exit Long (exitLongCondition): Close below prevLow.
→ Uptrend likely ended, range shifts down.
Exit Short (exitShortCondition): Close above prevHigh.
→ Downtrend likely ended, range shifts up.
⚠️ Important: Exit = only on candle close beyond extremes (not just wick).
4. Trading Settings ⚒️
overlay = true → indicators shown on chart.
initial_capital = 10000 💵.
default_qty_type = strategy.cash, default_qty_value = 100 → trades fixed $100 per order (not lots). Can switch to % of equity.
commission_type = strategy.commission.percent, commission_value = 0.1 → default broker fee = 0.1%. Adjust for your broker!
slippage = 3 → slippage = 3 ticks. Adjust to asset liquidity.
currency = USD.
margin_long = 100, margin_short = 100 → no leverage (100% margin).
5. Visualization on Chart 📊
The strategy draws 3 lines:
🔵 MA line (thickness 2).
🔴 Previous High (last N candles).
🟢 Previous Low (last N candles).
Also: entry/exit arrows & equity curve shown in backtest.
Disclaimer ⚠️📌
Risk Warning: This description & code are for educational purposes only. Not financial advice. Trading (Forex, Stocks, Crypto) carries high risk and may lead to full capital loss. You trade at your own risk.
Testing: Always backtest & demo test first. Past results ≠ future profits.
Responsibility: Author of this strategy & description is not responsible for your trading decisions or losses.

Hazel nut BB Strategy, volume base- lite versionHazel nut BB Strategy, volume base — lite version
Having knowledge and information in financial markets is only useful when a trader operates with a well-defined trading strategy. Trading strategies assist in capital management, profit-taking, and reducing potential losses.
This strategy is built upon the core principle of supply and demand dynamics. Alongside this foundation, one of the widely used technical tools — the Bollinger Bands — is employed to structure a framework for profit management and risk control.
In this strategy, the interaction of these tools is explained in detail. A key point to note is that for calculating buy and sell volumes, a lower timeframe function is used. When applied with a tick-level resolution, this provides the most precise measurement of buyer/seller flows. However, this comes with a limitation of reduced historical depth. Users should be aware of this trade-off: if precise tick-level data is required, shorter timeframes should be considered to extend historical coverage .
The strategy offers multiple configuration options. Nevertheless, it should be treated strictly as a supportive tool rather than a standalone trading system. Decisions must integrate personal analysis and other instruments. For example, in highly volatile assets with narrow ranges, it is recommended to adjust profit-taking and stop-loss percentages to smaller values.
◉ Volume Settings
• Buyer and seller volume (up/down volume) are requested from a lower timeframe, with an option to override the automatic resolution.
• A global lookback period is applied to calculate moving averages and cumulative sums of buy/sell/delta volumes.
• Ratios of buyers/sellers to total volume are derived both on the current bar and across the lookback window.
◉ Bollinger Band
• Bands are computed using configurable moving averages (SMA, EMA, RMA, WMA, VWMA).
• Inputs allow control of length, standard deviation multiplier, and offset.
• The basis, upper, and lower bands are plotted, with a shaded background between them.
◉ Progress & Proximity
• Relative position of the price to the Bollinger basis is expressed as percentages (qPlus/qMinus).
• “Near band” conditions are triggered when price progress toward the upper or lower band exceeds a user-defined threshold (%).
• A signed score (sScore) represents how far the close has moved above or below the basis relative to band width.
◉ Info Table
• Optional compact table summarizing:
• - Upper/lower band margins
• - Buyer/seller volumes with moving averages
• - Delta and cumulative delta
• - Buyer/seller ratios per bar and across the window
• - Money flow values (buy/sell/delta × price) for bar-level and summed periods
• The table is neutral-colored and resizable for different chart layouts.
◉ Zone Event Gate
• Tracks entry into and exit from “near band” zones.
• Arming logic: a side is armed when price enters a band proximity zone.
• Trigger logic: on exit, a trade event is generated if cumulative buyer or seller volume dominates over a configurable window.
◉ Trading Logic
• Orders are placed only on zone-exit events, conditional on volume dominance.
• Position sizing is defined as a fixed percentage of strategy equity.
• Long entries occur when leaving the lower zone with buyer dominance; short entries occur when leaving the upper zone with seller dominance.
◉ Exit Rules
• Open positions are managed by a strict priority sequence:
• 1. Stop-loss (% of entry price)
• 2. Take-profit (% of entry price)
• 3. Opposite-side event (zone exit with dominance in the other direction)
• Stop-loss and take-profit levels are configurable
◉ Notes
• This lite version is intended to demonstrate the interaction of Bollinger Bands and volume-based dominance logic.
• It provides a framework to observe how price reacts at band boundaries under varying buy/sell pressure, and how zone exits can be systematically converted into entry/exit signals.
When configuring this strategy, it is essential to carefully review the settings within the Strategy Tester. Ensure that the chosen parameters and historical data options are correctly aligned with the intended use. Accurate back testing depends on applying proper configurations for historical reference. The figure below illustrates sample result and configuration type.

2 of 3 Confluence StrategyA strategy created for swing and positional trading on stocks and index. Best to use on daily or minimum hourly time frame. It will also work in smaller time frames but there will be some noise.

Liquidation Strategy📈 It enters a long trade when long liquidation spikes above a set threshold.
📉 It enters a short trade when short liquidation drops below the negative threshold.
🧮 It optionally filters entries using an EMA multiplier.
🔁 It exits long when RSI crosses below its smoothed version.
🔄 It exits short when RSI crosses above its smoothed version.
🔗 It requires linking to the Liquidations indicator on Bybit or OKX charts.

Trend Strength Index Long Strategy📈 Trend Strength Index Long Strategy
This strategy combines the Trend Strength Index (TSI) with a Volume-Weighted Moving Average (VWMA) to identify high-probability long entries based on trend momentum and price confirmation.
📊 TSI Calculation : Measures correlation between price and time (bar index) over a user-defined period. Strong TSI values indicate trend momentum.
📏 VWMA Filter : Confirms bullish bias when price is above the VWMA.
🚀 Entry Condition : Long position is triggered when TSI crosses above -0.65 and price is above VWMA.
🔒 Exit Condition : Position is closed when TSI crosses above 0.65.
🎨 Visuals : Gradient fills highlight bullish and bearish zones. VWMA is plotted for trend context.
🧮 TSI Length: Adjustable (default 14)
📐 VWMA Length: Adjustable (default 55)
💸 Commission: 0.1% per trade
📊 Position Size: 75% of equity
⚙️ Slippage: 10 ticks
✅ Best used in trending markets with steady momentum.
⚠️ Avoid in choppy or range-bound conditions.

The Real Deal v3.0The Real Deal v3.0 blends multiple layers of market structure into a single adaptive framework. Using a Gaussian price channel as its backbone, it adds dynamic confirmation from EMA filters, cloud-style trend detection, and a proprietary “Secret Sauce” momentum engine. Flexible trade direction, optional TP/SL management, and configurable entry/exit triggers allow the strategy to adapt to changing conditions. The result is a system designed to identify high-probability trades while filtering out the noise—simple on the surface, but with deeper mechanics under the hood.

回撤再入场引擎This is a long-only, counter-trend strategy that aims to buy dips in a medium-term downtrend. The entry logic is based on a confluence of four filters:
1. **Trend Filter:** The price must be trading below the 60-period Simple Moving Average (SMA).
2. **Oversold Condition:** The WaveTrend Oscillator must first dip below -60 and then recover above -55.
3. **Momentum Confirmation:** The MACD must show sustained bullish momentum for at least 2 bars.
4. **Re-entry Filter:** A new trade is only allowed if the price is at least a certain percentage lower than the last trade's exit price.
The exit is based on a fixed Take Profit target. This version does not include a stop-loss.

Penguin Volatility State StrategyThe Penguin Volatility State Strategy is a comprehensive technical analysis framework designed to identify the underlying "state" or "regime" of the market. Instead of just providing simple buy or sell signals, its primary goal is to classify the market into one of four distinct states by combining trend, momentum, and volatility analysis.
The core idea is to trade only when these three elements align, focusing on periods of volatility expansion (a "squeeze breakout") that occur in the direction of a confirmed trend and are supported by strong momentum.
Key Components
The strategy is built upon two main engines
The Volatility Engine (Bollinger Bands vs. Keltner Channels)
This engine detects periods of rapidly increasing volatility. It measures the percentage difference (diff) between the upper bands of Bollinger Bands (which are based on standard deviation) and Keltner Channels (based on Average True Range). During a volatility "squeeze," both bands are close. When price breaks out, the Bollinger Band expands much faster than the Keltner Channel, causing the diff value to become positive. A positive diff signals a volatility breakout, which is the moment the strategy becomes active.
The Trend & Momentum Engine (Multi-EMA System)
This engine determines the market's direction and strength. It uses:
A Fast EMA (e.g., 12-period) and a Slow EMA (e.g., 26-period): The crossover of these two moving averages defines the primary, underlying trend (similar to a MACD).
An Ultra-Fast EMA (e.g., 2-period of ohlc4): This is used to measure the immediate, short-term momentum of the price.
The Four Market States
By combining the Trend and Momentum engines, the strategy categorizes the market into four visually distinct states, represented by the chart's background color. This is the most crucial aspect of the system.
💚 Green State: Strong Bullish
The primary trend is UP (Fast EMA > Slow EMA) AND the immediate momentum is STRONG (Price > Fast EMA).
Interpretation: This represents a healthy, robust uptrend where both the underlying trend and short-term price action are aligned. It is considered the safest condition for taking long positions.
❤️ Red State: Strong Bearish
Condition: The primary trend is DOWN (Fast EMA < Slow EMA) AND the immediate momentum is WEAK (Price < Fast EMA).
Interpretation: This represents a strong, confirmed downtrend. It is considered the safest condition for taking short positions.
💛 Yellow State: Weakening Bullish / Pullback
Condition: The primary trend is UP (Fast EMA > Slow EMA) BUT the immediate momentum is WEAK (Price < Fast EMA).
Interpretation: This is a critical warning signal for bulls. While the larger trend is still up, the short-term price action is showing weakness. This could be a minor pullback, a period of consolidation, or the very beginning of a trend reversal. Caution is advised.
💙 Blue State: Weakening Bearish / Relief Rally
Condition: The primary trend is DOWN (Fast EMA < Slow EMA) BUT the immediate momentum is STRONG (Price > Fast EMA).
Interpretation: This signals that a downtrend is losing steam. It often represents a short-covering rally (a "bear market rally") or the first potential sign of a market bottom. Bears should be cautious and consider taking profits.
How the Strategy Functions
The strategy uses these four states as its foundation for making trading decisions. The entry and exit arrows (Long, Short, Close) are generated based on a set of rules that can be customized by the user. For instance, a trader can configure the strategy to
Only take long trades during the Green State.
Require a confirmed volatility breakout (diff > 0) before entering a trade.
Use the "RSI on Diff" indicator to ensure that the breakout is supported by accelerating momentum.
Summary
In essence, the Penguin Volatility State Strategy provides a powerful "dashboard" for viewing the market. It moves beyond simple indicators to offer a contextual understanding of price action. By waiting for the alignment of Trend (the State), Volatility (the Breakout), and Momentum (the Acceleration), it helps traders to identify higher-probability setups and, just as importantly, to know when it is better to stay out of the market.
License / disclaimer
© waranyu.trkm — MIT License. Educational use only; not financial advice.

VWAP Trend Strategy (Intraday) [KedarArc Quant]Description:
An intraday strategy that anchors to VWAP and only trades when a local EMA trend gate and a volume participation gate are both open. It offers two entry templates—Cross and Cross-and-Retest—with an optional Momentum Exception for impulsive moves. Exits combine a TrendBreak (structure flips) with an ATR emergency stop (risk cap).
Updates will be published under this script.
Why this merits a new script
This is not a simple “VWAP + EMA + ATR” overlay. The components are sequenced as gates and branches that *change the trade set* in ways a visual mashup cannot:
1. Trend Gate first (EMA fast vs. slow on the entry timeframe)
Counter-trend VWAP crosses are suppressed. Many VWAP scripts fire on every cross; here, no entry logic even evaluates unless the trend gate is open.
2. Participation Gate second (Volume SMA × multiplier)
This gate filters thin liquidity moves around VWAP. Without it, the same visuals would produce materially more false triggers.
3. Branching entries with structure awareness
* Cross: Immediate VWAP cross in the trend direction.
* Cross-and-Retest: Requires a revisit to VWAP vicinity within a lookback window (recent low near VWAP for longs; recent high for shorts). This explicitly removes first-touch fakeouts that a plain cross takes.
* Momentum Exception (optional): A quantified body% + volume condition can bypass the retest when flow is impulsive—intentional risk-timing, not “just another indicator.”
4. Dual exits that reference both anchor and structure
* TrendBreak: Close only when price loses VWAP and EMA alignment flips.
* ATR stop: Placed at entry to cap tail risk.
These exits complement the entry structure rather than being generic stop/target add-ons.
What it does
* Trades the session’s fair value anchor (VWAP), but only with local-trend agreement (EMA fast vs. slow) and sufficient participation (volume filter).
* Lets you pick Cross or Cross-and-Retest entries; optionally allow a fast Momentum Exception when candles expand with volume.
* Manages positions with a structure exit (TrendBreak) and an emergency ATR stop from entry.
How it works (concepts & calculations)
* VWAP (session anchor):
Standard VWAP of the active session; entries reference the cross and the retest proximity to VWAP.
* Trend gate:
Long context only if `EMA(fast) > EMA(slow)`; short only if `EMA(fast) < EMA(slow)`.
A *gate*, not a trigger—entries aren’t considered unless this is true.
* Participation (volume) gate:
Require `volume > SMA(volume, volLen) × volMult`.
Screens out low-participation wiggles around VWAP.
Entries:
* Cross: Price crosses VWAP in the trend direction while volume gate is open.
* Cross-and-Retest: After crossing, price revisits VWAP vicinity within `lookback` (recent *low near VWAP* for longs; recent *high near VWAP* for shorts).
* Momentum Exception (optional): If body% (|close−open| / range) and volume exceed thresholds, enter without waiting for the retest.
Exits:
* TrendBreak (structure):
* Longs close when `price < VWAP` and `EMA(fast) < EMA(slow)` (mirror for shorts).
* ATR stop (risk):
* From entry: `stop = entry ± ATR(atrLen) × atrMult`.
How to use it ?
1. Select market & timeframe: Intraday on liquid symbols (equities, futures, crypto).
2. Pick entry mode:
* Start with Cross-and-Retest for fewer, more selective signals.
* Enable Momentum Exception if strong moves leave without retesting.
3. Tune guards:
* Raise `volMult` to ignore thin periods; lower it for more activity.
* Adjust `lookback` if retests come late/early on your symbol.
4. Risk:
* `atrLen` and `atrMult` set the emergency stop distance.
5. Read results per session: Optional panel (if enabled) summarizes Net-R, Win%, and PF for today’s session to evaluate
behavior regime by regime.
⚠️ Disclaimer
This script is provided for educational purposes only.
Past performance does not guarantee future results.
Trading involves risk, and users should exercise caution and use proper risk management when applying this strategy.
