Dynamic Strike Selection Indicator [ARJO]Dynamic Strike Selection Indicator
OVERVIEW
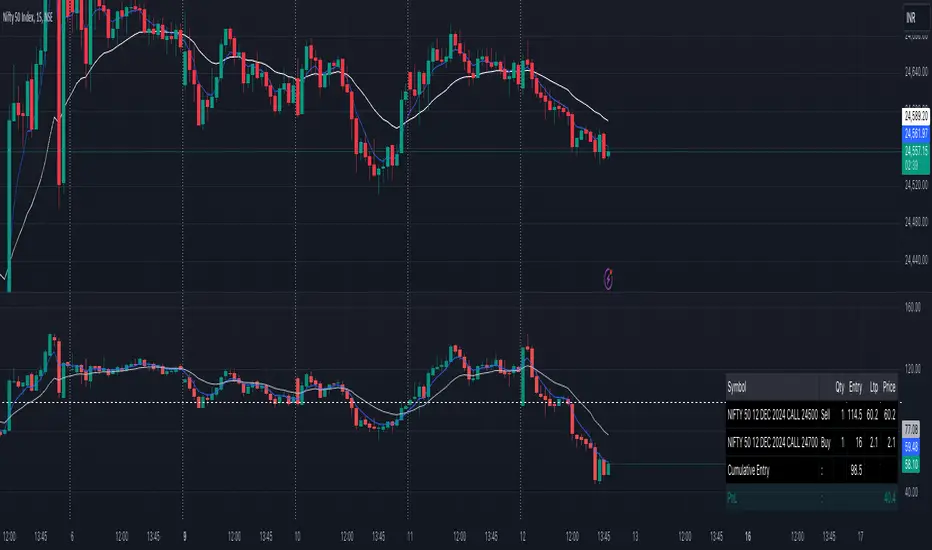
The Dynamic Strike Selection Indicator is a visual analysis tool designed for traders observing NSE (National Stock Exchange of India) instruments, particularly those interested in options. It displays a trend-based oscillator in the lower chart pane and automatically calculates option strike prices , presenting them in an easy-to-read table. The indicator helps users observe trend changes and understand how option strikes might be selected based on current market conditions.
IT has a dashboard that shows you:
Where the trend might be heading (through the oscillator)
What option strikes align with the current price level
When trend transitions occurred
CONCEPTS
This indicator combines several technical analysis concepts in a beginner-friendly format:
1. Trend Observation (Chandelier Exit)
The indicator uses a method called "Chandelier Exit" which observes price volatility to identify potential trend directions. When the indicator shows green, it suggests an upward trend pattern; red suggests a downward pattern. These are reference points, not predictions.
2. Smoothed Price Movement
Raw price data can be noisy. This indicator applies mathematical smoothing (called "Ehlers 2-Pole filter") to reduce short-term fluctuations, making it easier to observe the underlying trend direction.
3. Momentum Oscillator
The oscillator (displayed as bars and lines in the lower pane) shows the difference between smoothed price and its moving average. Positive values suggest upward momentum; negative values suggest downward momentum . This is similar to how MACD or LBR works.
4. Strike Price Calculation
For option traders , the indicator automatically calculates:
ATM (At-The-Money): The strike price closest to the current underlying price
OTM (Out-of-The-Money): Strike prices at a distance from ATM, based on your settings
These calculations use standard rounding methods based on each instrument's official strike interval.
FEATURES
Visual Components:
Color-Coded Oscillator: Green/teal for potential uptrend, purple/red for potential downtrend
Histogram Display: Visual bars showing momentum strength
Chandelier Exit Lines: Plotted on the main price chart as reference levels
Information Table: Displays calculated strikes, timestamps, and optional tracking data
Supported Instruments:
Major indices: NIFTY, BANKNIFTY
Popular stocks: RELIANCE, HDFCBANK, ICICIBANK, INFY, TCS, SBIN, and more
Any NSE instrument (using manual strike interval setting)
Flexible Configuration:
Choose between "Sell Mode" and "Buy Mode" perspectives
Customize strike interval for any instrument
Adjust sensitivity of trend detection
Modify visual appearance (colors, table position, text size)
Track entry prices and observe P&L calculations (for reference only)
Features:
Automatic strike interval detection for predefined instruments
Manual override option for custom requirements
Real-time option premium fetching (where available)
Timestamp recording of trend transitions
Active trade highlighting based on current trend
HOW TO USE
Step 1: Adding the Indicator
Open your TradingView chart with an NSE instrument (e.g., NIFTY, BANKNIFTY, or any stock)
Search for " Dynamic Strike Selection Indicator " in the Indicators menu
Click to add it to your chart
You'll see an oscillator appear in a pane below your price chart and a table in the corner
Step 2: Basic Settings
Click the settings (gear icon) on the indicator. Here are the key settings to understand:
Symbol Settings:
Symbol Source: Keep it on " Use Chart Symbol " to analyze whatever instrument is on your chart
Custom Symbol: Only change if you want to analyze a different instrument while viewing another chart
Expiry Date:
Set the expiry date of the option contracts you're observing
Use the dropdown menus for Day, Month, and Year
Example: For 30th January 2025, select Day: 30, Month: 01, Year: 25
Trade Entry (Optional):
Trade Mode: Choose "Sell" or "Buy" based on your observation perspective
Lot Size: Enter your intended lot size for P&L calculation reference
PUT/CALL Entry Price: Manually enter prices if you want to track reference P&L
OTM Strike Distance:
Default is 4 (means 4 strikes away from ATM)
Increase for further OTM strikes, decrease for closer strikes
Step 3: Understanding the Display
The Oscillator (Lower Pane):
Green/Teal Bars: Suggest bullish momentum characteristics
Purple/Red Bars: Suggest bearish momentum characteristics
Zero Line: The reference point - above suggests strength, below suggests weakness
Color Change: When the oscillator changes from red to green (or vice versa), it indicates a potential trend transition
Active Row Highlighting:
In Sell Mode: Green background on PUT row during uptrend, Red background on CALL row during downtrend
In Buy Mode: Green background on PUT row during downtrend, Red background on CALL row during uptrend
This helps you observe which strike aligns with the current trend direction
Visual Customization:
Change oscillator colors under "Color Settings"
Adjust table position, size, and transparency under "Table Settings"
Modify table colors to match your chart theme
NOTES FOR BEGINNERS
Start Simple: Use default settings first. Don't change too many parameters initially.
Paper Trade First: Observe the indicator for several days before considering any real trades. Note how often trend transitions occur and how strikes align.
Understand Your Instrument: Know the strike interval for your chosen stock/index. NIFTY/BANKNIFTY use 100, most stocks use 10, 20, or 50.
Timeframe Matters: The indicator behaves differently on different timeframes. A 5-minute chart will show more transitions than a 1-hour chart.
Use with Other Analysis: This indicator is one tool among many. Combine with price action, support/resistance, and volume analysis.
Don't Chase: Just because a transition occurs doesn't mean you must act. Observe the quality of the move.
Backtest Observations: Use TradingView's replay feature to observe how the indicator performed historically.
CONCLUSION
The Dynamic Strike Selection Indicator serves as an educational tool for observing trend-based oscillator patterns and understanding how option strikes might be mathematically selected based on current market conditions. It combines visual trend analysis with structured strike price calculations, helping users study the relationship between momentum patterns and option strike references.
The indicator is designed to enhance chart interpretation skills and provide transparency into strike selection methodologies. It does not predict future price movements or guarantee any outcomes. Users are encouraged to use it as one component of a broader analytical approach, always conducting independent research and maintaining realistic expectations about market analysis tools.
DISCLAIMER
This indicator is strictly for educational and analytical observation purposes. It is NOT a trading system, signal generator, or financial advisory service.
What This Indicator Does NOT Do:
Does not predict future price movements with certainty
Does not guarantee profitable trades or outcomes
Does not constitute financial, investment, or trading advice
Does not replace the need for independent research and analysis
Does not eliminate trading risks or ensure success
What You Must Understand:
All calculated strikes, P&L values, and trend observations are informational references only
Option trading involves substantial risk and can result in complete loss of invested capital
Past indicator performance does not predict future results
Trend transitions shown are historical observations, not predictions
The "active" highlighting is a visual reference tool, not a trade recommendation
Conduct thorough independent research before taking any trading decision. and consult qualified, licensed financial professionals for personalized advice.
The creator of this indicator is not a registered investment advisor, broker, or financial planner. This tool is provided "as is" without warranties of any kind. By using this indicator, you acknowledge that you understand these risks and limitations, and you agree that all trading decisions and their consequences are solely your responsibility. If you do not fully understand these risks or are unsure about options trading, do not use this indicator for live trading .
Nseindia

Virgin-VWAPThis draws the Virgin levels of VWAP.
It gives a visual representation of Volume-Weighted Gap Map.
Visual "Fill": It looks like a "Gap Fill" indicator. The lines will look like rectangles or "beams" shooting across the chart, stopping exactly where the market "filled" that price level.
Trimmed lines: The virgin line gets trimmed once touched. This tells you: "This level was hit, it might still be support/resistance, but the 'Virgin' status is gone."
Terminal Labels: A vigin vwap lines carries the price label so ones can see the strike's value at a glance.
Clean Forward Space: Because the lines stop when touched, your "future" chart (the empty space to the right) won't be cluttered with old lines that are no longer relevant. You will only see the lines for levels that haven't been hit yet extending into the empty space.
Was built for NSE options in mind, seeing those "beams" of historical value stop exactly where price met them is a powerful way to visualize where the market has found "fair value" versus where there are still "unfilled orders."
PS: Built with Gemini 3!!

Session Anchored OIWAP [Arjo]The Session Anchored OIWAP (Open Interest Weighted Average Price) indicator shows you a weighted average price that uses Open Interest (OI) changes during different trading sessions . It divides the day into four clear sessions: Opening Hour , Morning Session , Mid-Day Session , and Closing Session .
For each session , it calculates a weighted average price using both market price and open interest data from futures . This line updates as the session progresses and resets when a new session starts .
You can also see optional deviation bands that you visually compare to how far the market price is moving away from the session’s weighted average. This indicator also helps you watch how Open Interest changes connect with price movements during specific market hours.
Concepts
This tool works on a few simple ideas:
Session anchoring
Each session starts fresh. The indicator resets and begins a new calculation when a new time block begins. This allows users to visually study each session independently.
Open-interest weighting
Instead of treating all price moves equally, price changes linked to higher open-interest activity have more influence on the OIWAP. This gives a weighted reflection of where the market has been trading during the session.
Averaging and smoothing
The OIWAP line blends many price data points into one smooth curve, making it easier to follow than raw price movement.
Volatility display with bands
The upper and lower bands are placed at ±0.5 standard deviation from the OIWAP line. These bands simply help you see when price stretches further away than usual from the session average.
Features
Four Independent Session Calculations: Shows separate OIWAP lines for Opening Hour (default: 09:15-10:15), Morning (10:15-11:30), Mid-Day (11:30-14:00), and Closing (14:00-15:30) sessions
Open Interest Weighting: Uses absolute OI change as the weight instead of traditional volume
Customizable Session Times: You can change the time ranges for each session to match your market or what you need
Optional Deviation Bands: You can turn ±0.5 standard deviation bands on or off around each OIWAP line
Color-Coded Sessions: Each session has its own color so you can tell them apart easily
Selective Display: You can turn individual sessions and bands on or off
Data Availability Check: Shows you a notification when Open Interest data isn't available for your symbol
Adjustable Position Timeframe: You can calculate OI changes on different timeframes (Chart, Daily, 15min, 30min, 60min, 120min)
How to use
Add this indicator to a chart of any symbol that has Open Interest data ( from futures or derivatives contracts). Once you add it, you'll see colored lines showing the OIWAP for each session you enable, along with optional deviation bands.
Adjusting Settings:
Turn individual sessions on or off using the checkboxes in the " Sessions " section
Change session colors to match your chart or what looks good to you
Turn deviation bands on or off using the " Show Bands " option in the Display settings
Change session time ranges in the " Session Times " section to match your market hours or what you want to analyze
Change the Position Timeframe if you want to see OI changes calculated on a different time period
Visual Interpretation:
Each OIWAP line shows you the OI-weighted average price for that session
The deviation bands show you how much prices spread out, weighted by OI changes
You can watch how price interacts with these levels to see where significant OI activity happened
Different sessions may show different OIWAP levels, showing you how the OI-price relationship changes throughout the trading day
Note:
This indicator needs Open Interest data to work. If OI data isn't available for your symbol, you'll see a message in the center of your chart. This indicator works only with derivatives markets like futures and options in the Indian Market where OI data is publicly available.
Conclusion
The Session Anchored OIWAP indicator is designed to support structured market observation by combining price, open interest, and session anchoring into a clear visual format. It helps users study market behavior during different parts of the day without generating trading instructions or outcomes.
Disclaimer
This indicator is for educational and visual-analysis purposes only. It does not provide trading signals , financial advice, or guaranteed outcomes . You should perform your own research and consult a licensed financial professional when needed. All trading decisions are solely the responsibility of the user.
Happy Trading

Open Interest Weighted Average Price [Arjo]Open Interest Weighted Average Price , or OIWAP , is a simple visual indicator that shows the average price of an asset based on changes in open interest .
Instead of using trading volume like VWAP, this indicator gives more weight to prices where new futures contracts are being added or removed . This helps highlight the price levels where traders are actively building or closing positions.
The indicator shows:
A main line that represents the average price weighted by open interest changes.
Upper and lower bands (standard deviation bands) that show how far the price moves away from this average.
OIWAP is mainly useful for NSE futures markets , where open interest data is available. It helps traders visually understand where most market participation and positioning are taking place relative to price .
Concepts:
Applies statistical concepts, including weighted averaging and standard deviation, to open interest data
Uses the absolute change in open interest as a weighting factor for each price point
Creates a dynamic average that reflects where significant open interest activity has occurred during a given period
Standard deviation bands are computed from this weighted average to show the statistical spread of prices around the OIWAP line
Resets calculations based on user-selected time periods (daily, weekly, monthly, or session-based)
Allows for fresh analysis at regular intervals
Similar concept to volume-weighted average price (VWAP) indicators, but uses open interest changes as the weighting component
Features:
Weighted Average: Calculates a central line based on contract activity.
Flexible Anchors: Allows users to choose the reset period for the calculation.
Volatility Bands: Displays outer and mid-bands to visualize price stretches.
Data Check: Built-in alerts notify you if Open Interest data is missing for a symbol.
Visual Zones: Color-coded areas help identify price location at a glance.
How To Use
When you add the indicator to your chart, you will see:
A main OIWAP line — the open-interest-weighted price level
Mid-bands around the line (±0.5 standard deviations)
Outer bands farther away (±2.0 standard deviations)
Shaded background zones between these lines
You can:
Change the reset period to see how the average behaves over different time ranges
Adjust the timeframe for open-interest data
Turn mid-bands on or off
Adjust colors and styles to improve readability
Conclusion
The OIWAP indicator serves as an educational tool for visualizing the relationship between price movements and open interest activity in futures markets
Presents a weighted average price line along with statistical deviation bands
Offers a structured framework for chart analysis
Customizable settings allow users to adapt the display to their analytical preferences
Maintains focus on visual interpretation rather than directional predictions
Functions as a supplementary charting overlay that may complement other forms of technical and fundamental analysis
Disclaimer
This indicator is for educational and visual-analysis purposes only. It does not provide trading signals, financial advice, or guaranteed outcomes . You should perform your own research and consult a licensed financial professional when needed. All trading decisions are solely the responsibility of the user.

F&O Time Zones – Final Fixed📌 This indicator highlights high-probability intraday time zones used in Indian F&O (Futures & Options) strategies. Ideal for scalping, breakout setups, and trap avoidance.
🕒 Covered Time Zones:
• 9:15 – 9:21 AM → Flash Trades (first 1-minute volatility)
• 9:21 – 9:30 AM → Smart Money Trap (VWAP fakeouts)
• 9:30 – 9:50 AM → Fake Breakout Zone
• 9:50 – 10:15 AM → Institutional Entry Timing
• 10:15 – 10:45 AM → VWAP Range Scalps
• 10:45 – 11:15 AM → Second Trap Zone
• 11:15 – 1:00 PM → Trend Continuation Window
• 1:00 – 1:45 PM → Volatility Compression
• 1:45 – 2:15 PM → Institutional Exit Phase 1
• 2:15 – 2:45 PM → Trend Acceleration / Reversals
• 2:45 – 3:15 PM → Expiry Scalping Zone
• 3:15 – 3:30 PM → Dead Zone (square-off time)
🔧 Features:
✓ Clean vertical lines per zone
✓ Optional label positions (top or bottom)
✓ Adjustable line style, width, and color
🧠 Best used on: NIFTY, BANKNIFTY, FINNIFTY (5-min or lower)
---
🔒 **Disclaimer**:
This script is for **educational purposes only**. It is not financial advice. Trading involves risk. Please consult a professional or do your own research before taking any positions.
—
👤 Script by: **JoanJagan**
🛠️ Built in Pine Script v5

ATR Trailing Stop by GideonMATR Trailing Stop Indicator
This ATR Trailing Stop Indicator is designed for traders who wish to enhance their exit strategies by leveraging volatility-based stops. It offers a systematic approach to trend management and risk control, enabling traders to capture extended trends while protecting their capital during market reversals. Works on Indian Indices as well.
Overview:
The ATR Trailing Stop indicator is a dynamic trend-following tool that adjusts stop levels based on market volatility. By incorporating the Average True Range (ATR), the indicator provides a flexible exit strategy that adapts to changing market conditions, helping traders lock in profits during trends and limit losses during reversals.
How It Works:
True Range and ATR Calculation:
The indicator first calculates the True Range (TR) for each bar, defined as the maximum of:
The difference between the high and low,
The absolute difference between the high and the previous close, and
The absolute difference between the low and the previous close.
Using the TR values, the ATR is computed over a user-defined period (default is 14 bars) with an option to use either a Simple Moving Average (SMA) or an Exponential Moving Average (EMA) as the smoothing method.
Trailing Stop Determination:
Two potential stop levels are calculated:
For an uptrend, the stop is determined as:
Stop = Close – (Multiplier × ATR)
For a downtrend, the stop is:
Stop = Close + (Multiplier × ATR)
The indicator maintains a persistent trailing stop that dynamically adjusts:
In an uptrend, the trailing stop only moves upward (or remains flat) to secure gains.
In a downtrend, it only moves downward, thereby protecting the position from excessive losses.
A reversal in trend is identified when the price crosses the trailing stop level, at which point the indicator flips the trend and resets the stop level accordingly.
Rationale:
Utilizing the ATR for trailing stops ensures that the stop levels are directly influenced by market volatility. This dynamic adjustment helps accommodate the natural price fluctuations of the market, providing a more adaptive risk management tool compared to fixed stop-loss levels. The approach is particularly useful in volatile markets where traditional static stops might be triggered prematurely.
Customization:
Key parameters that can be adjusted include:
ATR Period: The number of bars used to calculate the ATR.
ATR Multiplier: The factor that determines how far the trailing stop is set from the current price.
Smoothing Method: Option to choose between SMA and EMA for ATR calculation, allowing traders to tailor the sensitivity of the indicator to their specific trading style.

Trend & ADX by Gideon for Indian MarketsThis indicator is designed to help traders **identify strong trends** using the **Kalman Filter** and **ADX** (Average Directional Index). It provides **Buy/Sell signals** based on trend direction and ADX strength. I wanted to create something for Indian markets since there are not much available.
In a nut-shell:
✅ **Buy when the Kalman Filter turns green, and ADX is strong.
❌ **Sell when the Kalman Filter turns red, and ADX is strong.
📌 **Ignore signals if ADX is weak (below threshold).
📊 Use on 5-minute timeframes for intraday trading.
------------------------------------------------------------------------
1. Understanding the Indicator Components**
- **Green Line:** Indicates an **uptrend**.
- **Red Line:** Indicates a **downtrend**.
- The **line color change** signals a potential **trend reversal**.
**ADX Strength Filter**
- The **ADX (orange line)** measures trend strength.
- The **blue horizontal line** marks the **ADX threshold** (default: 20).
- A **Buy/Sell signal is only valid if ADX is above the threshold**, ensuring a strong trend.
**Buy & Sell Signals**
- **Buy Signal (Green Up Arrow)**
- Appears **one candle before** the Kalman line turns green.
- ADX must be **above the threshold** (default: 20).
- Suggests entering a **long position**.
- **Sell Signal (Red Down Arrow)**
- Appears **one candle before** the Kalman line turns red.
- ADX must be **above the threshold** (default: 20).
- Suggests entering a **short position**.
2. Best Settings for 5-Minute Timeframe**
For day trading on the **5-minute chart**, the following settings work best:
- **Kalman Filter Length:** `50`
- **Process Noise (Q):** `0.1`
- **Measurement Noise (R):** `0.01`
- **ADX Length:** `14`
- **ADX Threshold:** `20`
- **(Increase to 25-30 for more reliable signals in volatile markets)**
3. How to Trade with This Indicator**
**Entry Rules**
✅ **Buy Entry**
- Wait for a **green arrow (Buy Signal).
- Kalman Line must **turn green**.
- ADX must be **above the threshold** (strong trend confirmed).
- Enter a **long position** on the next candle.
❌ **Sell Entry**
- Wait for a **red arrow (Sell Signal).
- Kalman Line must **turn red**.
- ADX must be **above the threshold** (strong trend confirmed).
- Enter a **short position** on the next candle.
**Exit & Risk Management**
📌 **Stop Loss**:
- Place stop-loss **below the previous swing low** (for buys) or **above the previous swing high** (for sells).
📌 **Take Profit:
- Use a **Risk:Reward Ratio of 1:2 or 1:3.
- Exit when the **Kalman Filter color changes** (opposite trend signal).
📌 **Avoid Weak Trends**:
- **No trades when ADX is below the threshold** (low trend strength).
4. Additional Tips
- Works best on **liquid assets** like **Bank Nifty, Nifty 50, and large-cap stocks**.
- **Avoid ranging markets** with low ADX values (<20).
- Use alongside **volume analysis and support/resistance levels** for confirmation.
- Experiment with **ADX Threshold (increase for stronger signals, decrease for more trades).**
Best of Luck traders ! 🚀

Options Cumulative Chart AnalysysThis Pine Script is a comprehensive tool designed for traders analyzing options data on TradingView. It aggregates multiple symbols to calculate and visualize cumulative performance, providing essential insights for decision-making.
Key Features:
Symbol and Strike Price Configuration:
Supports up to four configurable symbols (e.g., NIFTY options).
Allows defining buy/sell actions, quantities, and entry premiums for each symbol.
Customizable Chart Display:
Plot candlesticks and line charts for cumulative data.
Configurable Exponential Moving Averages (EMAs) for technical analysis.
Entry and price lines with customizable colors.
Timeframe Management:
Supports higher timeframe (HTF) candles.
Ensures compatibility with the current chart timeframe to maintain accuracy.
Dynamic Coloring and Visualization:
Red, green, and gray color schemes for body and wicks of candlesticks based on price movements.
Customizable positive and negative color schemes.
Table for Data Representation:
Displays an info table showing symbols, quantities, entry prices, and latest traded prices (LTP).
Adjustable table position, overlay, and styling.
Premium and Profit/Loss Calculations:
Calculates cumulative open, high, low, and close prices considering premiums and quantities.
Tracks the profit and loss dynamically based on cumulative premiums and market prices.
Alerts and Notifications:
Alerts triggered on specific conditions, such as when the profit/loss turns negative.
Modular Functions:
Functions for calculating high/low/open/close values, combining premiums, and drawing candlesticks.
Utilities for symbol management and security requests.
Custom Settings:
Includes a wide range of input options for customization:
Timeframes, EMA lengths, colors, table configurations, and more.
Error Handling:
Validates timeframe inputs to ensure compatibility and prevent runtime errors.
This script is designed for advanced traders looking for a customizable tool to analyze cumulative options data efficiently. By leveraging its modular design and visual elements, users can make informed trading decisions with a holistic view of market movements.
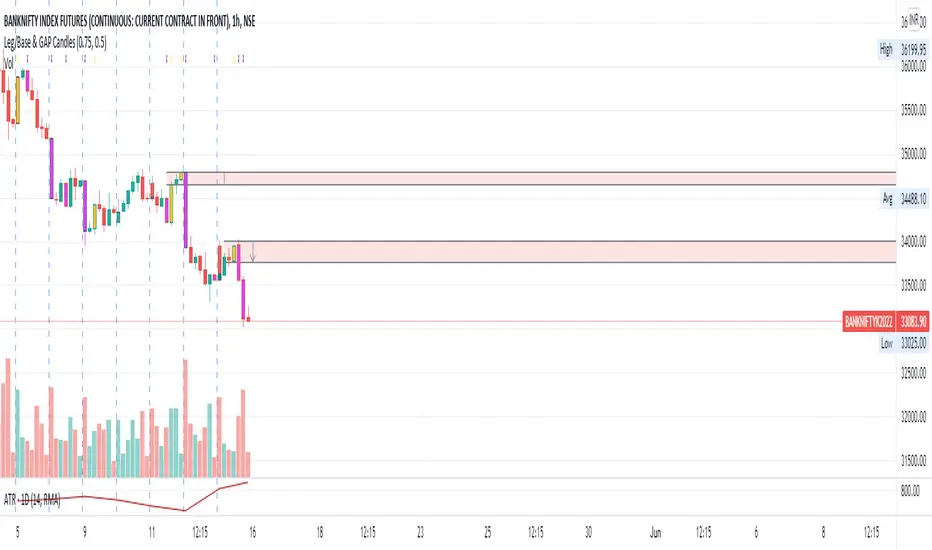
Leg/Base & GAP CandlesThis script, redraws the Minute, Hourly, Daily, Weekly, Monthly candles for gap up and gap down situation. Also this candle marks the LEG candles and BASE Candles with different colors to mark the supply and demand zone.
This script is only for Indian NSE markets (09:15 to 15:30) for GAP up/GAP down redraw.
This script is most beneficial for TradeLegend students.
This script is originally made by me, and no code has been modified or copied from anywhere else except Pinescript documentation.
Future TimevalueThis indicator plots a chart of future timevalue for all NSE index and NSE FNO Stock. It plots the difference of future and spot's 1min candle close price.
Just open any index or stock spot chart in 1 min timeframe(works with higher tf also) and add the indicator.

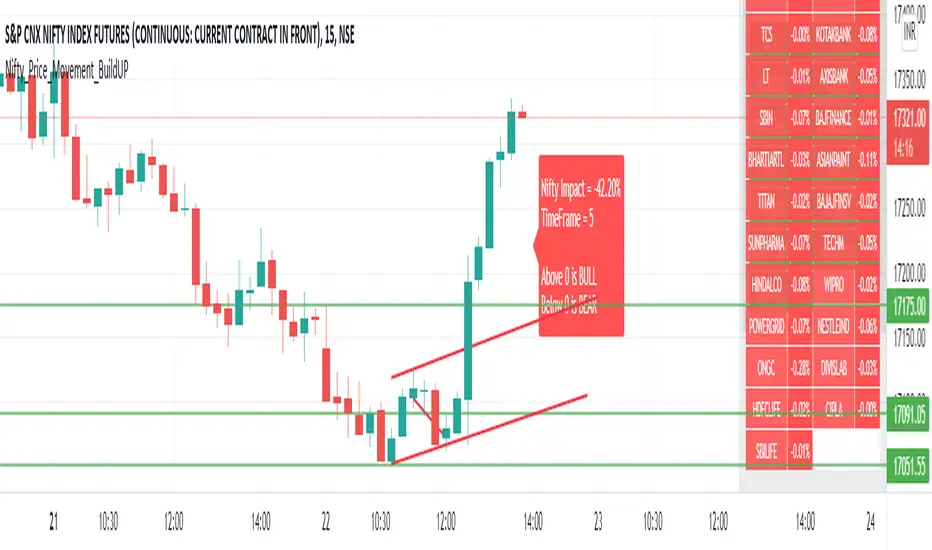
Nifty_Price_Movement_BuildUPDashboard to see Price Momentum Build-Up at Nifty.
It cumulates all prices and their respective weightage.
During initial of a candle, we are not aware of volume is High or Not, we only get it in later buildup. But Price buildup will display it at the same instant that what is going with the price of all stocks.
The logic used here is that
1) If a stock close > open at a particular instant it will add that stock multiplied with its weightage in Nifty to the list of stocks that are positive.
2) If a stock close < open at a particular instant it will add that stock multiplied with its weightage in Nifty to the list of stocks that are negative.
3) Above two will give you data that how many of them are positive and are negative at a particular instant and how they are going to affect Nifty.
In one of the many possible ways, it is superior than that of Volume buildup is that, to determine volume is higher than previous volume, we have to wait for first few seconds/minutes/hours (depending on timeframe you are in) to see volume buildup. The Volume buildup function based indicator is kind of lagging, though volume itself being instant.
ChartAdvise_Action_ReactionThis script has finetuned the dynamic shifting of prices seen in the previous script.
