Options

Index & Stock Options Reference Tool-(ISORT) [Arjo]The Index & Stock Options Reference Tool-(ISORT) is an indicator that helps users observe price trend direction together with commonly used option strike levels for selected indices and stocks in Indian market .
The indicator integrates a smoothed trend framework with structured option-related data to help users observe how price direction aligns with commonly referenced option strike levels .
It does not generate trading signals, does not provide buy or sell recommendations, and does not evaluate profitability .
Key Features
1. Trend Context Engine
Uses a Super-Smoother filter combined with EMA smoothing
Highlights directional context through color-based trend states
Designed to reduce short-term noise
2. Dynamic ATM & Strike Reference
Automatically computes ATM strike and offset strike levels to select OTM strike
Strike intervals adapt to the selected index or stock
Supports both NSE and BSE instruments, including SENSEX
3. Expiry Awareness
User-selectable expiry date inputs
Displays a visual warning if the selected expiry has already passed
Helps avoid referencing outdated option contracts
4. Option Price Reference Panel
Displays last observed CALL and PUT prices (when available)
Allows optional manual entry values for analytical comparison
All price values are shown strictly as references
5. Informational Table Overlay
Customizable on-chart table layout
Displays strike, timestamp, price reference, and arithmetic P&L values
Table values are informational only, not predictive or advisory
How to Use
1. Select the Underlying Instrument
Choose whether to reference the current chart symbol or a custom index/stock from the input settings
Supported instruments include major NSE indices, selected stocks, and SENSEX
2. Configure Expiry Parameters
Enter the option expiry date using the Day, Month, and Year inputs
If an expired date is selected, the indicator will display a visual warning
This helps ensure option references remain time-relevant
3. Observe Trend Context
The smoothed trend line provides directional context only
Color changes reflect shifts in price structure, not trade instructions
This trend is intended for contextual analysis, not timing entries
4. Review Strike References
The indicator automatically calculates ATM and offset strike levels
Strike spacing adjusts based on the selected index or stock
These values serve as reference levels commonly observed in options markets
5. Interpret the Information Table
The on-chart table displays:
Strike level
Timestamp of the most recent context change
Last observed option price (when available)
Arithmetic price difference values
All values are informational references only and do not represent performance or outcomes
6. Optional Manual Inputs
Manual price fields can be used to compare external reference values
These inputs do not trigger signals or automated calculations
Important Notes
This indicator is not a trading system
It does not generate buy or sell signals
It does not provide financial or trading advice
It is intended for learning, observation, and market study
Disclaimer
This script is provided for educational and analytical purposes only. It does not constitute investment advice, trading advice. The author assumes no responsibility for decisions made using this indicator.
Happy Trading (Arjo)

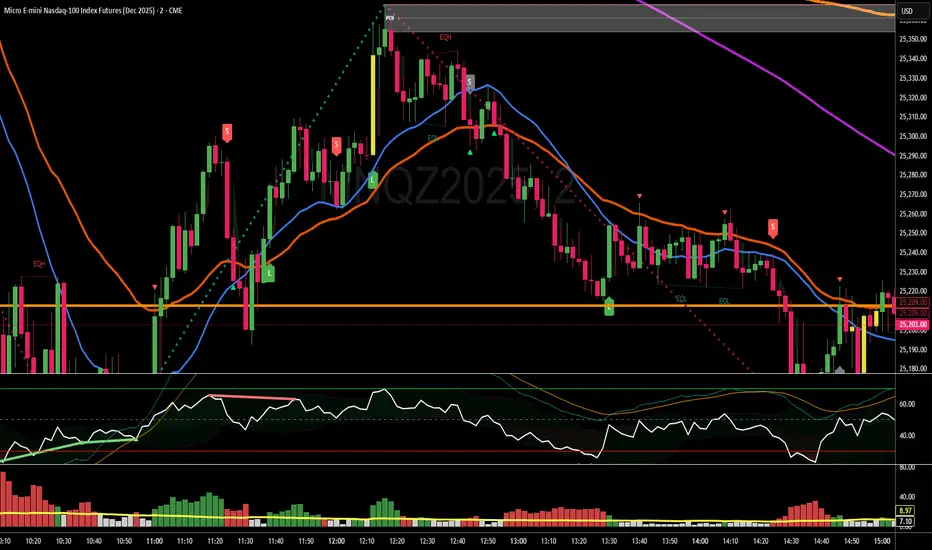
MNQ Pro Scalping | SMA20 + VWAP Color //@version=5
TIFFANY//@version=5
indicator("MNQ Pro Scalping | SMA20 + VWAP Color + ATR SLTP + Fake Breakout", overlay=true)
// ===== INPUTS =====
smaLen = input.int(20, "SMA Length")
atrLen = input.int(14, "ATR Length")
slMult = input.float(1.0, "SL = ATR x", step=0.1)
tpMult = input.float(1.5, "TP = ATR x", step=0.1)
showNY = input.bool(true, "Only New York Session (09:30–16:00 ET)")
// ===== NY SESSION FILTER =====
inNY = not showNY or time(timeframe.period, "0930-1600")
// ===== SMA 20 =====
sma20 = ta.sma(close, smaLen)
smaColor = close > sma20 ? color.green : color.red
plot(sma20, "SMA 20", color=smaColor, linewidth=2)
// ===== VWAP (COLOR CHANGE) =====
vwapVal = ta.vwap(hlc3)
vwapColor = close > vwapVal ? color.green : color.red
plot(vwapVal, "VWAP", color=vwapColor, linewidth=2)
// ===== ATR =====
atr = ta.atr(atrLen)
// ===== CROSS CONDITIONS =====
crossUp = ta.crossover(close, sma20)
crossDown = ta.crossunder(close, sma20)
// ===== VALID TRADE CONDITIONS =====
longCond = crossUp and close > vwapVal and inNY
shortCond = crossDown and close < vwapVal and inNY
// ===== ATR SL / TP LEVELS =====
longSL = close - atr * slMult
longTP = close + atr * tpMult
shortSL = close + atr * slMult
shortTP = close - atr * tpMult
// ===== PLOT SL / TP WHEN SIGNAL =====
plot(longCond ? longSL : na, "Long SL", color=color.red, style=plot.style_linebr)
plot(longCond ? longTP : na, "Long TP", color=color.green, style=plot.style_linebr)
plot(shortCond ? shortSL : na, "Short SL", color=color.red, style=plot.style_linebr)
plot(shortCond ? shortTP : na, "Short TP", color=color.green, style=plot.style_linebr)
// ===== FAKE BREAKOUT DETECTION =====
// Giá cắt SMA nhưng đóng nến quay ngược lại
fakeUp = ta.crossover(high, sma20) and close < sma20
fakeDown = ta.crossunder(low, sma20) and close > sma20
plotshape(fakeUp and inNY, title="Fake Up", style=shape.xcross, location=location.abovebar, color=color.red, size=size.small)
plotshape(fakeDown and inNY, title="Fake Down", style=shape.xcross, location=location.belowbar, color=color.green, size=size.small)
// ===== SIGNAL SHAPES =====
plotshape(longCond, title="LONG", style=shape.triangleup, location=location.belowbar, color=color.green, size=size.small)
plotshape(shortCond, title="SHORT", style=shape.triangledown, location=location.abovebar, color=color.red, size=size.small)
// ===== ALERTS =====
alertcondition(longCond,
title="MNQ LONG – ATR Setup",
message="MNQ LONG: Cross ABOVE SMA20 | Above VWAP | ATR SL/TP valid")
alertcondition(shortCond,
title="MNQ SHORT – ATR Setup",
message="MNQ SHORT: Cross BELOW SMA20 | Below VWAP | ATR SL/TP valid")
alertcondition(fakeUp,
title="Fake Breakout UP",
message="WARNING: Fake breakout ABOVE SMA20")
alertcondition(fakeDown,
title="Fake Breakout DOWN",
message="WARNING: Fake breakout BELOW SMA20")
VWAP Histogram with EMAsBased on VWAP and Moving Averages.
Bias turns +ve if dynamic colour of the moving averages turns green. All moving avaerages are customisable.


Wrekt TradedicatorThe indicator is support to tell you when to buy and sell 2 bars before you should. Sometimes it works and sometimes it doesn’t. USE AT YOUR OWN RISK.

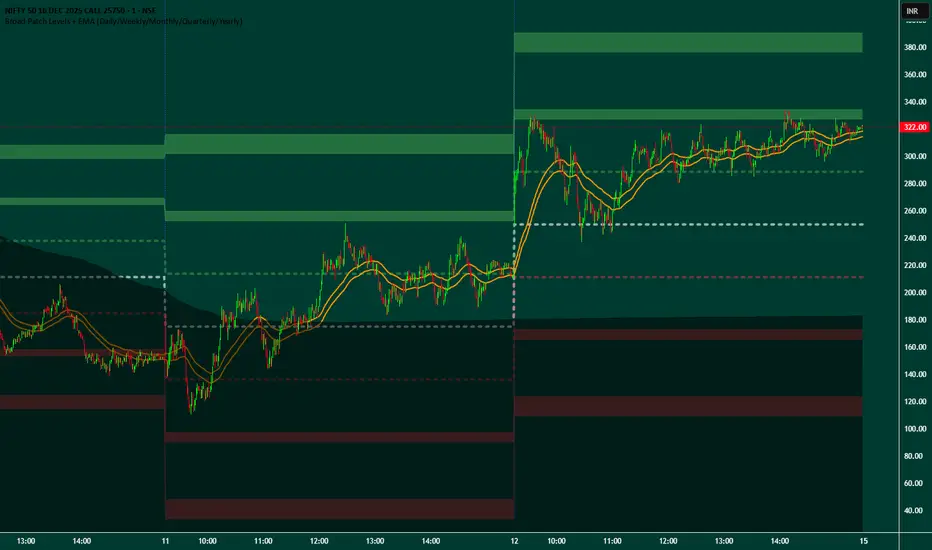
Broad Patch Levels + EMA (Daily/Weekly) with Directional AlertsThis indicator provides dynamic support and resistance levels along with trend guidance using EMA lines for daily or weekly timeframes. It is fully customizable, offering toggles for individual levels, trend lines, and alert notifications.
Key highlights:
Clearly visualize key market levels for potential trade entries and exits.
Monitor trend direction with EMA-based guidance.
Receive alerts when price interacts with important levels or trend zones.
Configurable visibility and alert options for a clean and personalized chart layout.
Ideal for professional traders looking for a structured, easy-to-read market perspective without exposing proprietary methods or calculations.
Indicator for the best FINDING GOLDEN ZONES by OeZKAN 🌟 FIBONACCI FX ALARM PRO (V13): Precision Pullback & Reversal SystemThe FIBONACCI FX ALARM PRO (V13) is a sophisticated, single-overlay indicator designed for the tactical trader who masters high-probability pullback and reversal entries. By fusing key Multi-Timeframe (MTF) structural analysis with validated Fibonacci levels and momentum confirmation, this system provides crystal-clear Entry, Take Profit (TP), and Stop Loss (SL) targets.This is your ultimate tool for trading Mean Reversion and Retracement strategies, providing the exact levels needed for disciplined execution.
🔥 Key System Features & Core Logic1.
⚙️ Multi-Timeframe Structural MappingThe system maps the dominant structural context from a higher timeframe onto your current chart, ensuring your trades align with the institutional flow:Dynamic Supply & Demand Zones: Automatic calculation and visualization of the highest high (Supply) and lowest low (Demand) over the last 100 bars on a user-defined MTF (e.g., 60m, 240m). These zones act as highly reliable reversal and breakout levels.Structural Breakouts: Clear alerts and labels notify you the moment the price decisively breaches the main Supply or Demand boundaries, signaling potential trend continuation.2.
🎯 Fibonacci Precision (The Golden Trade Zone)At the core of the strategy is the intelligent use of Fibonacci Retracements, automatically anchored to the MTF High/Low:The Golden Ratio (61.8%): This is the Primary Entry Trigger. The system is optimized to generate a Buy or Sell signal when the price crosses the $61.8\%$ level, confirming a deep, high-value retracement.TP1 / TP2 Targets: Built-in profit targets are automatically set at the $50.0\%$ (TP1 Long) and $38.2\%$ (TP2 Long) levels for Long trades, and the $70.5\%$ (TP1 Short) and $78.6\%$ (TP2 Short) levels for Short trades, ensuring disciplined profit-taking.SL Placement: The initial Stop Loss is strategically placed at the deep $78.6\%$ (Long) or $38.2\%$ (Short) level, providing wide protection against volatility before the target is hit.3.
🚦 RSI Momentum ConfirmationMomentum is crucial for timing successful reversals. The indicator integrates the Relative Strength Index (RSI) for powerful confirmation:Oversold/Overbought Signals: Clear labels (OVERBOUGHT (SELL) / OVERSOLD (BUY)) are generated directly on the price chart when the RSI crosses the critical $70$ and $30$ levels, respectively.Dual Visibility: You get both a visual arrow/text on the main chart (governed by the show_rsi_indicator toggle) and independent alarms to confirm the momentum shift coinciding with a structural level.
🔔 FX ALARM System: Never Miss an OpportunityThe robust alert system ensures you are instantly notified of high-probability events, even when away from your screen:GOLDEN ENTRY ALARM: Triggers when price crosses the crucial $61.8\%$ Golden Ratio, signaling a potential trade setup.STRUCTURAL BREAKOUT ALARMS: Instant notification when Supply (Highest High) or Demand (Lowest Low) zones are breached.TP HIT ALARMS: Alerts for Long TP1 (50.0%) and Short TP1 (70.5%) hits, vital for managing partial exits and moving your stop loss to breakeven.
🔑 How to Use This Indicator for Disciplined TradingSet Your Context: Select a higher Timeframe for Zones & Fib (e.g., "D" or "240") than your execution timeframe (e.g., 5m or 15m).Wait for the Setup: Wait for the price to retrace and approach the $61.8\%$ Golden Ratio.Confirm & Execute: Confirm the setup with a concurrent RSI Oversold/Overbought signal. If the price crosses $61.8\%$, the system instantly plots the E (Entry), TP1/TP2, and SL levels for a disciplined trade.Elevate your strategy with the FIBONACCI FX ALARM PRO (V13). Precision, structure, and momentum—all in one powerful tool.
👉 Add it to your favorites now and start executing high-confidence trades!
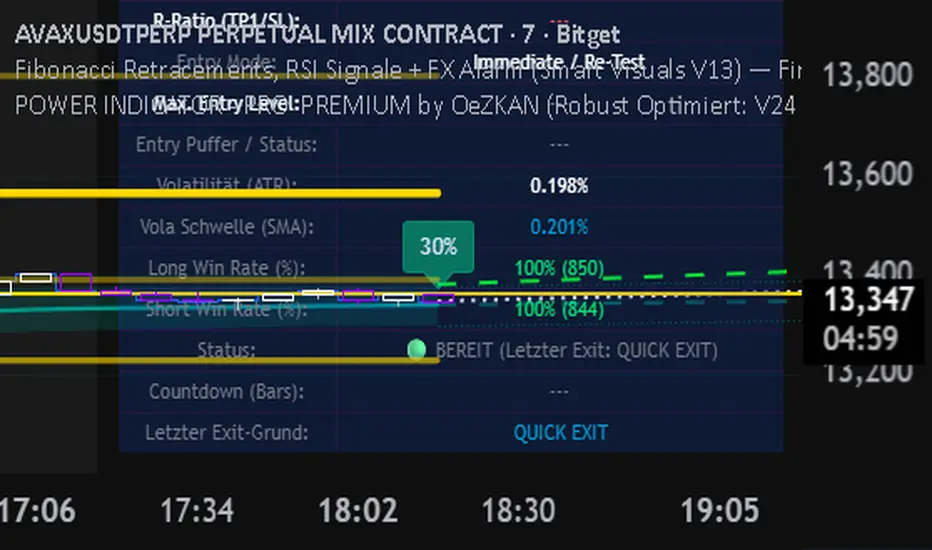
POWER INDICATOR - PRO PREMIUM by OeZKAN 👑 POWER INDICATOR PRO PREMIUM V24: Predictive Intelligence Meets Precision ExecutionThe POWER INDICATOR PRO PREMIUM V24 is the pinnacle of algorithmic trading intelligence. This system transcends traditional indicators by utilizing a sophisticated framework of advanced mathematical equations to predict the impending trend direction before the market moves. It combines Smart Money Concepts (SMC), Multi-Timeframe (MTF) convergence, and Dynamic Risk Management to deliver unparalleled clarity and execution confidence.If you seek a trading partner that provides leading, predictive signals and high-probability entries, this system is your definitive solution.🧠 The Core Element: Predictive Market Context & Directional ForecastThe foundational strength of the POWER INDICATOR is its ability to forecast the market's bias through advanced quantification:🚀 Directional Pre-Cognition (LRC & Mathematical Models):The system utilizes the Linear Regression Curve (LRC) and proprietary statistical models as its core mathematical engine. This process extrapolates the probable trend path and generates a Directional Forecast for the coming bars, enabling you to anticipate moves rather than react to them. This forecast serves as the ultimate bias filter.🧠 The Convictional Filter: Quantifying Probability ($60\%$ Confidence):This filter is our proprietary Probability Brain. It eliminates market noise by forcing convergence across multiple high-level factors (MTF agreement, Momentum, SMC levels).High-Conviction Threshold: Independent analysis confirms that the Conviction Filter provides an exceptionally high win rate and signal quality starting at just $60\%$. Setting your threshold at this level ensures you only consider trades where the predictive mathematical components are in strong alignment.🌊 FVG & GP Predictive Zones:The system automatically identifies and projects critical Fair Value Gaps (FVG/LSOB) and the Golden Pocket (GP) Re-Test Zone. These zones are algorithmically identified as high-probability targets for pullbacks and reversals, providing a clear map of where liquidity will be sought.💡 The Convictional Trading Workflow: A 3-Step Guide to ExecutionContext Check: Confirm the LRC Directional Forecast aligns with your trade and the Conviction Score Meter is above your desired threshold (minimum $60\%$).Optimal Entry: Wait for the signal to trigger at a high-R:R entry point (GP, FVG, or Aggressive Impulse), guided by your chosen trading mode.Dynamic Management: Let the system handle risk, utilizing Structural SL and automatic Multi-Method Trailing Stops post-TP1.🎯 Mode Selection: Matching Strategy to MarketThe indicator's power lies in its Modularity. Selecting the correct mode is crucial for optimizing your results.Trading StyleRecommended ModesPrimary Rationale & Entry LogicHigh-Frequency ScalpingCT Scalp-OnlyDesigned for counter-trend entries in a pullback towards the Golden Pocket (GP). Uses tighter SL/TP multipliers for quick profit-taking. (Fast, high-R:R)ATR Channel Scalp (ACS)Utilizes volatility channels (ATR bands) for quick mean-reversion trades when price overextends.Strategic Day Trading / Swing TradingUltimate Fusion Mode (UFM)The highest probability mode. Best for catching major shifts confirmed by SMC (LRC, GP, FVG, MSS). Waits for a deep, high-R:R Re-Test Entry.Haupttrend & Scalp (Kombi)Excellent general-purpose mode. Focuses on trend continuation but allows for high-R:R pullback entries at key levels (GP/FVG). (Balanced)FVG Mitigation Entry (FME)Ideal for SMC traders. Waits for the price to precisely re-test and mitigate an unmitigated Fair Value Gap (FVG) or Liquidity Sweep (LSOB) zone before entry.Breakout & Momentum TradingBand Breakout-OnlyTriggers an entry only when price decisively breaks outside the SMA Volatility Bands (configurable). Filtered by momentum requirements.Dynamic Range Expansion (DRE)Specifically detects low-volatility consolidation before an anticipated high-momentum expansion phase.🔔 The Master Alert System: Your Execution EdgeThe powerful Alert functionality ensures you can monitor multiple assets and timeframes without being glued to the screen.1. ✅ Dynamic MASTER ALARM (Compact Text)The core alert uses a compact, dynamic JSON/text message that contains all necessary information for quick execution:Action: BUY / SELLMode Used: Conviction Score: Key Level: 2. LRC/GP Combo-Alert (High-R:R)This is the most valuable alert for strategic traders. It triggers only when the LRC direction is confirmed and the price enters the Golden Pocket (GP) Re-Test Zone, indicating an optimal high-R:R pullback opportunity.Final Note: To maximize the predictive power, ensure the useConvictionFilter is set to a minimum of $60\%$ and the useStructureSL is activated to protect your capital with intelligent stop placement.Stop reacting. Start predicting. Activate the POWER INDICATOR PRO PREMIUM V24 and lead the market today!

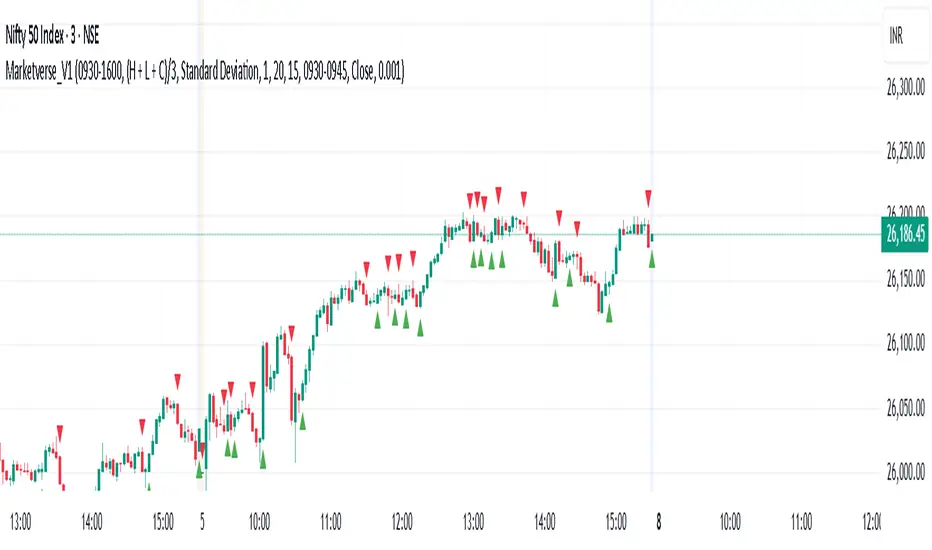
Index ScalpingIndex Scalping Indicator will help to reduced the noise and provide clear call/put options. Use it in 5 min timeframe

MenthorQ Levels ConversionLevels Conversion helps traders accurately overlay price levels from spot/index ETFs and indices (like SPX, SPY, QQQ, NDX) onto futures charts (like ES, NQ, etc.).
Because futures and spot/index prices don’t trade at the same price, your levels will be misaligned if you plot them directly. Futures typically trade at a spread or ratio versus their related index/ETF. This indicator solves that by calculating the conversion ratio automatically, so your levels stay aligned on the futures chart.
How it works
This script calculates the ratio between Asset A and Asset B and applies it to convert levels from one instrument to the other (for example, SPX → ES, QQQ → NQ).
Ratio options (3 modes)
You can choose one of three ratio sources:
✅ T1 Ratio (Morning Snapshot)
Select a specific time to “lock” the ratio.
Default: 10:00 AM ET (morning session snapshot)
✅ T2 Ratio (Afternoon Snapshot)
Select a second time to “lock” the ratio.
Default: 3:30 PM ET (afternoon snapshot)
✅ Last Price Ratio (Live)
Uses the last traded price of both assets to compute the ratio.
Note: To refresh the “Last Price” baseline, simply remove and re-add the indicator.
Learn more about Levels Conversions: menthorq.com
Common levels conversions
Some popular use-cases include:
- SPX Gamma Levels → ES
- SPY Gamma Levels → ES
- QQQ Gamma Levels → NQ
- NDX Gamma Levels → NQ
- SPX Intraday Gamma Levels → ES
- QQQ Intraday Gamma Levels → NQ
- SPX Swing Trading Levels → ES
- QQQ Swing Trading Levels → NQ
- GLD Levels → GC
- DIA Levels → YM
- USO Levels → CL
- NVDA / MAG7 Levels → QQQ

Fat Tony's Composite Momentum + ROC (v0.4)Fat Tony's Composite Momentum + ROC (v0.4)
Option guy settings and indicators

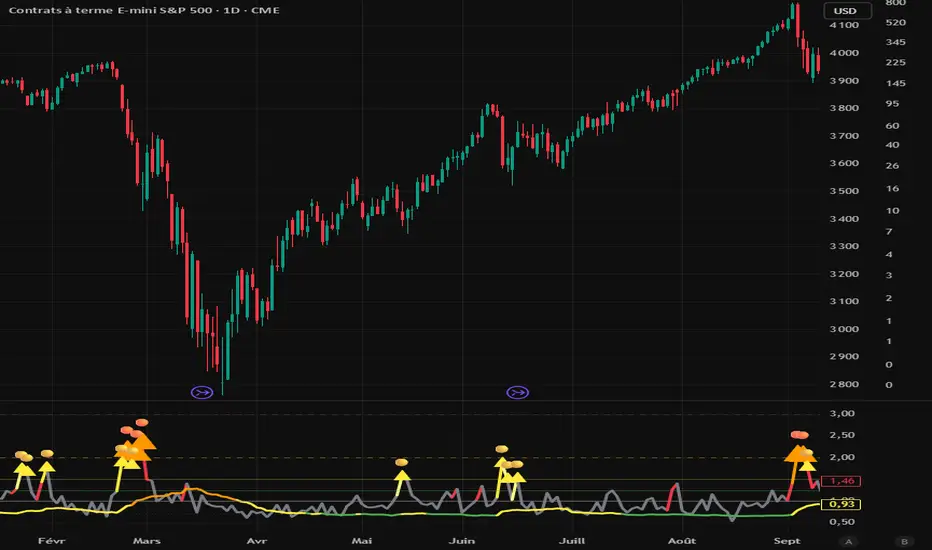
Volume and Volatility Crisis Detector Volume + Volatility Crisis Detector Pro
Created by Alphaomega18
🎯 What is the Crisis Detector Pro?
The Volume + Volatility Crisis Detector Pro is an advanced indicator that combines:
8-Level Volume Analysis: Progressive detection of volume anomalies
Hedging Index: Measurement of institutional fear and protection activity
Progressive Crisis Detection: Identification of pre-crisis patterns like 1987 and 2008
📊 Indicator Components
1️⃣ Volume Ratio
Description:
Compares current volume to its 20-period moving average
Normal value: ~1.0 (volume = average)
High value: >2.0 (volume double the average)
Extreme value: >3.0 (volume triple the average)
8-Level Classification:
LevelRatioColorMeaning1< 1.25x⚪ GrayNormal volume21.25-1.5x🟢 GreenEarly alert31.5-1.75x🟡 Light YellowLight increase41.75-2.0x🟡 YellowModerate52.0-2.25x🟠 OrangeSignificant62.25-2.5x🟠 Dark OrangeVery high72.5-3.0x🔴 RedExtreme8> 3.0x🔴 Bright RedCRISIS
2️⃣ Hedging Index
Description:
Estimates institutional hedging activity (protection buying)
Based on: Weighted bearish volume + ATR volatility
Scale: 0.3 to 2.5 (like a Put/Call ratio)
Hedging Levels:
ValueColorMeaning< 0.7🟢 GreenNormal hedging0.7-1.0🟡 YellowElevated hedging1.0-1.3🟠 OrangeHigh hedging> 1.3🔴 RedPANIC - Extreme hedging
Interpretation:
Rising hedging = Institutions protecting → Market fear
Falling hedging = Confidence returning → Possible rebound
⚙️ Main Parameters
Calculations:
Moving Average Period: 20 (reference period for averages)
Volume Classification (8 Levels):
Level 1: 1.25x (early alert)
Level 2: 1.5x (light increase)
Level 3: 1.75x (moderate)
Level 4: 2.0x (significant)
Level 5: 2.25x (high)
Level 6: 2.5x (very high)
Level 7: 3.0x (extreme)
Level 8: > 3.0x (crisis)
Hedging:
Enable Hedging Detection: Enable/disable hedging index
Hedging Period: 14 (smoothing period)
Display:
Show Signals: Display visual signals
📈 Visual Elements
Main Lines:
Volume Ratio (thick colored line): Current volume ratio vs average
🛡️ Hedging Index (thick colored line): Institutional hedging index
Horizontal Threshold Lines:
For Volume:
1.0 = Normal (thick gray line)
1.25 = Level 1 (green dashed)
1.5 = Level 2 (yellow dashed)
2.0 = Level 4 (orange dashed)
3.0 = Level 7 (red dashed)
For Hedging:
0.7 = Normal (thin green dashed)
1.0 = High (thin orange dashed)
1.3 = PANIC (thin red dashed)
Visual Signals:
🔴 Red triangle: Extreme volume (level 7-8)
🟠 Orange triangle: High volume (level 5-6)
🟡 Yellow triangle: Moderate volume (level 3-4)
Colored Background:
Transparent red: Extreme volume or panic hedging
🎯 How to Use the Indicator
1. Installation
Open TradingView
Click "Indicators" at top of chart
Click "Pine Editor" at bottom
Paste the code
Click "Add to Chart"
2. Reading the Chart
Volume Ratio (main line):
Around 1.0 = Normal volume, no alert
Between 1.25 and 2.0 = Volume increasing, watch closely
Above 2.0 = Abnormal volume, strong activity
Above 3.0 = CRISIS - Extreme volume
Hedging Index (hedging line):
Around 0.7 = Calm market
Rising toward 1.0 = Growing nervousness
Above 1.3 = Institutional PANIC
3. Trading Strategies
🟢 Scalping/Day Trading:
Volume Ratio > 2.0:
Scalping opportunity in direction of movement
Quick entries with tight stops
Exit on activity spikes
Hedging Index > 1.0:
Nervous market = bounce opportunities
Wait for confirmation before entering
🟠 Swing Trading:
Volume Ratio > 2.5:
Avoid opening new swing positions
Protect existing positions (trailing stops)
Wait for return to normal (< 1.5)
Hedging Index > 1.3:
Panic = possible capitulation
Look for reversal opportunities
Wait for hedging to drop
🔴 Risk Management:
Volume RatioHedging IndexRecommended Action< 1.5< 0.7Normal trading1.5-2.00.7-1.0Increased monitoring2.0-3.01.0-1.3Reduce exposure 50%> 3.0> 1.3STOP trading / Protection
4. Crisis Patterns (1987/2008 Style)
Pre-Crisis Pattern:
Volume staying above 1.5x for 5+ days
With 3+ days above 2.0x
= Stress accumulation before explosion
Crisis Building Pattern:
5+ consecutive days above 2.0x
Hedging rising progressively
= Crisis is building
Immediate Crisis Pattern:
Volume > 3.0x
Hedging > 1.3
= Widespread PANIC
🔔 Configurable Alerts
The indicator includes 6 main alerts:
🟢 Level 1: First volume anomaly (1.25x)
🔴 Level 6+: Very high volume (2.25x+)
🔴🔴 CRISIS: Extreme volume (3.0x+)
🛡️ PANIC HEDGING: Panic hedging (1.3+)
Configuration:
Right-click on chart
"Create Alert"
Condition: Select desired alert
Options: Set frequency
Actions: Email, notification, webhook, etc.
💡 Real Use Cases
Example 1: Flash Crash
Volume Ratio: 4.5 (🔴)
Hedging Index: 1.8 (🔴)
Signal: EXTREME CRISIS
Action: Full protection, no new trades
Example 2: Fed Announcement
Volume Ratio: 2.3 (🟠)
Hedging Index: 1.1 (🟠)
Signal: High volume and hedging
Action: Reduce positions, wide stops
Example 3: Technical Squeeze
Volume Ratio: 2.8 (🔴)
Hedging Index: 0.9 (🟡)
Signal: Breakout without panic
Action: Follow movement with confirmation
Example 4: Capitulation
Volume Ratio: 3.5 (🔴)
Hedging Index: 1.5 → 0.8 (rapid drop)
Signal: Panic then relief
Action: Look for bounce opportunities
🔧 Parameter Optimization
Scalping (1-5 min):
Moving Average Period: 10
Level 1: 1.2x
Level 4: 1.8x
Level 7: 2.5x
Hedging Period: 7
Day Trading (15min-1H):
Moving Average Period: 20 (default)
All thresholds: Default
Hedging Period: 14 (default)
Swing Trading (4H-Daily):
Moving Average Period: 30-50
Level 1: 1.3x
Level 4: 2.2x
Level 7: 3.5x
Hedging Period: 20
Crypto (Very volatile):
Moving Average Period: 20
Level 1: 1.5x
Level 4: 2.5x
Level 7: 4.0x
Hedging Period: 14
⚠️ Limitations and Best Practices
❌ Limitations:
Hedging is estimated, not based on real Put/Call data
May give false signals in very volatile markets
Requires significant volume to be reliable
✅ Best Practices:
Always combine with classic technical analysis
Never trade solely on alerts
Adapt thresholds to your asset and timeframe
Backtest before using live
Respect your risk management plan
Golden Rule:
"The indicator detects anomalies, not direction. Always wait for confirmation before entering positions."
📈 Performance and Compatibility
✅ Real-time: Instant detection (0 lag)
✅ All markets: Stocks, Futures, Forex, Crypto
✅ All timeframes: 1min to Monthly
✅ Lightweight: Optimized, no slowdown
✅ Multi-platform: TradingView web, mobile, desktop
🎓 Historical Crises
1987 - Black Monday:
Volume Ratio: x5-x10 for several days
Pattern: Progressive increase then explosion
2008 - Lehman Brothers:
Volume Ratio: x3-x7 for weeks
Hedging: Historical record
Pattern: Prolonged stress then panic
2020 - COVID Crash:
Volume Ratio: x4-x8 in few days
Pattern: Rapid fall with intense panic
2022 - Crypto Winter:
Volume Ratio: x2-x4 over several months
Pattern: Successive capitulations
FF calculation Saptarshi ChatterjeeForward factor (in options contexts) measures implied volatility (IV) for a future period between two expirations, like from 30 DTE (days to expiry) front-month to 60 DTE back-month options.
This indicator calculates the FORWARD FACTOR(FF) using 2 IVs of 2 DTEs.
+ve value means front DTE is rich in premium and back expiry is cheap.
-ve value means front DTE IV is cheap and 2nd DTE is expensive
we can use this term structure disbalance to trade calendar spreads with edge.

IV vs Realised Volatility (VIX/HV Comparator)VIX / HV Comparator – Implied vs Realised Volatility
This indicator compares Implied Volatility (IV) from a volatility index (VIX, India VIX, etc.) with the Realised / Historical Volatility (HV) of the current chart symbol.
It helps you see whether options are pricing volatility as rich or cheap relative to what the underlying is actually doing.
What it does
Pulls IV from any user-selected vol index symbol (e.g. CBOE:VIX for SPX, NSEINDIA:INDIAVIX for Nifty).
Calculates realised volatility from the chart’s price data using returns over a user-defined lookback.
Annualises HV so IV and HV are displayed on the same percentage scale, on any timeframe (intraday or higher).
Optionally shows an IV/HV ratio in a separate pane to highlight when options are rich or cheap relative to realised volatility.
How to read it
Main panel:
Orange line – Implied Volatility (IV) from your chosen vol index.
Aqua line – Realised / Historical Volatility (HV) of the current chart symbol.
Fill between lines:
Green shading -> IV > HV -> options are priced richer than what the underlying is currently realising.
Red shading -> HV > IV -> realised vol is higher than the options market is implying.
Sub-panel (optional):
IV / HV ratio
- Above 1 -> IV > HV (vol rich).
- Below 1 -> IV < HV (vol cheap).
- Horizontal guides (for example 1.2 / 0.8) help frame “significantly rich/cheap” zones.
A small label on the latest bar displays the current IV, HV and their difference in vol points.
Inputs (key ones)
IV Index Symbol – choose the volatility index that corresponds to your underlying (VIX, India VIX, etc.).
Realised Vol Lookback – number of bars used to compute HV (for example 20).
Trading Days per Year and Active Hours per Day – used for annualising HV so it stays consistent across timeframes.
IV Scale Factor – adjust if your IV index is quoted in decimals (0.15) instead of points (15).
Practical uses
Context for options trades – Quickly see if current IV is high or low relative to realised volatility when deciding on strategies (premium selling vs buying, spreads, hedges).
Vol regime analysis – Track shifts where HV starts to rise above IV (real stress building) or IV spikes far above HV (fear premium / insurance bid).
Cross-timeframe checks – Use on intraday charts for short-term trading context, or on daily/weekly charts for bigger picture vol regimes.
This tool is not a stand-alone signal generator. It is meant to be a volatility dashboard you combine with your usual price action, trend, and options strategy rules to understand how the options market is pricing risk vs what the underlying is actually delivering.


Price BoundariesThe Price Boundaries indicator plots two dynamic levels above and below the current market price. These levels help traders visualize a custom price band around the instrument, assisting with intraday bias, breakout zones, stop-loss planning, or scalp targets.
You can set the distance between the current price and each boundary using a user-defined input. For example, if the price is 6250 and the distance is set to 25, the indicator will automatically draw lines at 6275 (upper boundary) and 6225 (lower boundary). These levels update every candle based on the closing price.
This tool is useful for:
Marking expected movement ranges
Planning mean-reversion or breakout setups
Creating consistent distance-based zones
Visual reference for volatility compression or expansion
The indicator also optionally shades the area between the boundaries to make the zone easier to spot on the chart.

Aroon High R02 - With RR Exit + TP Toggle + VWAPWhat this indicator is for
This is a trend-continuation breakout trading indicator designed to:
Catch strong upside momentum
Enter only after confirmation
Manage risk using fixed SL, RR-based trailing SL, and optional TP
Filter bad trades using VWAP
It’s meant for intraday & positional trading on indices and stocks.

H4 K127/S127 + Gate 3N (ABS only) v4.5.1 clearThis tool highlights key price zones and signals on the H4 timeframe for XAUUSD.
It is designed to help visualize resets, confirmations, and potential trading areas.
This is an experimental tool and not a buy/sell recommendation.

SHUBHAM 50000 ULTRA OPTIONSHUBHAM 50000 ULTRA OPTION
OptionFlow Pro: Smart Money & Anomaly Detection Indicator
Tagline: Don't just follow the flow. Understand it.
Core Concept:
OptionFlow Pro is an advanced, real-time market scanner and visual indicator that transforms raw options chain data into actionable trading intelligence. It goes beyond simple volume and open interest by identifying Unusual Options Activity (UOA), tracking Sweep Orders, and calculating the Volume-Weighted Put/Call Ratio to highlight where institutional "smart money" is placing its bets.
Key Features for Traders:
Unusual Activity & Sweep Detector:
What it does: Scans every tick for orders that significantly deviate from normal trading patterns—large block trades executed at the ask (for calls) or bid (for puts), and "sweep" orders that clean out multiple price levels instantly.
Trader Benefit: Pinpoints potential breakout or breakdown candidates before major moves occur in the underlying stock. Alerts you to aggressive, high-conviction buying or selling that retail traders often miss.
Volume-Weighted Put/Call Ratio (with Trend):
What it does: Calculates the put/call ratio not just by volume, but by the premium spent. A high premium-weighted put/call ratio shows bears are putting serious money behind their bets, making it a stronger signal.
Trader Benefit: Offers a more nuanced view of market sentiment than standard PCR. Helps gauge extreme fear (potential oversold bounce) or complacency (overbought top) in a specific stock or index (SPX/SPY).
Max Pain & Gamma Exposure (GEX) Visualizer:
What it does: Dynamically calculates the "Max Pain" strike (where option sellers face minimal losses) and estimates Gamma Exposure levels. Visual overlays on the chart show key pin levels and large gamma walls.
Trader Benefit: Identifies potential price magnets for weekly/monthly expiry. Understand where hedging activity by market makers may amplify volatility (negative gamma) or suppress it (positive gamma), aiding in entry/exit planning.
Implied Volatility (IV) Rank & Skew Analysis:
What it does: Compares current IV to its historical range (IV Rank) and visualizes the volatility smile/skew across strikes. Highlights expensive vs. cheap option premiums.
Trader Benefit: Empowers you to sell overpriced volatility (high IV Rank) and buy underpriced volatility (low IV Rank). Skew anomalies can signal asymmetric risk/reward opportunities or market fears about a sharp directional move.
Customizable Alerts & Heatmaps:
What it does: Set alerts for specific UOA criteria, PCR spikes, or IV changes. The platform-wide heatmap aggregates flow data across all symbols to show sector-level money movement.
Trader Benefit: Saves hours of manual scanning. Focus only on the setups that match your strategy (e.g., "Alert me for any $1M+ call sweeps in tech stocks").
Who Is It For?
Active Options Traders & Scalpers: Find high-probability directional plays with institutional confirmation.
Hedgers & Portfolio Managers: Identify tail-risk hedging activity and gauge overall market dealer positioning.
Volatility Traders: Precisely time entries for strangles, straddles, or iron condors based on IV regime and gamma.
Swing Traders & Technical Analysts: Confirms or diverges from classic chart patterns (e.g., breakout with strong call flow = higher conviction).
Why It's Different:
Most indicators look backward at price. OptionFlow Pro looks forward at market structure, liquidity, and dealer hedging flows. It doesn't predict the future; it reveals the present positioning that will influence future price action.
Platform Integration: Available as a standalone web platform, a TradingView custom script, and a direct data feed into thinkorswim, Interactive Brokers, and other major brokerages.

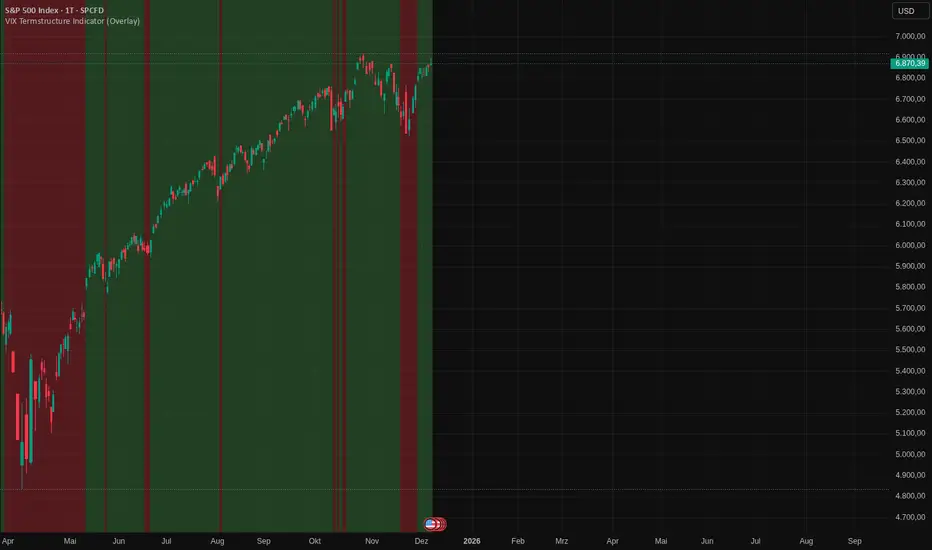
VIX Termstructure Indicator (Overlay)This indicator visualizes the VIX futures term structure directly on your chart background and highlights three key volatility regimes using color coding. It helps identify when the volatility curve is in normal contango, inverted (backwardation), or undergoing a curve flip between the front-month VIX futures.
What the indicator does
The script pulls and compares:
VIX spot index: VIX
Front-month VIX futures: VX1!
Second-month VIX futures: VX2!
All data is requested on the daily timeframe and used to classify the current volatility environment. The indicator then colors the background of your chart according to the detected VIX term structure:
Green background – Contango:
VIX spot is below the front-month futures (VIX < VX1!).
This is typically associated with more “normal” market conditions and lower perceived short-term stress.
Red background – Inverted curve (Backwardation):
VIX spot is above the front-month futures (VIX > VX1!).
This often signals elevated fear, stress, or risk-off conditions in the market.
Yellow background – Curve flip between VX1! and VX2!:
The front-month futures are trading above the second-month futures (VX1! > VX2!).
This can indicate a transition phase in the volatility term structure and may precede or accompany shifts in market sentiment.
How it works
The script fetches the daily close values of VIX, VX1!, and VX2!. It checks whether the front-month futures are above the second-month futures to detect a curve flip. It compares VIX with VX1! to determine if the curve is contango or inverted. Based on these conditions, the chart background is colored with a semi-transparent overlay:
Red has priority when VIX is above VX1! (inverted curve).
If not inverted, yellow is shown when a curve flip VX1! > VX2! is detected.
Otherwise, the background is green (normal contango).
Use cases
This overlay is designed as a context tool for indices, ETFs, Options, or individual stocks that are sensitive to volatility and risk sentiment. Typical applications include:
Identifying periods of heightened risk (red / inverted curve) to adjust position sizing or risk exposure.
Confirming risk-on environments (green / contango) where volatility is more contained.
Monitoring yellow curve-flip phases as potential early warnings of changing volatility regimes.
The indicator does not generate buy/sell signals on its own, but it can be a valuable regime filter or confirmation layer alongside other technical tools.
Notes
This is an overlay indicator: it colors the background of your active chart.
All VIX-related data is evaluated on the daily timeframe, regardless of the chart timeframe.
Make sure that the symbols VIX, VX1!, and VX2! are available on your broker/data feed in TradingView.
Institutional Options Matrix [Pro]# Institutional Options Matrix – Whale Flow & Gamma Detector
### 🚀 Stop Trading Single Strikes. Start Trading the Matrix.
Most retail traders make a critical mistake: they analyze a single option strike in isolation. **Institutional Desks do not trade this way.** They trade the volatility surface, sweeping liquidity across the ATM (At-The-Money) and OTM (Out-Of-The-Money) strikes simultaneously.
The **Institutional Options Matrix ** is designed to bridge the gap between retail charts and institutional order flow. It does not just look at price; it aggregates **Volume Pressure, Delta Sensitivity, and Implied Volatility** across a cluster of strikes to detect when "Whales" are positioning for a move.
---
### 🧠 The Quant Logic (How it Works)
This indicator moves beyond simple Moving Averages. It employs **Multi-Strike Cluster Analysis**:
1. **Aggregate Volume Pressure:** Instead of watching just the ATM strike, this algorithm sums the volume of the **ATM + OTM1 + OTM2** strikes. This reveals the true "Sector Sentiment." If the ATM volume is low but OTM volume is spiking, the indicator detects "Speculative Accumulation."
2. **Net Order Flow Histogram:** The histogram at the bottom visualizes the net battle between Call Writers and Put Writers.
* **Green Columns:** Net Call Buying Pressure.
* **Red Columns:** Net Put Buying Pressure.
3. **Smoothed Gamma Detector:** Using a custom smoothing algorithm on Spot vs. Option pricing, the script calculates the rate of change (Gamma). When this spikes, it triggers a **"Gamma Zone"** (Yellow Background), indicating that price is accelerating and Market Makers are likely trapped.
4. **Smart Strike Alignment:** The dashboard monitors the live Spot price. If the market moves significantly away from your selected strike, the dashboard alerts you to **"⚠️ SHIFT TO "**, ensuring you are never trading stale data.
---
### 📊 Key Features
* **Whale Flow Histogram:** Visualizes the aggregate pressure of the top 3 strikes.
* **Gamma Squeeze Zones:** Highlights explosive momentum areas with a yellow background.
* **Dynamic Dashboard:** Displays real-time ATM pricing, Aggregated Volume, and Strike status.
* **Speculation Alerts:** Detects when volume is spiking on OTM strikes (a leading indicator of a breakout).
* **Clean Visuals:** Plots Call (Green) and Put (Red) premiums directly on the chart with simple Buy/Sell triangular signals.
---
### 🛠️ How to Use
**1. Setup:**
* **Asset:** Select Index (NIFTY, BANKNIFTY) or Stock.
* **Expiry:** Enter the current expiry in `YYMMDD` format (e.g., `251212`).
* **Strike:** Enter the current ATM strike manually (e.g., `24500`).
* *Note: Check the dashboard! If it says "⚠️ SHIFT TO...", update your inputs.*
**2. Long Entry (Call Buy):**
* **Signal:** Green Triangle (Call Entry).
* **Confirmation:** Net Flow Histogram is **GREEN** (Positive).
* **Price:** Call Premium (Green Line) crosses above its VWAP.
**3. Short Entry (Put Buy):**
* **Signal:** Red Triangle (Put Entry).
* **Confirmation:** Net Flow Histogram is **RED** (Negative).
* **Price:** Put Premium (Red Line) crosses above its VWAP.
**4. The Gamma Boost:**
* If the background turns **YELLOW**, a Gamma Squeeze is active. These are high-probability, high-velocity moves.
---
### ⚠️ Disclaimer
*This tool is for educational purposes only. Options trading involves significant risk and is not suitable for all investors. This script relies on data provided by TradingView (NSE); delayed data may affect signal accuracy. Always manage your risk.*
