LJ Parsons Adjustable expanding MRT Fib Version 2Based on premium/discount/fair-value levels the indicator will expand with the market by settable dates.
The levels are not fib based as such but are resonant levels within an multiplicative /12 log scale using the LJ Parsons Market resonance hypothesis.
Chỉ báo và chiến lược

Relative Strength vs S&P 500 (SPX/ES) Relative Strength vs S&P 500
This indicator measures the relative performance of an asset compared to the S&P 500, helping traders and investors identify whether an asset is outperforming or underperforming the broader market.
The calculation is based on a price ratio between the selected asset and the S&P 500, optionally normalized to a base value (100) for easier interpretation.
How to read it:
Above the baseline (100) → the asset is outperforming the S&P 500
Below the baseline (100) → the asset is underperforming the S&P 500
Rising line → strengthening relative performance
Falling line → weakening relative performance
Why it’s useful:
Helps focus on market leaders, not just assets that “look cheap”
Filters trades and investments in the direction of relative strength
Useful for swing trading, long-term investing, and portfolio allocation
Widely used in institutional and professional asset management
This indicator is best used as a trend and selection filter, in combination with technical setups (support/resistance, VWAP, structure).

Market time opens @NeoNztime opens marked out new york session , london session, asia session and highs and lows of each one


Strategy-Based Breakout Backtest by AlturoiThis educational strategy is designed to help active traders learn how to turn trading ideas into data-driven decisions by testing strategies against historical price action before risking real capital.
The script walks through the step-by-step backtesting workflow on TradingView, showing how strategy logic, entries, exits, and risk rules translate into measurable performance metrics such as win rate, drawdown, and expectancy.
What this script helps you learn:
How to backtest on TradingView using Pine Script strategies
How the Strategy Tester calculates performance results
How to interpret win rate, drawdowns, and consistency
How to validate breakout and support/resistance concepts
How to identify structural edge — or flaws — before going live
This is not a signal service or financial advice. It is an educational framework meant to help traders understand proper backtesting techniques and avoid common mistakes when evaluating trading strategies.
Use this script as a learning template to experiment, modify logic, and improve your understanding of how professional backtesting on TradingView works.

SETUP XANDAO ETFEste setap é usado para operar nos futuros, usamos essas métricas para poder achar entradas


3 EMA IndicatorThis indicator is a combination og three EMA's
This indicator is a combination og three EMA's
This indicator is a combination og three EMA's
This indicator is a combination og three EMA's
This indicator is a combination og three EMA's

50SMA bounceScans stocks that closed above Weekly 10SMA and previous week closing below the weekly 10SMA

XAU Seasonality + Setup Quality + Month Strength | WarRoomXYZXAU Seasonality Engine is a technical analysis indicator developed for the study of recurring, calendar-based behavior on XAUUSD (Gold).
The tool blends month-of-year seasonality statistics with higher-timeframe context and a setup-quality gate to help users observe when market conditions historically lean strong, weak, or neutral — and how strict trade selection should be during each regime.
Indicator Concept
An indicator for XAUUSD that combines:
1. Seasonality Regime (Month-of-Year Bias)
► Classifies the current month as Strong / Weak / Neutral based on either:
• Preset months (user-defined)
or
• Auto mode (computed from historical monthly performance)
► Strong months suggest a bullish tailwind (not a signal).
► Weak months suggest headwind / caution and require stricter setup quality.
2. Monthly Performance Engine (Under the Hood)
► Uses the symbol’s monthly timeframe data to compute, per calendar month:
• Average monthly return (%)
• Win rate (%) — how often that month closes positive
• Month Strength Score (0–100) — a blended score derived from performance data
► The score is designed to provide a relative strength snapshot of seasonality by month.
3. Month Strength Histogram
► Plots a histogram (0–100) of the current month’s strength score.
• Higher bars = historically stronger month tendency
• Lower bars = historically weaker month tendency
► Optional horizontal reference lines mark “strong” and “weak” zones to make regimes obvious at a glance.
4. Setup Quality Meter (Confluence Filter)
► The indicator calculates a Setup Quality Score (0–100) using market structure and momentum components, such as:
• EMA trend alignment
• Momentum confirmation (EMA fast vs slow)
• Structure break confirmation (BOS)
• Liquidity sweep behavior
• Candle confirmation logic
► This score is intended as a trade-selectivity filter , not a trade executor.
5. Adaptive Rules for Weak Months (Strict Mode)
► When the indicator detects a weak seasonal regime, conditions automatically tighten:
• The A+ threshold increases (adaptive thresholding)
• Optional rule: Weak months require BOS + Sweep + FVG simultaneously before any A+ condition is considered valid
This forces the user into “higher-quality-only” behavior during historically weaker seasonal periods.
🔹1 Visual Components Included
• Seasonality regime label (Strong / Weak / Neutral)
• Optional background shading based on regime
• Month Strength Score histogram (0–100)
• Current month stats: Avg return + win rate
• Setup Quality Meter value (0–100)
• Adaptive A+ threshold display
• Weak-month confluence gate status (BOS / Sweep / FVG pass/fail)
• Optional alerts when strict criteria are met
➣What Means in the XAU Indicator
🔹 Definition (in THIS indicator)
Win Rate = the percentage of historical months that closed positive for the same calendar month.
It is NOT:
trade win rate ❌
signal accuracy ❌
It is a s tatistical seasonality metric .
How It’s Calculated
For each calendar month (January, February, etc.), the indicator:
1.Looks at historical monthly candles (Monthly timeframe).
2. Counts how many times that month:
•Closed higher than it opened (or higher than previous month close).
3. Divides:
Number of positive months
÷
Total number of observed months
× 100
Example: September
If over the last 20 years:
September closed green 14 times
September closed red 6 times
Then:
Win Rate = (14 / 20) × 100 = 70%
That’s what you see as in the dashboard.
What the Win Rate Is Used For
1️⃣ Part of the Month Strength Score
The indicator blends:
•Average Monthly Return (%) → measures magnitude
•Win Rate (%) → measures consistency
Combined into:
Month Strength Score (0–100)
This avoids a common trap:
•A month with 1 huge rally but many losses ≠ reliable
•A month with steady positive closes = higher quality environment
What Win Rate Tells You
High Win Rate (e.g. 65–75%)
•Gold more often closes higher in this month
•Continuation is statistically more likely
•Pullbacks are more likely to resolve in trend direction
Low Win Rate (e.g. 35–45%)
•Gold more often fails to close higher
•More chop, deeper retracements, false breakouts
•Continuation trades statistically struggle
What It Does NOT Tell You
🚫 It does NOT mean:
•“You will win 70% of your trades”
•“Every setup in this month works”
•“Direction is guaranteed”
Seasonality is context, not prediction.
Why This Is Powerful When Combined With Your System
On its own, win rate is just data.
But in your indicator, it’s used to:
•🔒 Raise the A+ threshold in weak months
•🧠 Force BOS + Sweep + FVG confluence
•❌ Block marginal setups automatically
So instead of guessing:
-“Why is gold so choppy this month?”
You know:
-“This month historically underperforms SO I must be stricter.”
➣What Means in the XAU Seasonality Indicator
🔹 Definition (in THIS indicator)
Avg Monthly Return = the average percentage gain or loss of XAUUSD for a specific calendar month, calculated across many years.
It measures magnitude , not frequency.
It is NOT:
•trade profit ❌
•expected return for the next month ❌
•guaranteed performance ❌
It is a historical seasonality tendency.
How It’s Calculated
For each calendar month (January, February, etc.), the indicator:
1.Takes every historical occurrence of that month.
2.Calculates the percentage change of the monthly candle:
(Monthly Close − Previous Monthly Close)
÷ Previous Monthly Close × 100
3. Adds all those percentage changes together.
4. Divides by the total number of observations.
Example: September
Assume over 20 years:
+2.4%, +1.1%, −0.6%, +3.0%, +1.8%, ...
If the sum of all September returns = +28% across 20 years:
Avg Monthly Return = +1.40%
That’s the number displayed in the indicator.
What Avg Monthly Return Is Used For
1️⃣ Measuring Strength of Movement
•Win Rate → “How often does it close green?”
•Avg Monthly Return → “How big are the moves when it works?”
Both are needed.
A month can:
•Win often but move very little
•Move a lot but only occasionally
The indicator combines both to avoid misleading conclusions.
How to Interpret Avg Monthly Return
Positive Avg Return (e.g. +0.8% to +2.0%)
•Gold tends to expand during this month
•Continuation phases are more likely
•Pullbacks are often absorbed
Near-Zero Avg Return (e.g. −0.2% to +0.2%)
•Market is statistically balanced
•Expect chop, rotations, false breaks
•Continuation is less reliable
Negative Avg Return (e.g. −0.5% or worse)
•Downward pressure or heavy mean reversion
•Rallies often fade
•Risk of aggressive stop hunts
What Avg Monthly Return Does NOT Mean
🚫 It does NOT mean:
•“Price will move +1.4% this month”
•“You should buy because the number is positive”
•“This is a guaranteed edge”
It describes historical behavior, not future certainty.
Why Avg Monthly Return Matters More Than People Think
Two months can have the same win rate but behave very differently:
Example:
Month Win Rate Avg Return Reality
Month A 65% +0.2% Small, choppy wins
Month B 55% +1.6% Fewer wins, but strong expansions
Your indicator would rank Month B as stronger, which is correct for continuation-based strategies.
How It Feeds the Month Strength Score
The indicator blends:
•60% Avg Monthly Return (normalized)
•40% Win Rate
This means:
•Big moves matter more than small consistency
•But consistency still matters enough to prevent distortion
Result:
Month Strength Score (0–100)
Which is then used to:
•tighten or relax A+ thresholds
•activate weak-month strict rules
•control trade frequency
🔹2. Intended Use
The indicator is designed as a discretionary analysis tool to support study of:
• seasonal bias and calendar tendencies
• relative strength/weakness across months
• how strict trade selection should be across different regimes
• confluence behavior when seasonal conditions are unfavorable
The tool does not generate forecasts, does not guarantee outcomes, and should not be relied upon as a stand-alone decision mechanism.
🔹3.How to Use XAU Seasonality Engine
Recommended charts: XAUUSD, intraday (5m–15m) with a HTF context (1H–4H).
1. Identify the Seasonal Regime
• Strong month → you can allow more continuation bias (still require structure).
• Neutral month → trade normally, standard criteria.
• Weak month → tighten selection, demand clean A+ conditions only.
2. Read the Month Strength Histogram
• If the score is high (e.g., 70+), the month has historically shown stronger tendency.
• If the score is low (e.g., 40 and below), expect slower conditions, deeper pullbacks, or more chop — and reduce marginal trades.
3. Use the Setup Quality Meter as the Gate
► In normal/strong months:
• A+ threshold is moderate (e.g., 70)
► In weak months:
• A+ threshold is higher (e.g., 80+)
• Optional strict mode: must also pass BOS + Sweep + FVG alignment
4. Example Trade Logic (Framework, Not Signals)
► Bullish framework in a Strong Month:
• Seasonal regime = Strong (tailwind)
• Structure supports bullish continuation (trend alignment)
• Sweep occurs into demand / liquidity grab
• Setup Quality reaches A+ threshold
• Entry: confirmation candle or retrace to key level
• SL: beyond sweep low / invalidation
• TP: nearest liquidity / prior highs / HTF level
► Weak Month rule-set (Strict Mode):
• Seasonal regime = Weak (headwind)
• Only consider trades if:
✅ BOS confirms direction
✅ Sweep occurs and rejects cleanly
✅ FVG exists recently (or is mitigated if you choose that model)
✅ Setup Quality exceeds the elevated adaptive threshold
If any one is missing → no trade
This is not meant to “predict” gold — it’s meant to enforce discipline when seasonality historically underperforms.
🔹4.Limitations and User Responsibility
► The indicator does not represent financial advice or imply performance expectations.
► Seasonality is statistical tendency, not certainty — macro conditions can override it.
► Results vary by broker feed, timeframe, and settings.
► Users should test thoroughly in simulation before applying to live markets.
► All trading decisions, risk management, and execution remain solely the responsibility of the user.
🔹5. Alerts
Optional alerts can notify when:
• a new month begins and the seasonal regime changes
• A+ criteria are met
• weak-month strict conditions pass (BOS + Sweep + FVG)
Alerts are informational only and do not constitute actionable recommendations.
Disclaimer
This script is provided for informational and educational purposes only . It does not provide financial, investment, or trading advice, and it does not guarantee profits or future performance. All decisions made based on this script are solely the responsibility of the user.
This script does not execute trades, manage risk, or replace the need for trader discretion. Market behavior can change quickly, and past behavior detected by the script does not ensure similar future outcomes.
Users should test the script on demo or simulation environments before applying it to live markets and must maintain full responsibility for their own risk management, position sizing, and trade execution.
Trading involves risk, and losses can exceed deposits. By using this script, you acknowledge that you understand and accept all associated risks.

Print Bar DataThis script print out the recent bar data. You can configure the position, bar numbers, of the data

ProTradersNetwork-inefficiencyInefficiency Candles Colored, No matter the timeframe, ensures clear visibility of which candles had the most momentum.


Fixed Time Frame EMA [TickDaddy]Show a 50 period EMA on the 15 minute timeframe on any other timeframe like 5 min, 1 min, 1 hour, etc.. etc..
it's all customizable, you choose the timeframe, ema, color, all that good stuff.

3 Trading Sessions [TickDaddy]Customizable 3 trading session indicator. Asia, Longdon, New York. Adjust times for each session, color, opacity. toggle if you want to see future sessions coming up.

High Vol Big Move (Up or Down)Nine million EP with 4% stock moved up or down, and today's volume is more than yesterday's volume.

TradingSystems_AlphaLib_v1_FinalLibrary "TradingSystems_AlphaLib_v1_Final"
Master Library for Institutional Analysis v1
@author jmcanovelles
calc_ema(len)
Calculates standardized EMA
Parameters:
len (simple int)
calc_adx(len)
Calculates precise ADX and DI
Parameters:
len (simple int)

TradingSystems_AlphaLib_v6//@version=6
// @description Master Library for Institutional Grade Analysis v1
// @author jmcanovelles
library("TradingSystems_AlphaLib_v6")
// @function Calculates standardized EMA
// @param len Period for the average
export calc_ema(int len) =>
ta.ema(close, len)
// @function Calculates precise ADX and DI
// @param len Calculation period
export calc_adx(int len) =>
= ta.dmi(len, len)

ORB 2R Retest Volume Entry (1m) - v6gJdsfjs kdfg s jdslzi gdsjzg SJFds SJKdls dsjzgfjdkzl GDMKls gndsmzgSfgndmsKF fdnsioGLfs


OCC Strategy Optimized (MA 5 + Delayed TSL)# OCC Strategy Optimized (MA 5 + Delayed TSL) - User Guide
## Introduction
The **OCC Strategy Optimized** is an enhanced version of the classic **Open Close Cross (OCC)** strategy. This strategy is designed for high-precision trend following, utilizing the crossover logic of Open and Close moving averages to identify market shifts. This optimized version incorporates advanced risk management, multi-timeframe analysis, and a variety of moving average types to provide a robust trading solution for modern markets.
>
> **Special Thanks:** This strategy is based on the original work of **JustUncleL**, a renowned Pine Script developer. You can find their work and profile on TradingView here: (in.tradingview.com).
---
## Key Features
### 1. Optimized Core Logic
- **MA Period (Default: 5):** The strategy is tuned with a shorter MA length to reduce lag and capture trends earlier.
- **Crossing Logic:** Signals are generated when the Moving Average of the **Close** crosses the Moving Average of the **Open**.
### 2. Multi-Timeframe (MTF) Analysis
- **Alternate Resolution:** Use a higher timeframe (Resolution Multiplier) to filter out noise. By default, it uses $3 \times$ your current chart timeframe to confirm the trend.
- **Non-Repainting:** Includes an optional delay offset to ensure signals are confirmed and do not disappear (repaint) after the bar closes.
### 3. Advanced Risk Management
This script features a hierarchical exit system to protect your capital and lock in profits:
- **Fixed Stop Loss (Initial):** Protects against sudden market reversals immediately after entry.
- **Delayed Trailing Stop Loss (TSL):**
- **Activation Delay:** The TSL only activates after the trade reaches a specific profit threshold (e.g., 1%). This prevents being stopped out too early in the trade's development.
- **Ratchet Trail:** Once activated, the stop loss "ratchets" up/down, never moving backward, ensuring you lock in profits as the trend continues.
- **Take Profit (TP):** A fixed percentage target to exit the trade at a pre-defined profit level.
### 4. Versatility
- **12 MA Types:** Choose from SMA, EMA, DEMA, TEMA, WMA, VWMA, SMMA, HullMA, LSMA, ALMA, SSMA, and TMA.
- **Trade Direction:** Toggle between Long-only, Short-only, or Both.
- **Visuals:** Optional bar coloring to visualize the trend directly on the candlesticks.
---
## User Input Guide
### Core Settings
- **Use Alternate Resolution?:** Enable this to use the MTF logic.
- **Multiplier for Alternate Resolution:** How many charts higher the "filter" timeframe should be.
- **MA Type:** Select your preferred moving average smoothing method.
- **MA Period:** The length of the Open/Close averages.
- **Delay Open/Close MA:** Use `1` or higher to force non-repainting behavior.
### Risk Management Settings
- **Use Trailing Stop Loss?:** Enables the TSL system.
- **Trailing Stop %:** The distance the stop follows behind the price (Optimized Default: 1.5%).
- **TSL Activation % (Delay):** The profit % required before the TSL starts moving. (Optimized Default: 2.0% to ensure 0.5% profit is locked immediately).
- **Initial Fixed Stop Loss %:** Your hard stop if the trade immediately goes against you.
- **Take Profit %:** Your ultimate profit target for the trade.
---
## How to Trade with This Strategy
1. **Identify the Trend:** Look for the Moving Average lines (Close vs Open) to cross.
2. **Wait for Confirmation:** If using MTF, ensure the higher timeframe also shows a trend change.
3. **Manage the Trade:** Let the TSL work. With the default **2.0% Activation** and **1.5% Trail**, the strategy will automatically lock in **0.5% profit** the moment the threshold is hit, then follow the price higher.
4. **Position Sizing:** Adjust the `Properties` tab in the script settings to match your desired capital allocation (Default is 10% of equity).
---
## Recommended Settings
1. Trialing < Activation
2. Check ranging
## Credits
Original Strategy by: **JustUncleL**
Optimized and Enhanced by: **Antigravity AI**

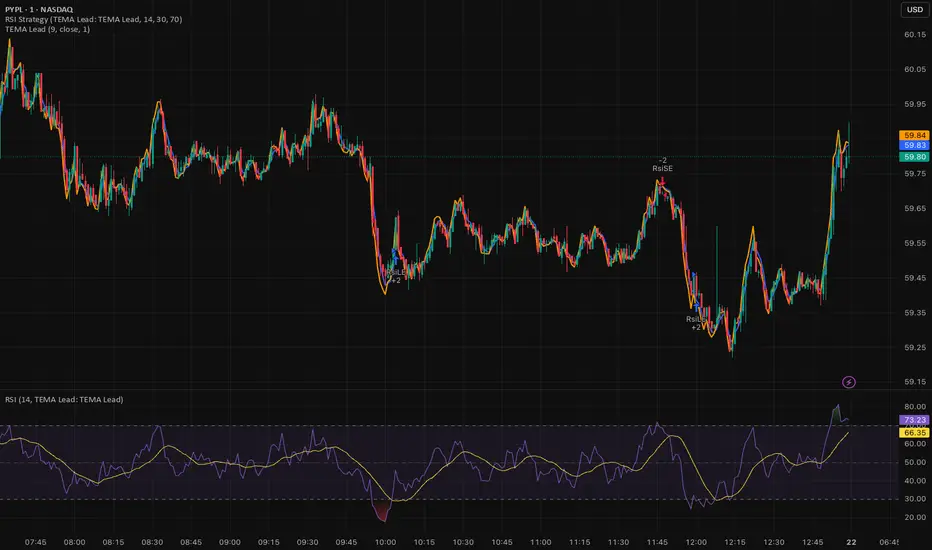
Triple EMA (TEMA) + Slope LeadThis indicator plots a standard Triple EMA (TEMA) and an optional slope-lead version. TEMA is a low-lag moving average built from three EMAs, allowing it to track price more closely than a single EMA. The Lead Strength (k) adds a small forward “push” based on the recent TEMA slope:
TEMA_lead = TEMA + k × (TEMA − TEMA ). Higher k values make the line react earlier but increase sensitivity in chop.
Used as a source for other indicators (RSI, MACD, stochastic, regime filters, etc.), TEMA or TEMA-Lead may improve signal quality by reducing noise, aligning momentum readings with trend direction, and producing earlier, cleaner transitions at turns, often without the excessive lag introduced by heavier smoothing.