ICT Precision Turtle Soup NuNi1. Identify the CRT Range (The Context)
Before looking for a trade, the indicator defines the Candle Range Theory (CRT) boundaries based on your lookback period.
CRT High (Red Line): Represents old buy-side liquidity.
CRT Low (Green Line): Represents old sell-side liquidity.
HTF Filter: The code ensures the higher timeframe trend (e.g., 4H) aligns with your direction. Only look for Buys if the HTF trend is bullish.
2. The Manipulation (Turtle Soup 🐢)
Wait for price to move outside the CRT boundaries.
The Trap: Price must sweep below the CRT Low or above the CRT High.
The Reclaim: A Turtle Body Soup (TBS) occurs when the candle body closes back inside the range, or a wick rejection happens.
Symbol: A 🐢 icon will appear on the chart. Do not entry yet. This is just a warning that a setup is forming.
3. The Shift & Momentum (The Trigger)
To ensure a high-probability entry, the indicator waits for two technical confirmations:
MSS (Market Structure Shift): Price must break the most recent swing high (for Buys) or swing low (for Sells).
Displacement: The breaking candle must be "displaced"—meaning it has a large, energetic body compared to previous candles. This proves that big banks/institutions are moving the price.
4. The Entry Execution
Once all conditions are met, the "⭐ PRECISION ENTRY" label will appear.
Execution: You can enter at the market price when the label appears.
Retest Entry: Alternatively, look for the price to return to the IFVG or Breaker Zone (the shaded box) drawn by the indicator for a more refined entry.
Chỉ báo và chiến lược


SFI Follow Trend Level 1 ( SFI Academy )“SFI Trading Level 1 Indicator is a proprietary indicator used by SFI Academy for its students, in combination with SFI Academy’s exclusive capital management toolset.”

Early Trend Warning Using MTF AnalysisAs an active trader and software professional, I build my own indicators. I built this one today which I want to share with fellow traders.
If you are a trend trader then HTF/MTF analysis is very critical. It is virtually impossible to constantly track multiple tickers all the time. One should not take a buy trade when MTF is bearish and vice versa. This indicator solves this problem.
The EMA Trend Warning indicator helps traders detect potential trend changes early by analyzing price interactions with multi-timeframe Exponential Moving Averages (EMAs) and their momentum. It sends instant alerts when price crosses above or below EMAs with supporting momentum, making it easier to capture bullish or bearish moves.
The EMA Trend Warning indicator detects potential trend changes by monitoring price against 14-period EMAs on multiple timeframes: 15-minute, 30-minute, and 1-hour charts. It sends alerts when the price crosses above or below the EMA with supporting momentum, helping traders identify early bullish or bearish signals.
How It Works:
1. Calculates 14-period EMA on 15m, 30m, and 1H charts.
2. Computes EMA slopes to determine momentum direction.
3. BUY alert triggers when price crosses above the 15m EMA and at least one EMA slope is upward.
4. SELL alert triggers when price crosses below the 15m EMA and at least one EMA slope is downward.
5. Alerts fire once per bar and track previous state to avoid repeated notifications.
Features:
1. Multi-timeframe EMA monitoring.
2. Momentum confirmation with EMA slopes.
3. Instant BUY/SELL alerts.
4. Tracks previous trend state to prevent alert spam.
Benefits:
1. Detects trend changes early for better entry timing.
2. Confirms trend across multiple timeframes.
3. Saves time with automated alerts.
4. Helps traders align trades with market momentum.
Please consider this indicator as EARLY WARNING ONLY. Take trade based on multiple confluences post receiving any warning. I have tested it on BTCUSD since yesterday, multiple warning alerts were 100% perfect.

Gann Octave Pro - Angles & Time Cycles 🎯 Gann Octave Pro - Angles & Time Cycles
## Complete Gann Trading System - Price, Angles & Time in One Indicator
A professional-grade Gann analysis tool combining **Octave Price Levels**, **Gann Angles (1x1, 2x1, 1x2)**, and **Advanced Time Cycle Projections**. Perfect for traders seeking precision market timing through geometric confluence.
---
## 🌟 Key Features
### 📐 Octave Price Levels
- **5 Key Levels**: 0%, 25%, 50%, 75%, 100%
- **Color-Coded**: Green (support) → Blue (50% pivot) → Red (resistance) → Black (boundaries)
- **Dynamic Updates**: Auto-adjusts to swing structure
- **Trading Edge**: 50% level is the most powerful reversal zone
### 📏 Gann Angles
- **1x1 Angle** (Black) - Natural 45° trend line
- **2x1 Angle** (Red) - Steep acceleration zone
- **1x2 Angle** (Red) - Gradual support/resistance
- **Customizable Extension**: Fixed bars or % of swing length
### ⏰ Advanced Time Cycles
**Three Calculation Methods:**
1. **Angle-Level Confluence** ⭐ (Recommended)
- Calculates intersections of Gann angles with octave levels
- Most sophisticated timing system
- Based on price-time geometry
2. **Swing Duration** - Uses actual swing bar length
3. **Harmonic (Swing/8)** - Classic Gann harmonic division
**Cycle Visualization:**
- **Full Cycles** (Purple, solid) - Major turning points, labeled "◆ FC1 (176 bars) "
- **Sub-Cycles** (Blue, dotted) - Minor pivots, labeled "S1 "
- **Mid-Cycles** (Orange, dashed) - Half-cycle inflection points
- **Past Display**: Shows 4 complete past cycles for validation
- **Future Projection**: Projects 8 future cycles for anticipation
---
## 🎯 How to Use
### Quick Start
1. Apply to chart (works all timeframes/instruments)
2. Select period: Default 44 bars (adjust based on timeframe)
3. Choose cycle method: "Angle-Level Confluence" for best results
4. Observe past cycles to validate timing accuracy
### Trading Strategies
**Triple Confluence Setup** (Highest Probability)
- Price at octave level (especially 50%)
- Price touches Gann angle (1x1 most reliable)
- Time cycle arrives (full cycle preferred)
- **Entry**: On confluence | **Stop**: Below/above octave level | **Target**: Next level
**Cycle Anticipation**
- Enter 1-2 bars before cycle line if price at octave level
- Exit at next cycle or target octave level
- **Edge**: Anticipate cycles instead of reacting
**Angle Breakout + Cycle**
- Price breaks 1x1 angle + next cycle within 20 bars
- Hold through cycle, exit at 2x1 angle or next major level
---
## ⚙️ Customization
### Period Selection (88-Based)
11 harmonic options: 3, 6, 11, 22, **44**, 88, 176, 352, 704, 1408, 2816 bars
- **Intraday** (15m-1h): Period 3-4
- **Swing Trading** (4h-Daily): Period 4-5
- **Position Trading** (Daily-Weekly): Period 5-6
### Visual Controls
- **Colors**: Independent for all elements
- **Line Widths**: Separate controls (1-5) for levels, angles, cycles
- **Label Size**: Tiny/Small/Normal/Large (unified)
- **Label Position**: Top/Middle/Bottom
- **Show/Hide**: Toggle any component
### Alerts
- 50% octave level breakouts
- Customizable messages
---
## 💡 Pro Tips
1. **Validate First**: Observe 2-3 past cycles before trading
2. **Adjust to Volatility**: High volatility = lower period (22-44), Low = higher (88-176)
3. **Multiple Timeframes**: Apply on different timeframes for confirmation
4. **Respect 50% Level**: Most powerful reversal zone in Gann theory
5. **Focus on Full Cycles**: Highest probability setups (◆ FC markers)
6. **Combine with Price Action**: Indicator shows WHERE/WHEN, price action shows HOW
---
## 🚀 What Makes It Unique
✅ **Intelligent Confluence Cycles** - Unique angle-level intersection calculation
✅ **Historical Validation** - See past cycles to trust future projections
✅ **Professional Design** - Color-coded hierarchy, clean labels, no clutter
✅ **Complete Automation** - Everything updates in real-time
✅ **Three-Dimensional Analysis** - Price + Angles + Time = complete picture
---
## 📊 Best Markets
- Stock indices (S&P 500, NASDAQ, Dow)
- Forex majors (EUR/USD, GBP/USD, USD/JPY)
- Commodities (Gold, Silver, Oil)
- Crypto (BTC, ETH)
- Liquid stocks
✅ Complete Gann system (price + angles + time)
✅ 3 time cycle methods
✅ Auto swing detection
✅ 4 past + 8 future cycle projections
✅ Professional visualization
✅ Extensive customization
✅ Real-time alerts
✅ Works all markets/timeframes
---
## ⚠️ Disclaimer
This indicator is for educational purposes and applies W.D. Gann methodology principles. Not financial advice. Always use proper risk management, position sizing, and stop losses. Practice on paper before live trading. Past performance doesn't guarantee future results.
---
**The market moves in patterns of price and time. This indicator helps you see them.**
Trade with geometry. Trade with time. Trade with confidence.

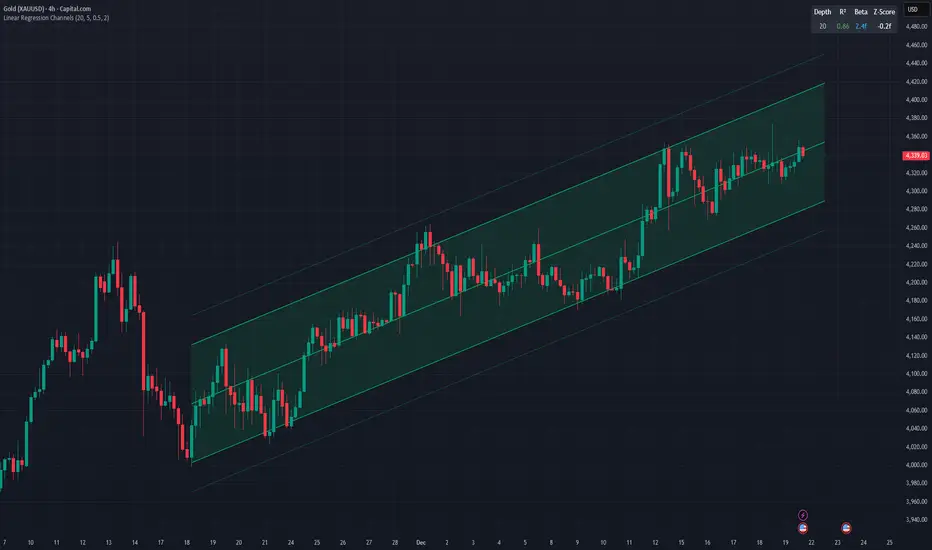
Linear Regression ChannelsThis indicator dynamically identifies and plots the best-fit linear regression channels based on recent pivot points, optimizing for statistical strength across user-defined depths.
How It Works (Technical Methodology)
1. Pivot Point Detection
The indicator uses Pine Script's ta.pivothigh() and ta.pivotlow() functions with a configurable sensitivity length to detect swing highs and lows. All recent pivot indices are stored in an array (limited to avoid performance issues), providing potential starting points for regression calculations.
2. Multi-Depth Evaluation
Users input comma-separated "Pivot History Depths" (e.g., "5,20,50"). For each depth:
- The script evaluates regression fits starting from the most recent pivots, up to the specified depth count.
- It calculates linear regression statistics for each possible channel originating from those pivot bars backward to the current bar.
3. Linear Regression Calculation
For each candidate channel:
- Slope (m) and intercept (b) are computed using least-squares method.
- R-squared (R²) measures goodness of fit (how well price follows the trend line).
- Standard error of the estimate is calculated to quantify volatility around the regression line.
- A composite score = R² × log(length) prioritizes stronger fits on longer periods.
4. Best-Fit Selection and Validation
- Only channels with R² ≥ user-defined minimum (default 0.5) are considered valid.
- The channel with the highest score for each depth is selected and drawn.
- This ensures the most statistically significant and relevant channels are displayed, avoiding weak or short-term noise.
5. Channel Construction
- Mean Line: The regression trend line extended slightly into the future.
- Inner Channels: ± user-configurable standard deviation multiplier (default 2.0σ) around the mean.
- Outer Bands: ±1.5× the inner deviation for additional visual context.
- Filled areas between mean and inner channels for better visibility.
- Color: Green shades for upward slopes (bullish trend), red shades for downward slopes (bearish trend).
6. Dashboard and Statistics
- Optional table in the top-right corner displays for each depth:
- Depth value
- R² (colored green if >0.7, orange otherwise)
- Slope (Beta) – positive blue for uptrend, red for downtrend
- Current Z-Score: How many standard deviations the latest close is from the expected regression value (yellow if |Z| > 2)
How to Use
Regression channels help identify trending markets, potential mean reversion, and overextension.
- Upward Channels (Green): Price above the mean may indicate strength; pullbacks to the mean or lower band offer long opportunities. Overextension above upper band could signal exhaustion.
- Downward Channels (Red): Price below the mean may indicate weakness; rallies to the mean or upper band offer short opportunities. Overextension below lower band could signal capitulation.
- High R² (>0.7): Strong trending channel – trade in direction of slope.
- Low R²: Choppy/range-bound market – avoid trend-following trades.
- Z-Score: |Z| > 2 suggests price is statistically overextended from the trend (potential reversion setup).
- Multi-Depth: Smaller depths catch short-term trends; larger depths capture major trends. Use multiple for confluence across timeframes.
Combine with volume, support/resistance, or other indicators for confirmation.
Disclaimer
This indicator is a technical analysis tool and should be used in conjunction with other forms of analysis. Past performance does not guarantee future results. Always use proper risk management.
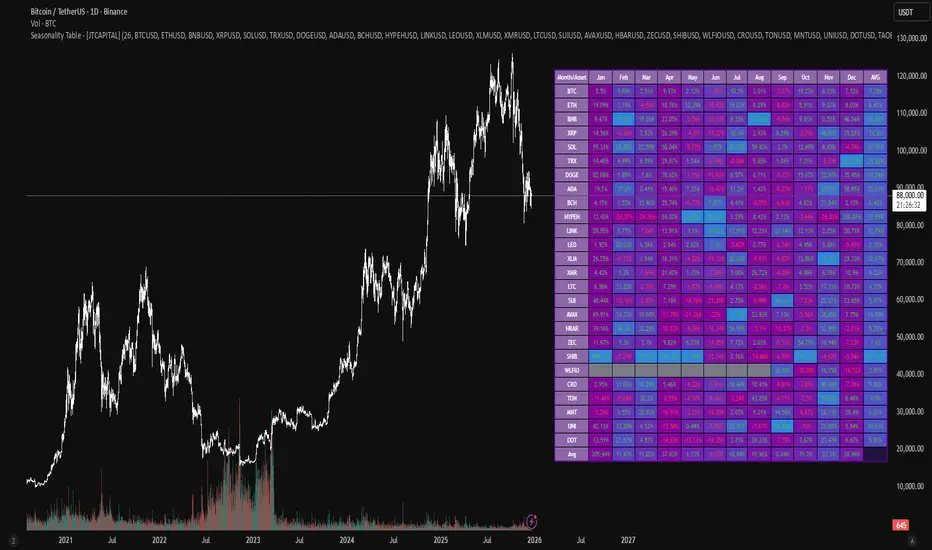
Seasonality Table - [JTCAPITAL]Seasonality Table - is a modified way to use monthly return aggregation across multiple assets to identify seasonal trends in cryptocurrencies and indices.
The indicator works by calculating in the following steps:
Asset Selection
The user defines a list of assets to include in the seasonality table. By default, the script allows up to 32 assets, including popular cryptocurrencies like BTC, ETH, BNB, XRP, and others. Each asset is identified by its symbol (e.g., "CRYPTO:BTCUSD").
Monthly Return Calculation
For each asset, the script requests monthly price data using request.security. Specifically, it retrieves the monthly open, close, and month number. The monthly return is calculated as:
Return = (Close - Open) / Open
This step provides a normalized measure of performance for each asset per month.
Data Aggregation
The script stores two key arrays for each asset and month combination:
sumReturns: The cumulative sum of monthly returns
countReturns: The number of months with valid data
This allows averaging returns later while handling months with missing data gracefully.
Table Construction
Rows representing months (January–December)
Columns representing each asset
An additional column showing the average return for all assets per month
A final row showing the yearly average return for each asset
Filling the Table
The table cells are filled as follows:
Monthly returns are averaged for each asset and displayed as a percentage.
Positive returns are colored green, negative returns red.
Missing data is displayed as a gray “—” placeholder.
Each row’s values are normalized for the color gradient to show relative performance.
Averages Computation
The script calculates two types of averages:
Monthly Average Across Assets : Sum of all asset returns for a month divided by the number of valid data points.
Yearly Average Per Asset : Sum of all monthly returns for an asset divided by the number of months with valid data.
These averages are displayed in the last column and last row respectively, with gradient coloring for visual comparison.
Buy and Sell Conditions
This indicator does not generate explicit buy or sell signals. Instead, it provides a visual heatmap of historical seasonality, allowing traders to:
Identify months where an asset historically outperforms (bullish bias)
Identify months with weak historical performance (bearish caution)
Compare seasonal patterns across multiple assets for portfolio allocation
Filters can be applied by adjusting the asset list, changing the color mapping, or focusing on specific months to highlight seasonal anomalies.
Features and Parameters
Number of assets: Set how many assets are included in the table (1–32).
Assets: Input symbols for the assets you want to analyze.
Low % Color: Defines the color for the lowest monthly returns in the gradient.
High % Color: Defines the color for the highest monthly returns in the gradient.
Cleaned asset names for concise display.
Gradient-based visualization for easier pattern recognition.
Monthly and yearly averages for comparative analysis.
Specifications
Monthly Return Calculation
Uses the formula (Close - Open) / Open for each asset per month. This standardizes performance across different price scales and ensures comparability between assets.
Arrays for Storage
sumReturns: Float array storing cumulative monthly returns.
countReturns: Integer array storing the number of valid data points per month.
These arrays allow efficient aggregation and average calculations without overwriting previous values.
Data Retrieval via Security Calls
Requests monthly OHLC data for each asset using request.security.
Ensures calculations reflect the correct timeframe and allow for historical comparison.
Color and Text Assignment
Green text for positive returns, red for negative returns.
Gray cells indicate missing data.
Gradient background shows relative magnitude within the month.
Seasonality Analysis
The table visually encodes which months historically produce stronger returns.
Useful for portfolio rotation, risk management, and identifying cyclical trends.
Scalability
Supports up to 32 assets.
Dynamically adapts to the number of assets and data availability.
Gradient scales automatically per row for consistent comparison.
Williams Fractals / Goldilocks [NPR21]📊 Williams Fractals — Goldilocks
Description
Williams Fractals — Goldilocks highlights confirmed swing highs and lows using a refined Williams Fractals approach that balances signal frequency and clarity. BUY and SELL labels mark structurally important pivot points while avoiding chart clutter. The Periods (n) setting controls how often signals appear—lower values produce more signals, higher values filter noise. Signals are non-repainting and work on any instrument and any timeframe. Best used as a market structure and confirmation tool.
🔧 How to Use (Quick Guide)
BUY labels = confirmed swing lows (potential support / pullback areas)
SELL labels = confirmed swing highs (potential resistance / exhaustion areas)
Use for structure and confirmation, not as a standalone entry system
Combine with trend direction, key levels, VWAP/EMAs, volume, or momentum
⏱️ Recommended Periods by Timeframe
The Periods (n) setting determines how many and how often labels print.
1m–3m (Scalping): n = 2
More frequent signals; captures short-term swings.
5m–15m (Intraday): n = 8-9
Balanced sensitivity; filters minor noise.
30m–1h+ (HTF/Swing): n = 15-21
Fewer, stronger pivots; highlights major structure.
Rule of thumb: Lower timeframe → lower n. Higher timeframe → higher n.
🌍 Markets & Timeframes
Not futures-only. Works well on stocks, ETFs, forex, crypto, indices, and any timeframe. Adjust n to match the market’s pace.

SpectreSPECTRE - Precision Reversal Detection System
OVERVIEW
Spectre is a channel breakout indicator designed to identify high-probability reversal points by combining Donchian channel breaches with momentum confirmation. It generates BUY signals at oversold extremes and SELL signals at overbought extremes, filtered by trend strength to avoid low-conviction setups.
This indicator replaces the Regime Engine, which will continue to evolve independently as an experimental platform for testing new strategies and enhancements. Spectre was selected as the production replacement based on extensive backtesting across multiple assets and timeframes, which demonstrated superior win rates compared to alternative sell logic approaches (RSI-based exits outperformed CMO-based exits in 13 of 18 test configurations).
SIGNAL LOGIC
BUY CONDITIONS (all must be true):
Price touches or breaks below Donchian lower band
RSI is at or below oversold threshold (default: 35)
ADX confirms sufficient trend strength (default: ≥22)
BBWP confirms adequate volatility (default: ≥20%)
Cooldown period has elapsed since last buy
Cascade limit not reached
SELL CONDITIONS (all must be true):
Price touches or breaks above Donchian upper band
RSI is at or above overbought threshold (default: 70)
ADX confirms sufficient trend strength (default: ≥22)
BBWP confirms adequate volatility (default: ≥20%)
Cooldown period has elapsed since last sell
Cascade limit not reached
Price is not underwater (if protection enabled)
KEY FEATURES
NON-REPAINTING DONCHIAN CHANNELS
Uses previous bar's high/low extremes to prevent signal repainting. What you see in history is what you would have seen in real-time.
MULTI-FACTOR CONFIRMATION
Signals require agreement between price action (Donchian), momentum (RSI), and trend strength (ADX) to filter out low-quality setups.
VOLATILITY FILTER (BBWP)
Bollinger Band Width Percentile measures current volatility relative to historical norms. Low BBWP indicates compressed ranges where breakouts are less reliable - signals are blocked until volatility returns.
CASCADE PROTECTION
Limits consecutive signals in the same direction to prevent overexposure during extended trends. Resets when a signal fires in the opposite direction.
UNDERWATER PROTECTION (Unique to Spectre)
Tracks average entry price of recent buys and blocks sell signals when price has fallen significantly below this level. This prevents locking in large losses during drawdowns and allows positions to recover before exiting.
REGIME DETECTION
Visual background shading indicates current market regime based on Directional Indicator spread and On-Balance Volume trend. Green indicates bullish regime (+DI > -DI, OBV rising). Red indicates bearish regime (-DI > +DI, OBV falling). White/Gray indicates neutral or ranging conditions.
RECOMMENDED SETTINGS BY TIMEFRAME
For 5-minute charts, use RSI Buy 30-35, RSI Sell 70-75, ADX 20-24.
For 15-minute charts, use RSI Buy 30-35, RSI Sell 68-72, ADX 22-26.
For 30-minute charts (default), use RSI Buy 32-38, RSI Sell 68-72, ADX 22-26.
For 1-hour charts, use RSI Buy 35-40, RSI Sell 65-70, ADX 20-24.
For 4-hour charts, use RSI Buy 35-40, RSI Sell 65-70, ADX 18-22.
These are starting points - optimize for your specific assets.
INFO PANEL GUIDE
Regime shows current market bias (Bullish/Bearish/Neutral). RSI shows current value with buy/sell threshold status. ADX shows trend strength categorized as Weak (<15), Range (15-24), Trend (24-34), or Strong (>34). BBWP shows volatility percentile with a warning symbol when below minimum. Donchian shows price position relative to channel bands. Avg Buy shows average entry price and underwater status. Cascade shows current consecutive signal counts versus limits.
USAGE TIPS
Works best in ranging or mean-reverting markets
Reduce RSI thresholds in strong trends (tighter = fewer signals)
Increase ADX minimum in choppy markets to filter noise
Enable underwater protection for swing trading, disable for scalping
Use regime background to contextualize signals (buy in green, sell in red)
Combine with support/resistance levels for additional confirmation

cd_VW_Cx IMPROVED - Quant VWAP System: Regime, Magnets & Z-ScoQuant VWAP System: Regime, Magnets & Z-Score Matrix
This indicator is a comprehensive Quantitative Trading System designed to move beyond simple support and resistance. Instead of static lines, it uses Statistical Probability (Z-Score) and Standard Deviation to define the current market regime, identify institutional value zones, and project high-probability liquidity targets.
It is engineered for Day Traders and Scalpers (Crypto & Futures) who need to know if the market is Trending, Ranging, or preparing for a Breakout.
1. The "Regime" System (Standard Deviation Bands)
The core engine anchors a VWAP (Volume Weighted Average Price) to your chosen timeframe (Daily, Weekly, or Monthly) and projects volatility bands based on market variance.
The Trend Zone (Inner Band / 1.0 SD): This is the "Fair Value" zone. In a healthy trend, price will pull back into this zone and hold. A hold here signals a high-probability continuation (Trend Following).
The Reversion Zone (Outer Band / 2.0 SD): This represents a statistical extreme. Price rarely sustains movement beyond 2 Standard Deviations without a reversion. A touch of this band signals "Overbought" or "Oversold" conditions.
2. Liquidity Magnets (Virgin VWAPs)
The script automatically tracks "Unvisited VWAPs" from previous sessions. These are price levels where significant volume occurred but have not yet been re-tested.
The Logic: Algorithms often target these "open loops." The script visualizes them as Blue Dashed Lines with price tags.
Smart Scaling (Anti-Scrunch): Includes a custom "Ghost Engine" that automatically hides or "ghosts" magnets that are too far away. This prevents your chart from being squashed (scrunched) on lower timeframes, keeping your candles perfectly readable while still tracking targets in the background.
3. The Quant Matrix (Dashboard)
A real-time Heads-Up Display (HUD) that interprets the data for you:
Regime: Detects Volatility Squeezes. If the bands compress, it signals "⚠ SQUEEZE", warning you to stop mean-reversion trading and prepare for an explosive breakout.
Bias: Color-coded Trend Direction (Bullish/Bearish) based on VWAP slope.
Signal: actionable text prompts such as "BUY DIP" (Trend Following), "FADE EXT" (Mean Reversion), or "PREP BREAK" (Squeeze).
4. Visual Intelligence
Bold Day Separators: Clear, vertical dotted dividers with Date Stamps to instantly separate trading sessions.
Dynamic Labels: Floating labels on the right axis identify exactly which deviation level is which, preventing chart confusion.
How to Use
Strategy A: The Trend Pullback (continuation)
Check Matrix: Ensure Bias is BULLISH (Green).
Wait: Allow price to pull back into the Inner Band (Dark Green Zone).
Trigger: If price holds the Center VWAP or the -1.0 SD line, enter Long.
Target: The next Liquidity Magnet above or the +2.0 SD band.
Strategy B: The Reversion Fade (Counter-Trend)
Check Matrix: Ensure price is labeled "EXTREME" or Signal says "FADE EXT".
Trigger: Price touches or pierces the Outer Band (2.0 SD).
Action: Enter counter-trend (Short) with a target back to the Center VWAP (Mean Reversion).
Strategy C: The Magnet Target
Identify a "MAGNET" line (Blue Dashed) near current price.
These act as high-probability Take Profit levels. Price will often rush to these levels to "close the loop" before reversing.
Settings
Anchor: Daily (default), Weekly, or Monthly.
Magnet Focus Range: Adjusts how aggressively the script hides distant magnets to fix chart scaling (Default: 2%).
Visuals: Fully customizable colors, label sizes, and dashboard position.

spy scalp cheat codecombines hma directional scalping strategy plus the option to use optional stochastic quad band to confrim entry

Liquidity Maxing [JOAT]Liquidity Maxing - Institutional Liquidity Matrix
Introduction
Liquidity Maxing is an open-source strategy for TradingView built around institutional market structure concepts. It identifies structural shifts, evaluates trades through multi-factor confluence, and implements layered risk controls.
The strategy is designed for swing trading on 4-hour timeframes, focusing on how institutional order flow manifests in price action through structure breaks, inducements, and liquidity sweeps.
Core Functionality
Liquidity Maxing performs three primary functions:
Tracks market structure to identify when control shifts between buyers and sellers
Scores potential trades using an eight-factor confluence system
Manages position sizing and risk exposure dynamically based on volatility and user-defined limits
The goal is selective trading when multiple conditions align, rather than frequent entries.
Market Structure Engine
The structure engine tracks three key events:
Break of Structure (BOS): Price pushes beyond a prior pivot in the direction of trend
Change of Character (CHoCH): Control flips from bullish to bearish or vice versa
Inducement Sweeps (IDM): Market briefly runs stops against trend before moving in the real direction
The structure module continuously updates strong highs and lows, labeling structural shifts visually. IDM markers are optional and disabled by default to maintain chart clarity.
The trade engine requires valid structure alignment before considering entries. No structure, no trade.
Eight-Factor Confluence System
Instead of relying on a single indicator, Liquidity Maxing uses an eight-factor scoring system:
Structure alignment with current trend
RSI within healthy bands (different ranges for up and down trends)
MACD momentum agreement with direction
Volume above adaptive baseline
Price relative to main trend EMA
Session and weekend filter (configurable)
Volatility expansion/contraction via ATR shifts
Higher-timeframe EMA confirmation
Each factor contributes one point to the confluence score. The default minimum confluence threshold is 6 out of 8, but you can adjust this from 1-8 based on your preference for trade frequency versus selectivity.
Only when structure and confluence agree does the strategy proceed to risk evaluation.
Dynamic Risk Management
Risk controls are implemented in multiple layers:
ATR-based stops and targets with configurable risk-to-reward ratio (default 2:1)
Volatility-adjusted position sizing to maintain consistent risk per trade as ranges expand or compress
Daily and weekly risk budgets that halt new entries once thresholds are reached
Correlation cooldown to prevent clustered trades in the same direction
Global circuit breaker with maximum drawdown limit and emergency kill switch
If any guardrail is breached, the strategy will not open new positions. The dashboard clearly displays risk state for transparency.
Market Presets
The strategy includes configuration presets optimized for different market types:
Crypto (BTC/ETH): RSI bands 70/30, volume multiplier 1.2, enhanced ATR scaling
Forex Majors: RSI bands 75/25, volume multiplier 1.5
Indices (SPY/QQQ): RSI bands 70/30, volume multiplier 1.3
Custom: Default values for user customization
For crypto assets, the strategy automatically applies ATR volatility scaling to account for higher volatility characteristics.
Monitoring and Dashboards
The strategy includes optional monitoring layers:
Risk Operations Dashboard (top-right):
Trend state
Confluence score
ATR value
Current position size percentage
Global drawdown
Daily and weekly risk consumption
Correlation guard state
Alert mode status
Performance Console (top-left):
Net profit
Current equity
Win rate percentage
Average trade value
Sharpe-style ratio (rolling 50-bar window)
Profit factor
Open trade count
Optional risk tint on chart background provides visual indication of "safe to trade" versus "halted" state.
All visualization elements can be toggled on/off from the inputs for clean chart viewing or full telemetry during parameter tuning.
Alerts and Automation
The strategy supports alert integration with two formats:
Standard alerts: Human-readable messages for long, short, and risk-halt conditions
Webhook format: JSON-formatted payloads ready for external execution systems (optional)
Alert messages are predictable and unambiguous, suitable for manual review or automated forwarding to execution engines.
Built-in Validation Suite
The strategy includes an optional validation layer that can be enabled from inputs. It checks:
Internal consistency of structure and confluence metrics
Sanity and ordering of risk parameters
Position sizing compliance with user-defined floors and caps
This validation is optional and not required for trading, but provides transparency into system operation during development or troubleshooting.
Strategy Parameters
Market Presets:
Configuration Preset: Choose between Crypto (BTC/ETH), Forex Majors, Indices (SPY/QQQ), or Custom
Market Structure Architecture:
Pivot Length: Default 5 bars
Filter by Inducement (IDM): Default enabled
Visualize Structure: Default enabled
Structure Lookback: Default 50 bars
Risk & Capital Preservation:
Risk:Reward Ratio: Default 2.0
ATR Period: Default 14
ATR Multiplier (Stop): Default 2.0
Max Drawdown Circuit Breaker: Default 10%
Risk per Trade (% Equity): Default 1.5%
Daily Risk Limit: Default 6%
Weekly Risk Limit: Default 12%
Min Position Size (% Equity): Default 0.25%
Max Position Size (% Equity): Default 5%
Correlation Cooldown (bars): Default 3
Emergency Kill Switch: Default disabled
Signal Confluence:
RSI Length: Default 14
Trend EMA: Default 200
HTF Confirmation TF: Default Daily
Allow Weekend Trading: Default enabled
Minimum Confluence Score (0-8): Default 6
Backtesting Considerations
When backtesting this strategy, consider the following:
Commission: Default 0.05% (adjustable in strategy settings)
Initial Capital: Default $100,000 (adjustable)
Position Sizing: Uses percentage of equity (default 2% per trade)
Timeframe: Optimized for 4-hour charts, though can be tested on other timeframes
Results will vary significantly based on:
Market conditions and volatility regimes
Parameter settings, especially confluence threshold
Risk limit configuration
Symbol characteristics (crypto vs forex vs equities)
Past performance does not guarantee future results. Win rate, profit factor, and other metrics should be evaluated in context of drawdown periods, trade frequency, and market conditions.
How to Use This Strategy
This is a framework that requires understanding and parameter tuning, not a one-size-fits-all solution.
Recommended workflow:
Start on 4-hour timeframe with default parameters and appropriate market preset
Run backtests and study performance console metrics: focus on drawdown behavior, win rate, profit factor, and trade frequency
Adjust confluence threshold to match your risk appetite—higher thresholds mean fewer but more selective trades
Set realistic daily and weekly risk budgets appropriate for your account size and risk tolerance
Consider ATR multiplier adjustments based on market volatility characteristics
Only connect alerts or automation after thorough testing and parameter validation
Treat this as a risk framework with an integrated entry engine, not merely an entry signal generator. The risk controls are as important as the trade signals.
Strategy Limitations
Designed for swing trading timeframes; may not perform optimally on very short timeframes
Requires sufficient market structure to identify pivots; may struggle in choppy or low-volatility environments
Crypto markets require different parameter tuning than traditional markets
Risk limits may prevent entries during favorable setups if daily/weekly budgets are exhausted
Correlation cooldown may delay entries that would otherwise be valid
Backtesting results depend on data quality and may not reflect live trading with slippage
Design Philosophy
Many indicators tell you when price crossed a moving average or RSI left oversold. This strategy addresses questions institutional traders ask:
Who is in control of the market right now?
Is this move structurally significant or just noise?
Do I want to add more risk given what I've already done today/week?
If I'm wrong, exactly how painful can this be?
The strategy provides disciplined, repeatable answers to these questions through systematic structure analysis, confluence filtering, and multi-layer risk management.
Technical Implementation
The strategy uses Pine Script v6 with:
Custom types for structure, confluence, and risk state management
Functional programming approach for reusable calculations
State management through persistent variables
Optional visual elements that can be toggled independently
The code is open-source and can be modified to suit individual needs. All important logic is visible in the source code.
Disclaimer
This script is provided for educational and informational purposes only. It is not intended as financial, investment, trading, or any other type of advice or recommendation. Trading involves substantial risk of loss and is not suitable for all investors. Past performance, whether real or indicated by historical tests of strategies, is not indicative of future results.
No representation is being made that any account will or is likely to achieve profits or losses similar to those shown. In fact, there are frequently sharp differences between backtested results and actual results subsequently achieved by any particular trading strategy.
The user should be aware of the risks involved in trading and should trade only with risk capital. The authors and publishers of this script are not responsible for any losses or damages, including without limitation, any loss of profit, which may arise directly or indirectly from use of or reliance on this script.
This strategy uses technical analysis methods and indicators that are not guaranteed to be accurate or profitable. Market conditions change, and strategies that worked in the past may not work in the future. Users should thoroughly test any strategy in a paper trading environment before risking real capital.
Commission and slippage settings in backtests may not accurately reflect live trading conditions. Real trading results will vary based on execution quality, market liquidity, and other factors not captured in backtesting.
The user assumes full responsibility for all trading decisions made using this script. Always consult with a qualified financial advisor before making investment decisions.
Enjoy - officialjackofalltrades

Multi-Fractal Trading Plan [Gemini] v22Multi-Fractal Trading Plan
The Multi-Fractal Trading Plan is a quantitative market structure engine designed to filter noise and generate actionable daily strategies. Unlike standard auto-trendline indicators that clutter charts with irrelevant data, this system utilizes Fractal Geometry to categorize market liquidity into three institutional layers: Minor (Intraday), Medium (Swing), and Major (Institutional).
This tool functions as a Strategic Advisor, not just a drawing tool. It calculates the delta between price and structural pivots in real-time, alerting you when price enters high-probability "Hot Zones" and generating a live trading plan on your dashboard.
Core Features
1. Three-Tier Fractal Engine The algorithm tracks 15 distinct fractal lengths simultaneously, aggregating them into a clean hierarchy:
Minor Structure (Thin Lines): Captures high-frequency volatility for scalping.
Medium Structure (Medium Lines): Identifies significant swing points and intermediate targets.
Major Structure (Thick Lines): Maps the "Institutional" defense lines where trend reversals and major breakouts occur.
2. The Strategic Dashboard A dynamic data panel in the bottom-right eliminates analysis paralysis:
Floor & Ceiling Targets: Displays the precise price levels of the nearest Support and Resistance.
AI Logic Output: The script analyzes market conditions to generate a specific command, such as "WATCH FOR BREAKOUT", "Near Lows (Look Long?)", or "WAIT (No Setup)".
3. "Hot Zone" Detection Never miss a critical test of structure.
Dynamic Alerting: When price trades within 1% (adjustable) of a Major Trend Line, the indicator’s labels turn Bright Yellow and flash a warning (e.g., "⚠️ WATCH: MAJOR RES").
Focus: This visual cue highlights the exact moment execution is required, reducing screen fatigue.
4. The Quant Web & Markers
Pivot Validation: Deep blue fractal markers (▲/▼) identify the exact candles responsible for the structure.
Inter-Timeframe Web: Faint dotted lines connect Minor pivots directly to Major pivots, visualizing the "hidden" elasticity between short-term noise and long-term trend anchors.
5. Enterprise Stability Engine Engineered to solve the "Vertical Line" and "1970 Epoch" glitches common in Pine Script trend indicators. This engine is optimized for Futures (NQ/ES), Forex, and Crypto, ensuring stability across all timeframes (including gaps on ETH/RTH charts).
Operational Guide
Consult the Dashboard: Before executing, check the "Strategy" output. If it says "WAIT", the market is in chop. If it says "WATCH FOR BOUNCE", prepare your entry criteria.
Monitor Hot Zones: A Yellow Label indicates price is testing a major liquidity level. This is your signal to watch for a rejection wick or a high-volume breakout.
Utilize the Web: Use the faint web lines to find "confluence" where a short-term pullback aligns with a long-term trend line.
Configuration
Show History: Toggles "Ghost Lines" (Blue) to display historical structure and broken trends.
Fractal Points: Toggles the geometric pivot markers.
Hot Zone %: Adjusts the sensitivity of the Yellow Warning system (Default: 1%).
Max Line Length: A noise filter that removes stale or "spiderweb" lines that are no longer statistically relevant.

Gann VooDoo Lines [NPR21]GANN VooDoo Lines
Gann Square of 9 - TOS Scale Edition is a high-precision conversion of the classic ThinkOrSwim (TOS) Gann Square of 9 tool, specifically rebuilt for Pine Script v6. It is designed for traders who rely on mathematical price rotations to identify hidden support and resistance levels.
Unlike standard horizontal line tools, this version is specifically engineered to "handshake" with the TradingView price scale, ensuring that every mathematical rotation is clearly labeled on your Y-axis for instant reference.
How to Use This Script
Define Your Anchor Point:
Find a major swing high or swing low on your chart.
Open the script Settings (gear icon) and enter this value into the Manual Anchor Price field.
Select Market Direction:
Down (Support): Use this if your anchor is a Swing High. The script will calculate support levels below that price.
Up (Resistance): Use this if your anchor is a Swing Low. The script will calculate resistance levels above that price.
Adjust the Visual Scope:
Use the Extend Right and Extend Left toggles. If both are checked, the Gann levels will act as infinite "Voodoo Lines" across your entire chart history.
The "TOS Scale" Final Step (Crucial):
To see the colored price boxes on your vertical axis, Right-click the Price Scale (the numbers on the right of your chart).
Hover over Labels and ensure Indicator Value Labels is Checked.
IMPORTANT: Uncheck the option "No Overlapping Labels." Since Gann levels are mathematically precise, they can sometimes be close together; unchecking this forces TradingView to show every single level simultaneously, just like ThinkOrSwim.

Premarket & PD H/L scannerpremarket scanner for top stock picks
Uses a stock selection of your own choosing that can be adjusted in the script as need be.
Both the premarket low or high is compared and also previous day high or low in order to determine trend and pinpoint which tickers are best suited to trade on a particular day

SR Channel + EMA + RSI MTF + VolHighlight - Edited by MochiSR + Volume + RSI MTF – edited by Mochi
This indicator combines three tools into a single script:
SR Zones from Pivots
Automatically detects clusters of pivot highs/lows and groups them into support and resistance zones.
Zone width is tightened using a percentage of the pivot cluster range so levels are more precise and cleaner.
Each zone includes:
A colored box (SR area),
A dashed midline,
A POC line (price level with the highest traded volume inside the zone),
A label showing the zone price and distance (%) from current price.
Zone color is dynamic but simple and stable:
If price closes below the mid of the zone → it is treated as resistance (red).
If price closes above the mid of the zone → it is treated as support (green).
Box, lines, and label always share the same color.
Volume Inside the Zone + POC
Calculates buy/sell volume for candles whose close lies inside each zone.
Uses abs(buyVol − sellVol) / (buyVol + sellVol) to measure volume imbalance and control box opacity:
Stronger, more one‑sided volume → darker box (stronger zone).
POC is drawn as a thin line with the same color as the zone to highlight the best liquidity level for entries/TP.
Multi‑Timeframe RSI Dashboard
Shows RSI(14) values for multiple timeframes (1m, 5m, 15m, 30m, 1h, 4h, 8h, 1d), each can be toggled on/off.
Background color of each RSI cell:
RSI > 89 → red (strong overbought),
80–89 → orange (warning area),
RSI < 28 → lime (strong oversold),
Otherwise → white (neutral).
The goal of this script is to give traders a clear view of:
Key support/resistance zones,
Their volume quality and POC,
And multi‑TF overbought/oversold conditions via the RSI dashboard – all in one indicator to support retest/flip‑zone trading.

Long Position (Manual Setup)BINANCE:BTCUSDT
This script is for long position setup manually....
Just enter the following data ......
1. higher entry price
2. lower entry price
3. stop loss price
4. targets ( up to 5 targets)
5- extra targets ( up to 3 extra targets)
then you will have the long position draw in the chart with the trade summary including risk and reward percentage.

Mod_Capital-Fibo🔥 Mk_Suhropbek_Fibo — Smart Fibonacci Trading Tool 🔥
Everyone draws Fibonacci.
Only professionals use it correctly.
💎 Mk_Suhropbek_Fibo is an automated Fibonacci indicator that analyzes real market structure and displays only high-probability levels.
📊 How it works:
— Analyzes the last 100 candles
— Automatically detects market trend (BUY / SELL)
— Draws Fibonacci levels in the correct direction
— Clearly marks 0 / 0.236 / 0.382 / 1 / 1.618 (TP)
⏱ Designed for H1 and higher timeframes
✔️ No noisy scalping
✔️ Clean and readable charts
✔️ Suitable for real accounts and prop firms
🔄 Updates only every 25 bars
— Keeps the chart clean
— No constant redrawing
— Focus on quality setups, not quantity
🎯 One setup = a complete trading scenario
— Clear structure
— Logical profit target (1.618)
— No counter-trend trades
📈 Proven market logic
— No overfitting
— Reusable, consistent behavior
— Discipline over emotions
🧠 Who is this indicator for?
✔️ Traders who use Fibonacci seriously
✔️ Those tired of guessing where to draw fib levels
✔️ Traders who treat trading as a business
🚫 No random entries
✅ Clear system
✅ Structured trading
📌 Mk_Suhropbek_Fibo — not prediction, but calculation.

Big Notional Volume Bubbles (Lower-TF Order Flow Approximation)Big Notional Volume Bubbles (Lower-TF Order Flow Approximation)
### Overview
This indicator visualizes large notional trading activity by scanning lower-timeframe candles inside each chart bar and highlighting periods where unusually high traded value (volume × price) occurs.
This script is intended to help short-term traders and scalpers identify bursts of aggressive activity, potential absorption zones, and areas of heightened participation, using standard OHLCV data.
Important: This indicator does not access true market order tape or DOM data. It is an approximation based on lower-timeframe OHLCV data provided by TradingView.
What the Indicator Shows
Each bubble represents a lower-timeframe candle where traded notional value exceeds a user-defined threshold.
Bubble size scales with the notional value of that candle.
Green bubbles indicate the lower-timeframe candle closed higher (buy-side pressure approximation).
Red bubbles indicate the lower-timeframe candle closed lower (sell-side pressure approximation).
Bubbles can be plotted at candle closes or wick extremes for contextual analysis.
How It Works
1. Lower-timeframe OHLCV data is requested using `request.security_lower_tf`.
2. Notional value is calculated as volume × price for each micro-candle.
3. The script selects the largest notional events per bar that exceed the minimum threshold.
4. These events are rendered as bubbles on the main price chart.
Intended Use Cases
Scalping and short-term trading
Momentum ignition and continuation analysis
Absorption and failed breakout detection
Effort versus result analysis
Confirmation at key structural levels
Recommended Settings
Lower timeframe: Start with 1 (1 minute). Seconds-based timeframes may not be supported on all feeds.
Minimum notional (USD/USDT):
BTC / ETH: 25,000 – 250,000
Mid-cap assets: 5,000 – 50,000
Adjust based on liquidity and volatility
Max bubbles per bar: 3–8 to avoid visual clutter
Limitations
This indicator does not display individual market orders or aggressor-side execution.
Buy/sell classification is inferred from candle direction, not bid/ask data.
Lower-timeframe data availability depends on the selected symbol and exchange feed.
This tool should not be used as a standalone signal generator.
Best Practices
Use in conjunction with market structure, VWAP, and key price levels.
Focus on price behavior after a bubble appears rather than the bubble itself.
Interpret bubbles as areas of interest, not directional guarantees.

Volume And ROC Surge DetectorSharing this indicator I made for myself.
Volume and ROC are early indicators of long moves. When ROC + Volume happens together, it's BOOM.
This indicator called, Volume + ROC Surge Detector is a real-time momentum alert indicator designed to spot early institutional activity and explosive price moves. It combines Volume Surge analysis with Price Rate of Change (ROC) to identify when price and participation align.
The script monitors abnormal volume relative to a moving average and confirms direction using ROC strength. When both volume expansion and directional momentum occur together, it triggers high-confidence “Boom” signals for bullish or bearish moves.
To avoid noise, the indicator includes state-based alert control, ensuring each signal fires only once per condition change and only in real-time, not on historical bars.
Key Features
1. Detects bullish and bearish ROC momentum shifts
2. Identifies positive and negative volume anomalies
3. Flags combined Volume + ROC “Boom” events
4. Real-time alerts only (no repaint, no bar-close spam)
5. Duplicate alert prevention using internal state tracking
6. Clean on-chart visual markers for instant recognition. Disable visuals for cleaner chart.
Best Use Cases:
1. Catching breakouts and breakdowns early
2. Spotting smart money participation
3. Momentum confirmation for trend, intraday, and swing trading
4. Works across stocks, crypto, and indices
Alerts:
1. ROC Bullish Alert
When it fires:
Price Rate of Change (ROC) crosses above the positive ROC threshold
Alert messages:
🟢 ROC Change Bullish → TICKER @ price
What it means: Price momentum has turned strongly bullish. Early sign of upside acceleration
2. ROC Bearish Alert
When it fires:
Price ROC crosses below the negative ROC threshold
Alert message:
🔴 ROC Change Bearish → TICKER @ price
What it means:
Price momentum has turned strongly bearish. Early sign of downside acceleration
3. Positive Volume Surge Alert
When it fires:
Current volume exceeds
Average Volume × Volume Surge Multiplier
Alert message:
📈 +Ve Vol Change → TICKER @ volume
What it means:
Unusual participation / smart money activity. Strength entering the move
4. Negative Volume Alert (Volume Dry-Up)
When it fires:
Current volume drops below
Average Volume ÷ Volume Surge Multiplier
Alert message:
📉 -Ve Vol Change → TICKER @ volume
What it means:
Participation is fading. Trend exhaustion or consolidation risk
5. Boom Bull Alert (High-Conviction Signal)
When it fires:
Both conditions occur together:
Bullish ROC AND Volume Surge (high participation)
Alert message:
💥 Boom Volume + ROC Bull → TICKER @ price
What it means: Momentum + volume alignment. Strong breakout / continuation probability
6. Boom Bear Alert (High-Conviction Signal)
When it fires:
Both conditions occur together: Bearish ROC AND Volume Surge (high participation)
Alert message:
💣 Boom Volume + ROC Bear → TICKER @ price
What it means: Momentum + volume alignment to the downside. Strong breakdown / continuation probability
This indicator is built for traders who want clarity, speed, and signal discipline—not lagging confirmations or noisy alerts.

UT Bot Decimal + HA Signals + HA VWAP (Bold White Labels)Custom UT Bot with Built in VWAP and ability to use decimal sensitivity and signals fire off of Heikin Ashi candle

BulletProof Long Wick Reversal Markers with LinesThis custom Pine Script indicator for TradingView identifies and marks potential reversal points on your chart based on long wick candles at swing highs (tops) and lows (bottoms). It focuses on candles where the wick is significantly longer than the body (e.g., shooting stars or hammers) and where the subsequent price reversal exceeds a minimum percentage move. Markers appear as colored circles (green for tops, red for bottoms), with horizontal lines extending from each marker to the current bar for easy reference as support/resistance levels.Key Features and InterpretationMarkers (Dots): Green circles at tops: Indicate a potential bearish reversal where price was pushed down after a long upper wick candle.
Red circles at bottoms: Indicate a potential bullish reversal where price was pushed up after a long lower wick candle.
These only appear if the wick-to-body ratio meets the threshold (default 2.0) and the reversal move is at least the minimum percentage (default 1%).
Lines: Horizontal lines extend from each marker to the current bar (updating in real-time). Use these as dynamic levels—e.g., a green top line might act as resistance, while a red bottom line could be support. Lines do not extend into the future blank space on the chart.
Time Filtering: By default, only markers from the last 7 days are shown to reduce clutter. Set to 0 to display all historical ones.
Best Used On: 1-hour charts as per your request, but it works on any timeframe. It's ideal for spotting reversals in trending markets or confirming entries/exits with other indicators.

6 in 1 SIGNALS
⭐ Indicator Presentation: Keltner + RSI + High Volume + RSI Divergences
Overview
This indicator combines four powerful market‑analysis tools into a single, unified system:
1. Keltner Channel with dual ATR bands (x3 and x5)
2. RSI with dynamic overbought/oversold detection
3. High‑Volume confirmation signals
4. RSI Divergences (Regular & Hidden, Bullish & Bearish)
5. A dynamic information table showing RSI, distance from the Keltner basis, and directional arrows
The goal is to give traders a complete, multi‑layered view of volatility, momentum, exhaustion, and volume pressure — all directly on the main chart.
🎯 1. Keltner Channel System
What it includes
• A customizable moving average (SMA, EMA, WMA, VWMA)
• Two ATR‑based envelopes:
• Band x3 ATR
• Band x5 ATR
• Colored fills between the bands to highlight extreme volatility zones
How to use it
• When price re-enters the channel after being outside, it often signals exhaustion.
• The indicator marks these moments with triangles:
• 🔻 Bearish reversal when price falls back inside from above
• 🔺 Bullish reversal when price rises back inside from below
These signals help identify mean‑reversion opportunities.
🎯 2. RSI System
What it includes
• Standard RSI with adjustable period
• Overbought and oversold levels
• A dynamic color-coded table showing:
• Current RSI value
• Directional arrow (▲ oversold, ▼ overbought, • neutral)
• Distance from the Keltner basis in points and percentage
How to use it
• RSI above the overbought level → potential selling pressure
• RSI below the oversold level → potential buying pressure
• The table updates in real time and gives a quick snapshot of market momentum.
🎯 3. RSI Divergences (Regular & Hidden)
Types of divergences detected
Regular Bullish Divergence
• Price makes a lower low
• RSI makes a higher low
• Suggests weakening bearish momentum
• Marked with a “Bull” label at the price pivot
Hidden Bullish Divergence
• Price makes a higher low
• RSI makes a lower low
• Suggests continuation of an uptrend
• Marked with “H Bull”
Regular Bearish Divergence
• Price makes a higher high
• RSI makes a lower high
• Suggests weakening bullish momentum
• Marked with “Bear”
Hidden Bearish Divergence
• Price makes a lower high
• RSI makes a higher high
• Suggests continuation of a downtrend
• Marked with “H Bear”
How to use divergences
• Divergences appear directly on the price chart, anchored to the pivot candle.
• They help identify trend reversals or trend continuation setups.
• Combining divergences with Keltner signals increases reliability.
🎯 4. High‑Volume Signals
What it includes
• A customizable volume moving average
• A detection system that highlights candles with unusually high volume
• Color-coded arrows:
• 🟢 High volume on bullish candles
• 🔴 High volume on bearish candles
How to use it
• High volume often confirms institutional activity.
• When high volume aligns with:
• A Keltner reversal
• An RSI divergence
• An overbought/oversold condition
…the signal becomes significantly stronger.
🎯 5. Integrated Trading Logic
This indicator is designed to give multi‑confirmation entries:
Strong Buy Conditions
• Price re-enters from below the Keltner band
• RSI oversold
• Bullish divergence
• High volume on a bullish candle
Strong Sell Conditions
• Price re-enters from above the Keltner band
• RSI overbought
• Bearish divergence
• High volume on a bearish candle
You can use any single component alone, but the real power comes from stacking confirmations.
🎯 6. Alerts Included
The indicator includes alerts for:
• All four RSI divergences
• All Keltner reversal signals
• All RSI + Keltner confirmation signals
This allows you to automate monitoring and receive notifications without watching the chart constantly.
⭐ Conclusion
This unified indicator gives traders a complete, multi‑dimensional view of market structure:
• Volatility (Keltner)
• Momentum (RSI)
• Exhaustion (Divergences)
• Volume pressure (High Volume)
• Real‑time analytics (Dynamic table)
It is designed for traders who want clarity, precision, and multiple confirmations in a single tool.
