First Strike ORB Strategy [BlackBelt Futures]My own personal take on the opening range breakout. 2:1RR, 45% win rate. Fully automated. DM for access.Chiến lược Pine Script®của bendasengland1
RSI Strategy with Auto Tuner (PF)# RSI Auto‑Tuner Strategy — How To Use This document explains **how to use** the RSI Auto‑Tuner strategy. It intentionally avoids math and implementation details. Follow this as an operating guide. --- ## 1. What This Tool Is For This strategy helps you: * Discover **which RSI length works best** on a given ticker and timeframe * Measure performance using **Profit Factor (PF)** * Improve RSI performance on noisy markets by **transforming price first** The auto‑tuner is a **research tool**, not a live trading signal generator. --- ## 2. Two Modes You Must Treat Differently ### Research Mode Used to explore and discover parameters. * Auto‑Tune: **ON** * Parameters are allowed to change * Results may look very good * Overfitting risk is real ### Trading Mode Used for forward testing or live trading. * Auto‑Tune: **OFF** * Parameters are fixed * Behavior is stable and repeatable * This is the only acceptable mode for live use **Never trade live with Auto‑Tune enabled.** --- ## 3. Manual Mode (Trading Mode) Use this after parameters are finalized. Steps: 1. Set **Auto‑Tune = OFF** 2. Choose: * Source (raw price or transformed price) * RSI Length (manual, default 14) * Oversold / Overbought levels 3. The strategy will: * Enter long when RSI crosses up through Oversold * Enter short when RSI crosses down through Overbought * Flip positions on opposite signals This mode is predictable and safe for forward testing. --- ## 4. Auto‑Tune Mode (Research Mode) Use this to find optimal RSI lengths. Steps: 1. Set **Auto‑Tune = ON** 2. Configure the search range: * Minimum Length (default 5) * Maximum Length (default 14) * Step Size (default 1) 3. The strategy will: * Internally simulate trades for each RSI length * Track gross profit, gross loss, and trades * Select the length with the highest Profit Factor 4. The best length is applied automatically Auto‑Tune evaluates historical data only. --- ## 5. Using a Transform on Price (Critical) RSI does **not** have to run on raw price. You can significantly improve results by: * Applying a **price transform** first * Feeding the transformed series into the RSI Source input Examples of transforms: * Moving averages * Low‑pass filters * Butterworth filters * Any smoother or denoiser Why this works: * Busy, wicky markets cause RSI to whipsaw * Transforms remove micro‑noise * RSI responds to structure instead of chaos * Profit Factor often increases dramatically Best practice: * Auto‑tune on raw price * Auto‑tune on transformed price * Compare PF, trade count, and stability --- ## 6. Reading the Status Label At the last bar, the on‑chart label shows: * Whether Auto‑Tune is ON or OFF * Whether candidates were built successfully * Number of RSI lengths tested * Best RSI length found * Profit Factor and trade count If Auto‑Tune is OFF, the label shows the manual length. --- ## 7. Recommended Workflow 1. Choose ticker and timeframe 2. Enable Auto‑Tune on **raw price** 3. Record best RSI length and PF 4. Enable Auto‑Tune on **transformed price** 5. Compare results 6. Lock parameters 7. Disable Auto‑Tune 8. Forward test --- ## 8. Warnings and Discipline * High PF with few trades is unreliable * Transforms can hide execution costs * Always validate on a different period * Auto‑Tune is a **lens**, not an edge Treat this tool as a research microscope, not an autopilot. Chiến lược Pine Script®của AJSwogger115
Prop ES EMA Cross during Single/Dual Trading SessionEMA crossover strategy for ES futures optimized for prop firm rules. Choose long-only, short-only, or both directions. Customizable short and long EMA lengths. Enter trades during one or two configurable sessions specified in New York time. Fixed TP/SL in ticks with forced close by 4:59 PM NY time. Chiến lược Pine Script®của LimYX17
EMA 1 & SALMA Intersection StrategyTrading Strategy: EMA 1 & SALMA Crossover System This strategy is a Trend-Following system that focuses on the direct interaction between the price (represented by EMA 1) and a smoothed trendline (SALMA). Instead of relying on the color changes of the indicator, it uses mechanical crossover signals to enter and exit trades. 1. Indicators Used EMA 1 (Exponential Moving Average): Since the period is 1, it effectively represents the Current Price. It reacts instantly to every market move. SALMA v3.0 (Smoothed Adaptive Lattice Moving Average): A double-smoothed moving average that acts as the "Base Line" or "Trend Support/Resistance." RSI (Relative Strength Index): Used as a Momentum Filter to ensure we don't trade against the market's strength. 2. Buy (Long) Entry Rules You enter a Long position when the following conditions are met: The Crossover: The EMA 1 (Price) crosses ABOVE the SALMA line. This indicates that the short-term momentum is shifting higher than the average trend. The Filter (RSI): The RSI must be above 50. This confirms that the buyers are in control and the upward move has enough strength. 3. Sell (Short) Entry Rules You enter a Short position when the following conditions are met: The Crossunder: The EMA 1 (Price) crosses BELOW the SALMA line. This indicates a breakdown in price action. The Filter (RSI): The RSI must be below 50. This confirms that the sellers are dominating and the downward momentum is real. 4. Key Advantages of This System Objectivity: You don't guess based on the color of the line; you wait for a clear physical break (cross) of the line. Precision: By using EMA 1, you get the earliest possible entry signal compared to slower moving averages. False Signal Protection: The RSI 50 filter prevents you from entering "weak" trades where the price crosses the line but lacks the volume or momentum to continue.Chiến lược Pine Script®của Oguzbey0721
Adoptive Conditional range High/Low MA Crossover StrategyDeveloped from the doctoral research of Abu-Kadunagra at ****** University's in Australia, this strategy implements a "Campaign-Based Adaptive Execution" framework. It moves beyond simple entries and exits by treating each market engagement as a multi-phase campaign with distinct operational states. The system intelligently identifies cyclical turning points, then employs a feedback-driven approach to capital allocation—reinforcing successful momentum with pyramiding while deploying controlled defensive averaging during temporary setbacks. By anchoring its exit mechanism to dynamically updated market structure rather than static profit targets, the algorithm seeks to capture cyclical momentum while maintaining disciplined risk parameters. This research-driven approach represents an evolution toward state-aware algorithmic systems that adapt their tactics in real-time based on market phase recognition.Chiến lược Pine Script®của kadunagra3
Conditional-range High/Low adoptive-MA Crossover StrategyDeveloped from the doctoral research of Abu-Kadunagra at ****** University on topic of Digital Finance and Crypto in Australia, this strategy implements a "Campaign-Based Adaptive Execution" framework. It moves beyond simple entries and exits by treating each market engagement as a multi-phase campaign with distinct operational states. The system intelligently identifies cyclical turning points, then employs a feedback-driven approach to capital allocation—reinforcing successful momentum with pyramiding while deploying controlled defensive averaging during temporary setbacks. By anchoring its exit mechanism to dynamically updated market structure rather than static profit targets, the algorithm seeks to capture cyclical momentum while maintaining disciplined risk parameters. This research-driven approach represents an evolution toward state-aware algorithmic systems that adapt their tactics in real-time based on market phase recognition.Chiến lược Pine Script®của kadunagra2
VuManChu Strategy [ADX + Vol + Risk] - Good for BTC- The strategy uses the VuManChu WaveTrend oscillator - Before entering any trade, the ADX filter must show a reading above 25. For more reliable momentum moves - Three-Layer Exit System: Fixed Stop Loss (3%): Hard stop placed 3% below entry for longs (above for shorts) to limit maximum loss per trade. This accommodates typical BTC 5-minute volatility without premature stopouts. Take Profit Target (9%): Fixed profit target at 9% providing a 1:3 risk-reward ratio. This means you only need a 40-50% win rate to be profitable overall. Conditional Trailing Stop: The most sophisticated protection - a trailing stop that only activates after the trade reaches 4.5% profit (halfway to target). Once activated, it trails price by 2%, locking in gains while still allowing the trade to reach the full 9% target. Chiến lược Pine Script®của eventsloopedCập nhật 16
KSE-100 PSX Long Strategy by KadunagraDeveloped from a academic part of the doctoral research of Kadunagra on digital finance and automation at **** University in Australia, this strategy implements a "Campaign-Based Adaptive Execution" framework. It moves beyond simple entries and exits by treating each market engagement as a multi-phase campaign with distinct operational states. The system intelligently identifies cyclical turning points, then employs a feedback-driven approach to capital allocation—reinforcing successful momentum with pyramiding while deploying controlled defensive averaging during temporary setbacks. By anchoring its exit mechanism to dynamically updated market structure rather than static profit targets, the algorithm seeks to capture cyclical momentum while maintaining disciplined risk parameters. This research-driven approach represents an evolution toward state-aware algorithmic systems that adapt their tactics in real-time based on market phase recognition.Chiến lược Pine Script®của kadunagra5
OCC Strategy Optimized (MA 5 + Delayed TSL)# OCC Strategy Optimized (MA 5 + Delayed TSL) - User Guide ## Introduction The **OCC Strategy Optimized** is an enhanced version of the classic **Open Close Cross (OCC)** strategy. This strategy is designed for high-precision trend following, utilizing the crossover logic of Open and Close moving averages to identify market shifts. This optimized version incorporates advanced risk management, multi-timeframe analysis, and a variety of moving average types to provide a robust trading solution for modern markets. > > **Special Thanks:** This strategy is based on the original work of **JustUncleL**, a renowned Pine Script developer. You can find their work and profile on TradingView here: (in.tradingview.com). --- ## Key Features ### 1. Optimized Core Logic - **MA Period (Default: 5):** The strategy is tuned with a shorter MA length to reduce lag and capture trends earlier. - **Crossing Logic:** Signals are generated when the Moving Average of the **Close** crosses the Moving Average of the **Open**. ### 2. Multi-Timeframe (MTF) Analysis - **Alternate Resolution:** Use a higher timeframe (Resolution Multiplier) to filter out noise. By default, it uses $3 \times$ your current chart timeframe to confirm the trend. - **Non-Repainting:** Includes an optional delay offset to ensure signals are confirmed and do not disappear (repaint) after the bar closes. ### 3. Advanced Risk Management This script features a hierarchical exit system to protect your capital and lock in profits: - **Fixed Stop Loss (Initial):** Protects against sudden market reversals immediately after entry. - **Delayed Trailing Stop Loss (TSL):** - **Activation Delay:** The TSL only activates after the trade reaches a specific profit threshold (e.g., 1%). This prevents being stopped out too early in the trade's development. - **Ratchet Trail:** Once activated, the stop loss "ratchets" up/down, never moving backward, ensuring you lock in profits as the trend continues. - **Take Profit (TP):** A fixed percentage target to exit the trade at a pre-defined profit level. ### 4. Versatility - **12 MA Types:** Choose from SMA, EMA, DEMA, TEMA, WMA, VWMA, SMMA, HullMA, LSMA, ALMA, SSMA, and TMA. - **Trade Direction:** Toggle between Long-only, Short-only, or Both. - **Visuals:** Optional bar coloring to visualize the trend directly on the candlesticks. --- ## User Input Guide ### Core Settings - **Use Alternate Resolution?:** Enable this to use the MTF logic. - **Multiplier for Alternate Resolution:** How many charts higher the "filter" timeframe should be. - **MA Type:** Select your preferred moving average smoothing method. - **MA Period:** The length of the Open/Close averages. - **Delay Open/Close MA:** Use `1` or higher to force non-repainting behavior. ### Risk Management Settings - **Use Trailing Stop Loss?:** Enables the TSL system. - **Trailing Stop %:** The distance the stop follows behind the price (Optimized Default: 1.5%). - **TSL Activation % (Delay):** The profit % required before the TSL starts moving. (Optimized Default: 2.0% to ensure 0.5% profit is locked immediately). - **Initial Fixed Stop Loss %:** Your hard stop if the trade immediately goes against you. - **Take Profit %:** Your ultimate profit target for the trade. --- ## How to Trade with This Strategy 1. **Identify the Trend:** Look for the Moving Average lines (Close vs Open) to cross. 2. **Wait for Confirmation:** If using MTF, ensure the higher timeframe also shows a trend change. 3. **Manage the Trade:** Let the TSL work. With the default **2.0% Activation** and **1.5% Trail**, the strategy will automatically lock in **0.5% profit** the moment the threshold is hit, then follow the price higher. 4. **Position Sizing:** Adjust the `Properties` tab in the script settings to match your desired capital allocation (Default is 10% of equity). --- ## Recommended Settings 1. Trialing < Activation 2. Check ranging ## Credits Original Strategy by: **JustUncleL** Optimized and Enhanced by: **Antigravity AI** Chiến lược Pine Script®của trade_crushCập nhật 5596
Butterworth LPF Flip + AutoTune (PF)Butterworth LPF Flip + AutoTune (PF) This strategy trades price trend flips using two Butterworth low-pass filters (a FAST filter and a SLOW filter). A trade is taken when the FAST filter crosses the SLOW filter. Optionally, the script can auto-tune the filter lengths by simulating many Fast/Slow combinations and selecting the pair with the best Profit Factor (PF). What the Script Does - Computes two 2‑pole Butterworth low‑pass filters on price. - Enters LONG when FAST crosses above SLOW. - Enters SHORT when FAST crosses below SLOW. - Optionally simulates many Fast/Slow length combinations internally. - Chooses the Fast/Slow pair with the highest Profit Factor. - Trades only the selected best pair. Manual Mode (Default) 1. Leave Auto‑Tune OFF. 2. Set: - FAST cutoff period (bars) - SLOW cutoff period (bars) 3. The strategy will trade using only these values. Use this mode for normal trading or live deployment. Auto‑Tune Mode 1. Enable Auto‑Tune. 2. Define Fast and Slow ranges: - FAST min / max / step - SLOW min / max / step 3. The script simulates ALL Fast × Slow combinations bar‑by‑bar. 4. Each combination tracks: - Gross Profit - Gross Loss - Closed trades - Profit Factor (PF = GP / GL) 5. At the end of the chart, the best PF pair is selected and used for trading. Interpreting the End Box The status label at the end of the chart reports: - Whether Auto‑Tune is enabled - Number of candidate pairs tested - Best FAST period - Best SLOW period - Profit Factor of the best pair - Win Rate (wins ÷ closed trades) If PF is near 1.0 or trades are very low, expand the range or length of the test. Best Practices - Use Auto‑Tune ONLY for research and optimization. - After finding good parameters, disable Auto‑Tune and trade manually. - Keep Fast < Slow (logical separation). - Longer charts produce more reliable PF results. - Avoid very small step sizes (performance + noise). Known Limitations - Pine Script runs bar‑by‑bar; tuning is approximate, not vectorized. - Large grids increase execution time. - Results are historical and NOT predictive. - Not suitable for live auto‑optimization. Summary This script is best viewed as a *research tool first, strategy second*. Use it to discover stable Fast/Slow regimes, then lock them in for simple, repeatable trading. Chiến lược Pine Script®của AJSwogger3
WaveTrend Strategy [Long + Flex Exit]wavetrend strategy enter long when oversold. close position when profit reaches certain value or overboughtChiến lược Pine Script®của yinghe_scarlettCập nhật 3
ES Multi-Timeframe SMC Entry SystemOverviewThis is a comprehensive Smart Money Concepts (SMC) trading strategy for ES1! (E-mini S&P 500) futures that provides simultaneous buy and sell signals across three timeframes: Daily, Weekly, and Monthly. It incorporates your complete entry checklists, confluence scoring system, and automated risk management.Core Features1. Multi-Timeframe Signal Generation Daily Signals (D) - For intraday/swing trades (1-3 day holds) Weekly Signals (W) - For swing trades (3-10 day holds) Monthly Signals (M) - For position trades (weeks to months) All three timeframes can trigger simultaneously (pyramiding enabled) 2. Smart Money Concepts ImplementationOrder Blocks (OB) Automatically detects bullish and bearish order blocks Bullish OB = Down candle before strong impulse up Bearish OB = Up candle before strong impulse down Validates freshness (< 10 bars = higher quality) Visual boxes displayed on chart Fair Value Gaps (FVG) Identifies 3-candle imbalance patterns Bullish FVG = Gap between high and current low Bearish FVG = Gap between low and current high Tracks unfilled gaps as targets/entry zones Auto-removes when filled Premium/Discount Zones Calculates 50-period swing range Premium = Upper 50% (short from here) Discount = Lower 50% (long from here) Deep zones (<30% or >70%) for higher quality setups Visual shading: Red = Premium, Green = Discount Liquidity Sweeps Sell-Side Sweep (SSL) = False break below lows → reversal up Buy-Side Sweep (BSL) = False break above highs → reversal down Marked with yellow labels on chart Valid for 10 bars after occurrence Break of Structure (BOS) Identifies when price breaks recent swing high/low Confirms trend continuation Marked with small circles on chart 3. Confluence Scoring SystemEach timeframe has a 10-point scoring system based on your checklist requirements:Daily Score (10 points max) HTF Trend Alignment (2 pts) - 4H and Daily EMAs aligned SMC Structure (2 pts) - OB in correct zone with HTF bias Liquidity Sweep (1 pt) - Recent SSL/BSL occurred Volume Confirmation (1 pt) - Volume > 1.2x 20-period average Optimal Time (1 pt) - 9:30-12 PM or 2-4 PM ET (avoids lunch) Risk-Reward >2:1 (1 pt) - Built into exit strategy Clean Price Action (1 pt) - BOS occurred FVG Present (1 pt) - Near unfilled fair value gap Minimum Required: 6/10 (adjustable)Weekly Score (10 points max) Weekly/Monthly Alignment (2 pts) - W and M EMAs aligned Daily/Weekly Alignment (2 pts) - D and W trends match Premium/Discount Correct (2 pts) - Deep zone + trend alignment Major Liquidity Event (1 pt) - SSL/BSL sweep Order Block Present (1 pt) - Valid OB detected Risk-Reward >3:1 (1 pt) - Built into exit Fresh Order Block (1 pt) - OB < 10 bars old Minimum Required: 7/10 (adjustable)Monthly Score (10 points max) Monthly/Weekly Alignment (2 pts) - M and W trends match Weekly OB in Monthly Zone (2 pts) - OB in deep discount/premium Major Liquidity Sweep (2 pts) - Significant SSL/BSL Strong Trend Alignment (2 pts) - D, W, M all aligned Risk-Reward >4:1 (1 pt) - Built into exit Extreme Zone (1 pt) - Price <20% or >80% of range Minimum Required: 8/10 (adjustable)4. Entry ConditionsDaily Long Entry ✅ Daily score ≥ 6/10 ✅ 4H trend bullish (price > EMAs) ✅ Price in discount zone ✅ Bullish OB OR SSL sweep OR near bullish FVG ✅ NOT during avoid times (lunch/first 5 min)Daily Short Entry ✅ Daily score ≥ 6/10 ✅ 4H trend bearish ✅ Price in premium zone ✅ Bearish OB OR BSL sweep OR near bearish FVG ✅ NOT during avoid timesWeekly Long Entry ✅ Weekly score ≥ 7/10 ✅ Weekly trend bullish ✅ Daily trend bullish ✅ Price in discount ✅ Bullish OB OR SSL sweepWeekly Short Entry ✅ Weekly score ≥ 7/10 ✅ Weekly trend bearish ✅ Daily trend bearish ✅ Price in premium ✅ Bearish OB OR BSL sweepMonthly Long Entry ✅ Monthly score ≥ 8/10 ✅ Monthly trend bullish ✅ Weekly trend bullish ✅ Price in DEEP discount (<30%) ✅ Bullish order block presentMonthly Short Entry ✅ Monthly score ≥ 8/10 ✅ Monthly trend bearish ✅ Weekly trend bearish ✅ Price in DEEP premium (>70%) ✅ Bearish order block present5. Automated Risk ManagementPosition Sizing (Per Entry) Daily: 1.0% account risk per trade Weekly: 0.75% account risk per trade Monthly: 0.5% account risk per trade Formula: Contracts = (Account Equity × Risk%) ÷ (Stop Points × $50) Minimum = 1 contractStop Losses Daily: 12 points ($600 per contract) Weekly: 40 points ($2,000 per contract) Monthly: 100 points ($5,000 per contract) Profit Targets (Risk:Reward) Daily: 2:1 = 24 points ($1,200 profit) Weekly: 3:1 = 120 points ($6,000 profit) Monthly: 4:1 = 400 points ($20,000 profit) Example with $50,000 AccountDaily Trade: Risk = $500 (1% of $50k) Stop = 12 points × $50 = $600 Contracts = $500 ÷ $600 = 0.83 → 1 contract Target = 24 points = $1,200 profit Weekly Trade: Risk = $375 (0.75% of $50k) Stop = 40 points × $50 = $2,000 Contracts = $375 ÷ $2,000 = 0.18 → 1 contract Target = 120 points = $6,000 profit Monthly Trade: Risk = $250 (0.5% of $50k) Stop = 100 points × $50 = $5,000 Contracts = $250 ÷ $5,000 = 0.05 → 1 contract Target = 400 points = $20,000 profit 6. Visual Elements on ChartKey Levels Previous Daily High/Low - Red/Green solid lines Previous Weekly High/Low - Red/Green circles Previous Monthly High/Low - Red/Green crosses Equilibrium Line - White dotted line (50% of range) Zones Premium Zone - Light red shading (upper 50%) Discount Zone - Light green shading (lower 50%) SMC Markings Bullish Order Blocks - Green boxes with "Bull OB" label Bearish Order Blocks - Red boxes with "Bear OB" label Bullish FVGs - Green boxes with "FVG↑" Bearish FVGs - Red boxes with "FVG↓" Liquidity Sweeps - Yellow "SSL" (down) or "BSL" (up) labels Break of Structure - Small lime/red circles Entry Signals Daily Long - Small lime triangle ▲ with "D" below price Daily Short - Small red triangle ▼ with "D" above price Weekly Long - Medium green triangle ▲ with "W" below price Weekly Short - Medium maroon triangle ▼ with "W" above price Monthly Long - Large aqua triangle ▲ with "M" below price Monthly Short - Large fuchsia triangle ▼ with "M" above price 7. Information TablesConfluence Score Table (Top Right) ┌──────────┬────────┬────────┬────────┐ │ TF │ SCORE │ STATUS │ SIGNAL │ ├──────────┼────────┼────────┼────────┤ │ 📊 DAILY │ 7/10 │ ✓ PASS │ 🔼 │ │ 📈 WEEKLY│ 6/10 │ ✗ WAIT │ ━ │ │ 🌙 MONTH │ 9/10 │ ✓ PASS │ 🔽 │ ├──────────┴────────┴────────┴────────┤ │ P&L: $2,450 │ └─────────────────────────────────────┘ Green scores = Pass (meets minimum threshold) Orange/Red scores = Fail (wait for better setup) 🔼 = Long signal active 🔽 = Short signal active ━ = No signal Entry Checklist Table (Bottom Right) ┌──────────────┬───┐ │ CHECKLIST │ ✓ │ ├──────────────┼───┤ │ ━ DAILY ━ │ │ │ HTF Trend │ ✓ │ │ Zone │ ✓ │ │ OB │ ✗ │ │ Liq Sweep │ ✓ │ │ Volume │ ✓ │ │ ━ WEEKLY ━ │ │ │ W/M Align │ ✓ │ │ Deep Zone │ ✗ │ │ ━ MONTHLY ━ │ │ │ M/W/D Align │ ✓ │ │ Zone: Discount│ │ └──────────────┴───┘ Green ✓ = Condition met Red ✗ = Condition not met Real-time updates as market conditions change 8. Alert SystemIndividual Alerts: "Daily Long" - Triggers when daily long setup appears "Daily Short" - Triggers when daily short setup appears "Weekly Long" - Triggers when weekly long setup appears "Weekly Short" - Triggers when weekly short setup appears "Monthly Long" - Triggers when monthly long setup appears "Monthly Short" - Triggers when monthly short setup appears Combined Alerts: "Any Long Signal" - Catches any bullish opportunity (D/W/M) "Any Short Signal" - Catches any bearish opportunity (D/W/M) Alert Messages Include: 🔼/🔽 Direction indicator Timeframe (DAILY/WEEKLY/MONTHLY) Current confluence scoreChiến lược Pine Script®của Prototype111125
Liquidity Maxing [JOAT]Liquidity Maxing - Institutional Liquidity Matrix Introduction Liquidity Maxing is an open-source strategy for TradingView built around institutional market structure concepts. It identifies structural shifts, evaluates trades through multi-factor confluence, and implements layered risk controls. The strategy is designed for swing trading on 4-hour timeframes, focusing on how institutional order flow manifests in price action through structure breaks, inducements, and liquidity sweeps. Core Functionality Liquidity Maxing performs three primary functions: Tracks market structure to identify when control shifts between buyers and sellers Scores potential trades using an eight-factor confluence system Manages position sizing and risk exposure dynamically based on volatility and user-defined limits The goal is selective trading when multiple conditions align, rather than frequent entries. Market Structure Engine The structure engine tracks three key events: Break of Structure (BOS): Price pushes beyond a prior pivot in the direction of trend Change of Character (CHoCH): Control flips from bullish to bearish or vice versa Inducement Sweeps (IDM): Market briefly runs stops against trend before moving in the real direction The structure module continuously updates strong highs and lows, labeling structural shifts visually. IDM markers are optional and disabled by default to maintain chart clarity. The trade engine requires valid structure alignment before considering entries. No structure, no trade. Eight-Factor Confluence System Instead of relying on a single indicator, Liquidity Maxing uses an eight-factor scoring system: Structure alignment with current trend RSI within healthy bands (different ranges for up and down trends) MACD momentum agreement with direction Volume above adaptive baseline Price relative to main trend EMA Session and weekend filter (configurable) Volatility expansion/contraction via ATR shifts Higher-timeframe EMA confirmation Each factor contributes one point to the confluence score. The default minimum confluence threshold is 6 out of 8, but you can adjust this from 1-8 based on your preference for trade frequency versus selectivity. Only when structure and confluence agree does the strategy proceed to risk evaluation. Dynamic Risk Management Risk controls are implemented in multiple layers: ATR-based stops and targets with configurable risk-to-reward ratio (default 2:1) Volatility-adjusted position sizing to maintain consistent risk per trade as ranges expand or compress Daily and weekly risk budgets that halt new entries once thresholds are reached Correlation cooldown to prevent clustered trades in the same direction Global circuit breaker with maximum drawdown limit and emergency kill switch If any guardrail is breached, the strategy will not open new positions. The dashboard clearly displays risk state for transparency. Market Presets The strategy includes configuration presets optimized for different market types: Crypto (BTC/ETH): RSI bands 70/30, volume multiplier 1.2, enhanced ATR scaling Forex Majors: RSI bands 75/25, volume multiplier 1.5 Indices (SPY/QQQ): RSI bands 70/30, volume multiplier 1.3 Custom: Default values for user customization For crypto assets, the strategy automatically applies ATR volatility scaling to account for higher volatility characteristics. Monitoring and Dashboards The strategy includes optional monitoring layers: Risk Operations Dashboard (top-right): Trend state Confluence score ATR value Current position size percentage Global drawdown Daily and weekly risk consumption Correlation guard state Alert mode status Performance Console (top-left): Net profit Current equity Win rate percentage Average trade value Sharpe-style ratio (rolling 50-bar window) Profit factor Open trade count Optional risk tint on chart background provides visual indication of "safe to trade" versus "halted" state. All visualization elements can be toggled on/off from the inputs for clean chart viewing or full telemetry during parameter tuning. Alerts and Automation The strategy supports alert integration with two formats: Standard alerts: Human-readable messages for long, short, and risk-halt conditions Webhook format: JSON-formatted payloads ready for external execution systems (optional) Alert messages are predictable and unambiguous, suitable for manual review or automated forwarding to execution engines. Built-in Validation Suite The strategy includes an optional validation layer that can be enabled from inputs. It checks: Internal consistency of structure and confluence metrics Sanity and ordering of risk parameters Position sizing compliance with user-defined floors and caps This validation is optional and not required for trading, but provides transparency into system operation during development or troubleshooting. Strategy Parameters Market Presets: Configuration Preset: Choose between Crypto (BTC/ETH), Forex Majors, Indices (SPY/QQQ), or Custom Market Structure Architecture: Pivot Length: Default 5 bars Filter by Inducement (IDM): Default enabled Visualize Structure: Default enabled Structure Lookback: Default 50 bars Risk & Capital Preservation: Risk:Reward Ratio: Default 2.0 ATR Period: Default 14 ATR Multiplier (Stop): Default 2.0 Max Drawdown Circuit Breaker: Default 10% Risk per Trade (% Equity): Default 1.5% Daily Risk Limit: Default 6% Weekly Risk Limit: Default 12% Min Position Size (% Equity): Default 0.25% Max Position Size (% Equity): Default 5% Correlation Cooldown (bars): Default 3 Emergency Kill Switch: Default disabled Signal Confluence: RSI Length: Default 14 Trend EMA: Default 200 HTF Confirmation TF: Default Daily Allow Weekend Trading: Default enabled Minimum Confluence Score (0-8): Default 6 Backtesting Considerations When backtesting this strategy, consider the following: Commission: Default 0.05% (adjustable in strategy settings) Initial Capital: Default $100,000 (adjustable) Position Sizing: Uses percentage of equity (default 2% per trade) Timeframe: Optimized for 4-hour charts, though can be tested on other timeframes Results will vary significantly based on: Market conditions and volatility regimes Parameter settings, especially confluence threshold Risk limit configuration Symbol characteristics (crypto vs forex vs equities) Past performance does not guarantee future results. Win rate, profit factor, and other metrics should be evaluated in context of drawdown periods, trade frequency, and market conditions. How to Use This Strategy This is a framework that requires understanding and parameter tuning, not a one-size-fits-all solution. Recommended workflow: Start on 4-hour timeframe with default parameters and appropriate market preset Run backtests and study performance console metrics: focus on drawdown behavior, win rate, profit factor, and trade frequency Adjust confluence threshold to match your risk appetite—higher thresholds mean fewer but more selective trades Set realistic daily and weekly risk budgets appropriate for your account size and risk tolerance Consider ATR multiplier adjustments based on market volatility characteristics Only connect alerts or automation after thorough testing and parameter validation Treat this as a risk framework with an integrated entry engine, not merely an entry signal generator. The risk controls are as important as the trade signals. Strategy Limitations Designed for swing trading timeframes; may not perform optimally on very short timeframes Requires sufficient market structure to identify pivots; may struggle in choppy or low-volatility environments Crypto markets require different parameter tuning than traditional markets Risk limits may prevent entries during favorable setups if daily/weekly budgets are exhausted Correlation cooldown may delay entries that would otherwise be valid Backtesting results depend on data quality and may not reflect live trading with slippage Design Philosophy Many indicators tell you when price crossed a moving average or RSI left oversold. This strategy addresses questions institutional traders ask: Who is in control of the market right now? Is this move structurally significant or just noise? Do I want to add more risk given what I've already done today/week? If I'm wrong, exactly how painful can this be? The strategy provides disciplined, repeatable answers to these questions through systematic structure analysis, confluence filtering, and multi-layer risk management. Technical Implementation The strategy uses Pine Script v6 with: Custom types for structure, confluence, and risk state management Functional programming approach for reusable calculations State management through persistent variables Optional visual elements that can be toggled independently The code is open-source and can be modified to suit individual needs. All important logic is visible in the source code. Disclaimer This script is provided for educational and informational purposes only. It is not intended as financial, investment, trading, or any other type of advice or recommendation. Trading involves substantial risk of loss and is not suitable for all investors. Past performance, whether real or indicated by historical tests of strategies, is not indicative of future results. No representation is being made that any account will or is likely to achieve profits or losses similar to those shown. In fact, there are frequently sharp differences between backtested results and actual results subsequently achieved by any particular trading strategy. The user should be aware of the risks involved in trading and should trade only with risk capital. The authors and publishers of this script are not responsible for any losses or damages, including without limitation, any loss of profit, which may arise directly or indirectly from use of or reliance on this script. This strategy uses technical analysis methods and indicators that are not guaranteed to be accurate or profitable. Market conditions change, and strategies that worked in the past may not work in the future. Users should thoroughly test any strategy in a paper trading environment before risking real capital. Commission and slippage settings in backtests may not accurately reflect live trading conditions. Real trading results will vary based on execution quality, market liquidity, and other factors not captured in backtesting. The user assumes full responsibility for all trading decisions made using this script. Always consult with a qualified financial advisor before making investment decisions. Enjoy - officialjackofalltradesChiến lược Pine Script®của officialjackofalltrades364
Heikin Ashi Wick Strategy 🔥 Heikin Ashi Wick Momentum Strategy “Trade momentum decay before the trend breaks. >> FOCUS ON WICKS, NOT ONLY CANDLE COLOR<< What Makes This Different (Traffic Driver) ✔ Uses Heikin Ashi wicks (almost nobody does this correctly) ✔ Captures trend continuation, not breakouts ✔ Exits before momentum collapse, not after ✔ Non-repainting ✔ Clean charts, instant readability This Strategy Is REALLY Trading This is a Heikin Ashi momentum-decay system: • Enters when trend is strong but not euphoric • Exits when: o Trend stops probing higher o Sellers gain relative strength It avoids: • Chasing strong breakout candles • Holding through momentum rollovers Candle Type Used: Heikin Ashi (manually calculated) NOTE: The script does not use regular candles. It reconstructs Heikin Ashi (HA) candles from raw OHLC: • HA Close = average of open, high, low, close • HA Open = midpoint of prior HA candle (smoothed) • HA High / Low = extremes of HA open/close vs real high/low ➡️ This filters noise and emphasizes trend structure and momentum. Strengths ✅ Works well in strong, smooth trends ✅ Very clean logic (no indicators) ✅ Non-repainting ✅ Early exits protect capital Best Use This works best on: • Daily timeframe • Strong trend ETFs / megacaps o QQQ o SPY o NVDA, MSFT, AAPL • When combined with: o EMA 21 trend filter (your preference) o Market regime filter (e.g., above 50/200 SMA) o Rising 10 EMA and 20 EMA ________________________________________ 8️⃣ Weaknesses (Important) ⚠️ No stop loss (only structure-based exits) ⚠️ Can exit too early in explosive trends ⚠️ Will chop in sideways markets ⚠️ No volatility filter (ATR, EMA, regime) How to Avoid the Weaknesses — Summary Turn the setup from a concept into a robust strategy by adding these controls: 1. Trade Only Trends o Require price above EMA-21 (optionally EMA-21 > EMA-50) o Eliminates chop and sideways markets 2. Improve Exits (Avoid Leaving Winners Too Early) o Partial exit when upper wick disappears o Full exit only when lower wick dominates o Optional: require 2 consecutive exit candles 3. Add Risk Protection o Use a volatility stop: ~1.5× ATR(14) below entry or below HA swing low o Protects against gaps and sudden reversals 4. Filter Weak Signals o Require meaningful wick size (≈30–40% of candle range) o Avoids low-quality indecision candles 5. Avoid Bad Volatility o Skip entries when ATR is expanding aggressively o Focus on calmer, controllable trends 6. Limit Time in Trade o Add a max bars hold (e.g., 10–15 bars on daily) o Prevents capital getting stuck in fading trends ⚠️ Educational use only. Not financial advice. Trading involves risk and losses can exceed expectations. Past performance does not guarantee future results. Use at your own risk. Chiến lược Pine Script®của TrendRiderPro612
Infinity Algo Backtest█ OVERVIEW Infinity Algo Backtest is a strategy testing system with 5 entry modes, 6 take-profit levels, and optional Auto-Tune optimization (historical simulation). Switch between trend-following, contrarian, and sniper entries within one strategy. Auto-Tune runs historical simulations across hundreds of parameter combinations and selects the best-scoring configuration based on your chosen metric (not predictive AI). Includes trailing stop-loss options, optional add-on entries (pyramiding), and structured alert messages for automation. █ KEY FEATURES ✅ 5 Entry Modes: Normal, Smart, AI, HL Sniper, AI Sniper ✅ 3 Exit Modes: Percentage targets, Signal step-outs, Opposite signal flip ✅ 6 Take-Profit Levels with customizable partial position sizing ✅ Trailing Stop-Loss (None / Breakeven / Moving Target) ✅ Auto-Tune Optimization (Walk-Forward or Static) ✅ Optional add-on entries (pyramiding) ✅ Structured alert messages for webhook automation ✅ Designed for crypto, forex, stocks, indices, and commodities █ WHAT MAKES THIS STRATEGY DIFFERENT 🧠 Auto-Tune Engine Unlike static strategies, this system tests 500+ parameter combinations — varying sensitivity (5-28), thresholds, and trigger configs — then selects the best-scoring settings from historical simulations. Choose from 12 scoring metrics: Sharpe Ratio, Sortino Ratio, Calmar Ratio, SQN, Martin Ratio, GPR, Win Rate, Total Profit, Average Profit, Profit Factor, Sortino + Calmar Composite, and Robust Score. Note: Auto-Tune is systematic parameter optimization on historical data — not predictive AI. Past performance does not guarantee future results. 🎯 Multi-Mode Entry System Switch between trend-following, contrarian, and sniper modes — all within one strategy. No need to maintain multiple scripts. 🛡️ Adaptive Risk Management Trailing SL modes that respond to your TP hits: Breakeven: Locks in safety after your chosen TP is reached Moving Target: Ratchets your stop to the previous TP level as profit grows 📊 Reproducible Results Full transparency on strategy properties so you can replicate exact backtest conditions. █ ENTRY ENGINES Normal + Smart (Default) Normal: Contrarian entries — momentum cross against the trend filter for reversal plays Smart: Trend-following entries — momentum cross with the trend filter for continuation plays Auto-Tune Mode Tests 500+ parameter combinations against historical data Simulates trades internally using your TP/SL configuration Scores by your chosen metric (Sharpe, Sortino, Calmar, Win Rate, etc.) Walk-Forward: Re-optimizes every N bars to adapt to regime changes Static: Locks in best-scoring settings from full available history HL Sniper Trend-trigger mode for more selective entries Fewer signals, but more selective setups Auto-Tune Sniper Optimizes RSI period, smoothing factor, and trigger sensitivity Adapts sniper configuration based on historical performance █ EXIT MODES 1) Percentage Targets Up to 6 TP levels (TP1…TP6) with customizable partial exits Configure both price distance (%) and position size (%) for each level Designed for scaling out rather than all-in/all-out 2) Signal Step-Outs Momentum-shift condition triggers partial exits Optional higher-timeframe confirmation "New TP Must Beat Last" prevents weak consecutive exits 3) Opposite Signal Closes/flips position when the next opposite entry signal appears Best for trend-following systems █ USE CASES 📈 Trending Markets Use "Smart" signals + Percentage TPs. Stay aligned with momentum while scaling out at multiple targets. Enable Moving Target trailing to lock in profits. 📉 Ranging / Choppy Markets Use "Normal" signals (contrarian mode). Catch reversals at range boundaries. Tighter TP targets work better here. ⚡ High Volatility / News Events Use "HL Sniper" for selective entries. Fewer signals, more selective. Wider SL to accommodate volatility. 🤖 Automation & Bots Structured alert payloads work with popular bot platforms and custom webhooks. Entry + 6 TPs + SL in one alert. █ HOW TO USE Apply to your chart (any timeframe, any market) Start with Entry Signals = "Normal + Smart", Exit Mode = "Percentage" Pick your direction (Long / Short / Both) Adjust signal thresholds and trend filter length to match your style Configure TP% levels and Qty% — total should sum to 100% Enable Stop-Loss and choose a trailing mode Set commission and slippage in Strategy Properties for realistic results Optional: Enable Auto-Tune for adaptive optimization █ STRATEGY PROPERTIES Default settings for reproducible backtests: Initial capital: 10,000 USD Order size type: Cash Default order size: 10,000 Process orders on close: Enabled Pyramiding: Controlled by "Allow Add-On Entries" For realistic results, set commission and slippage in Strategy Properties to match your broker/exchange. █ ALERTS & AUTOMATION The strategy outputs structured alert payloads compatible with: Popular bot platforms and webhook receivers Custom automation systems (JSON format) Setup: Create alert → Select "Order fills and alert() function calls" → Use {{strategy.order.alert_message}} placeholder █ WORKS ON Crypto Forex Stocks Indices Commodities █ REALISTIC EXPECTATIONS No strategy wins 100% of the time — this is no exception Auto-Tune optimizes on past data — it cannot predict the future Backtest results ≠ live results (fees, slippage, and emotions matter) Always validate with out-of-sample data before going live Use proper position sizing and risk management █ LIMITATIONS Backtests are simulations — results depend on market conditions, fees, slippage, and parameters Auto-Tune can overfit if used without out-of-sample validation Multi-timeframe exit logic confirms on higher-TF bar closes (slight delay expected) Use standard candles/bars for strategy testing (avoid Heikin Ashi, Renko) █ DISCLAIMER This strategy is provided for educational and informational purposes only and does not constitute financial advice. Past performance is not indicative of future results. Trading involves substantial risk of loss, and you are solely responsible for your own trading decisions.Chiến lược Pine Script®của InfinityAlgo35
EMA and Dow Theory Strategies V2📘 Overview This strategy is an advanced evolution of the original EMA × Dow Theory hybrid model. V2 introduces true swing‑based trend detection, gradient trend‑zones, higher‑timeframe swing overlays, and dynamic exit logic designed for intraday to short‑term trading across crypto, forex, stocks, and indices. The system provides precise entries, adaptive exits, and highly visual guidance that helps traders understand trend structure at a glance. 🧠 Key Features 🔹 1. Dual‑EMA Trend Logic (Symbol + External Index) Both the chart symbol and an external index (OTHERS.D) are evaluated using fast/slow EMAs to determine correlation‑based trend bias. 🔹 2. Dow Theory Swing Detection (Real‑time) The script identifies swing highs/lows and updates trend direction when price breaks them. This creates a structural trend model that reacts faster than EMAs alone. 🔹 3. Gradient Trend Zones (Visual Trend Strength) When trend is up or down, the area between price and the latest swing level is filled with a multi‑step gradient. This makes trend strength and distance-to-structure visually intuitive. 🔹 4. Higher‑Timeframe Swing Trend (htfTrend) Swing highs/lows from a higher timeframe (e.g., 4H) are plotted to show macro structure. Used only for visual context, not for filtering entries. 🔹 5. RSI‑Based Entry Protection RSI prevents entries during extreme overbought/oversold conditions. 🔹 6. Dynamic Exit System Includes: Custom stop‑loss (%) Partial take‑profit (TP1/TP2/TP3) Automatic scale‑out when trend color weakens “Color‑change lockout” to prevent immediate re‑entry Real‑time PnL tracking and labels 🔹 7. Alerts for All Key Events Entry, stop‑loss, partial exits, and trend‑change exits all generate structured JSON alerts. 🔹 8. Visual PnL Labels & Equity Tracking PnL for the latest trade is displayed directly on the chart, including scale‑out adjustments. ⚙️ Input Parameters Parameter Description Fast EMA / Slow EMA EMAs used for symbol trend detection Index Fast / Slow EMA EMAs applied to external index StopLoss (%) Custom stop‑loss threshold Scale‑Out % Portion to exit when trend color weakens RSI Period / Levels Overbought/oversold filters Swing Detection Length Bars used to detect swing highs/lows Stats Display Position of statistics table 🧭 About htfTrend (Higher Timeframe Trend) The higher‑timeframe swing trend is displayed visually but not used for entry logic. Why? Strict HTF filtering reduces trade frequency and often removes profitable setups. By keeping it visual‑only, traders retain flexibility while still benefiting from macro structure awareness. Use it as a contextual guide, not a constraint. 📘 概要 本ストラテジーは、V1 を大幅に拡張した EMA × ダウ理論 × スイング構造 × 上位足トレンド可視化 の複合型モデルです。 短期〜デイトレード向けに最適化されており、仮想通貨・FX・株式・指数など幅広いアセットで利用できます。 V2 では、スイング構造の自動検出、グラデーションによるトレンド強度の可視化、上位足スイングライン、動的な利確/損切りロジック が追加され、視覚的にもロジック的にも大幅に強化されています。 🧠 主な機能 🔹 1. 銘柄+外部インデックスの EMA クロス判定 対象銘柄と OTHERS.D の EMA を比較し、相関を考慮したトレンド方向を判定します。 🔹 2. ダウ理論に基づくスイング高値・安値の自動検出 スイング更新によりトレンド方向を切り替える、構造ベースのトレンド判定を採用。 🔹 3. グラデーション背景によるトレンド強度の可視化 スイングラインから現在価格までを段階的に塗り分け、 「どれだけトレンドが伸びているか」を直感的に把握できます。 🔹 4. 上位足スイングトレンド(htfTrend)の表示 4H などの上位足でのスイング高値・安値を表示し、 大局的なトレンド構造を視覚的に把握できます(ロジックには未使用)。 🔹 5. RSI による過熱・売られすぎフィルター 極端な RSI 状態でのエントリーを防止。 🔹 6. 動的イグジットシステム カスタム損切り(%) TP1/TP2/TP3 の段階的利確 トレンド色の弱まりによる自動スケールアウト 色変化後の再エントリー制限(waitForColorChange) リアルタイム PnL の追跡とラベル表示 🔹 7. アラート完備(JSON 形式) エントリー、損切り、部分利確、トレンド反転などすべてに対応。 🔹 8. 損益ラベル・統計表示 直近トレードの損益をチャート上に表示し、視覚的に把握できます。 ⚙️ 設定項目 設定項目名 説明 Fast / Slow EMA 銘柄の EMA 設定 Index Fast / Slow EMA 外部インデックスの EMA 設定 損切り(%) カスタム損切りライン 部分利確割合 トレンド弱化時のスケールアウト割合 RSI 期間・水準 過熱/売られすぎフィルター スイング検出期間 スイング高値・安値の検出に使用 統計表示位置 テーブルの表示位置 🧭 上位足トレンド(htfTrend)について 上位足スイングの更新に基づくトレンド判定を表示しますが、 エントリー条件には使用していません。 理由: 上位足を厳密にロジックへ組み込むと、トレード機会が大幅に減るためです。 本ストラテジーでは、 「大局の把握は視覚で、エントリーは柔軟に」 という設計思想を採用しています。 → 裁量で利確判断や逆張り回避に活用できます。 Chiến lược Pine Script®của mm_mitsuya61
extradestrategy super BTCUSD M15cocok untuk btc usd tidak di perjual belikan harap tidak menggunakan sembaranganChiến lược Pine Script®của Extrade_indonesia37
tradingview by extrade btcusd m15my strategi cocok untuk btc usd tidak di perjual belikanChiến lược Pine Script®của Extrade_indonesia11
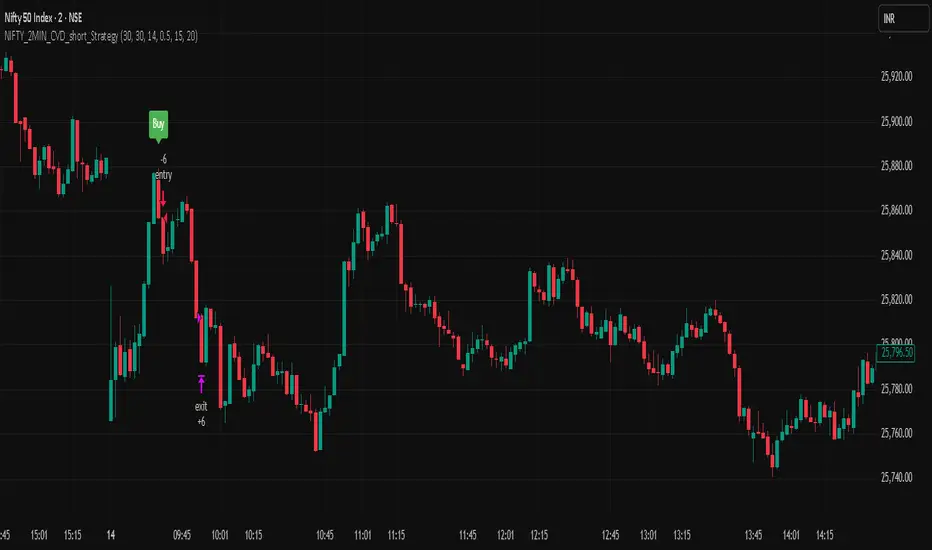
NIFTY_2MIN_CVD_short_StrategySummary This strategy is an intraday system designed for the Nifty index on a 2-minute timeframe, focusing exclusively on identifying high-probability short (sell) entries. It utilizes a combination of rapid price action and Cumulative Volume Delta (CVD) to detect "Buying Absorption" at local peaks. Concept & Core Logic The strategy is engineered to identify "Inverted V-shaped" reversals where aggressive buying pressure is exhausted and absorbed by large-scale limit orders from sellers. Price Action Trigger: The strategy looks for a specific two-part sequence: Sudden Bullish Movement: A rapid upward move that often traps late buyers or triggers short-covering. Sudden Reversal: Immediately followed by a strong, high-momentum bearish (red) candle, signaling a swift rejection of the higher prices. CVD Absorption Filter: To confirm the validity of the reversal, the strategy analyzes the Cumulative Volume Delta (CVD). It identifies instances where the relative movement of the CVD is significantly higher than the corresponding price movement. This specific divergence highlights "Buying Absorption"—a market condition where aggressive market buy orders are being filled by passive limit sell orders, preventing further price appreciation and creating a heavy ceiling for the reversal. Risk Management To maintain a disciplined approach, the strategy employs fixed exit parameters based on the underlying Nifty price: Take Profit: 25 points. Stop Loss: 30 points. Intended Use This tool is intended for traders who study mechanical, rule-based systems and order flow dynamics. It provides a structured framework for observing how volume delta divergence (CVD) and rapid price rejections interact at potential market turning points. Disclaimer: This script is for educational and informational purposes only. It is not financial advice. All trading involves risk, and past performance is not indicative of future results. Please conduct your own research and backtesting before making any trading decisions.Chiến lược Pine Script®của AlgoProfessor3
NIFTY_2MIN_CVD_Absorption_long_StrategySummary This strategy is an intraday system designed for the Nifty index on a 2-minute timeframe, focusing on high-probability reversal entries. It utilizes price action patterns and Cumulative Volume Delta (CVD) to identify market turning points. Long Strategy: Concept & Core Logic The long strategy is engineered to identify "V-shaped" recoveries where selling pressure is exhausted and absorbed by aggressive buyers. Price Action Trigger: The strategy looks for a specific two-part sequence: Sudden Bearish Movement: A rapid downward move representing a final flush of sellers. Sudden Reversal: Immediately followed by a strong, high-momentum bullish (green) candle, indicating a swift change in market sentiment. CVD Absorption Filter: To confirm the validity of the reversal, the strategy analyzes the Cumulative Volume Delta (CVD). It specifically looks for instances where the relative movement of CVD is significantly higher than the corresponding price movement. This divergence suggests "selling absorption"—where large buy orders are soaking up sell-side liquidity, creating a floor for the reversal. Risk Management (Long) The strategy utilizes fixed exit parameters based on the underlying Nifty price points: Take Profit: 25 points. Stop Loss: 30 points. Intended Use This tool is intended for traders who study mechanical, rule-based systems. It demonstrates how price action, volume delta divergence (CVD), and trend filters can be combined to time entries in both trending and reversal market conditions. Disclaimer: This script is for educational and informational purposes only. It is not financial advice. All trading involves risk, and past performance is not indicative of future results. Please conduct your own research and backtesting before making any trading decisions.Chiến lược Pine Script®của AlgoProfessor1
Nifty_2MIN_Rangereversal_Short_StrategySummary This strategy is an intraday trend-following system designed for the Nifty index on a 2-minute timeframe, focusing exclusively on short (sell) entries. It is engineered to identify failed bounces within established bearish trends. Concept & Core Logic The strategy uses a multi-layered approach to confirm downward momentum before triggering an entry: Trend Confirmation: The script analyzes the slope and positioning of the 20-period and 200-period Exponential Moving Averages (EMA). Short signals are only valid when the EMA configuration confirms a prevailing bearish trend. Retracement Zone Filtering: To optimize entry pricing, the strategy monitors the daily price range. It looks for the market to be within the 35% to 75% range of the day's movement, specifically identifying a temporary upward "relief rally" or bounce after a significant fall. Candlestick Trigger: The execution occurs when a specific bearish reversal pattern appears during the relief rally: Two consecutive bullish candles (representing the temporary bounce). Followed by a strong, high-momentum bearish candle (signaling the resumption of the primary downtrend). Risk Management The strategy utilizes fixed exit parameters based on the underlying Nifty price points: Take Profit: 28 points. Stop Loss: 30 points. Intended Use This tool is intended for traders who study mechanical, rule-based systems. It demonstrates how moving average trends can be combined with range analysis and price action sequences to time entries during market retracements. Disclaimer: This script is for educational and informational purposes only. It is not financial advice. All trading involves risk, and past performance is not indicative of future results. Please conduct your own research and backtesting before making any trading decisions.Chiến lược Pine Script®của AlgoProfessor1
Nifty_2MIN_ Rangereversal_Long _StrategySummary This strategy is an intraday trend-following system designed for the Nifty index on a 2-minute timeframe. It focuses exclusively on long entries, seeking to identify high-probability recovery points within an established uptrend. Concept & Core Logic The strategy identifies entries based on a confluence of trend direction, price recovery levels, and specific candlestick patterns: Trend Confirmation: The script utilizes the slope and positioning of the 20-period and 200-period Exponential Moving Averages (EMA). A long signal is only considered when the trend is determined to be positive, ensuring trades align with the broader market momentum. Recovery Zone Filtering: To avoid buying at local peaks, the strategy filters for entries that occur when the market has retraced but is showing signs of recovery. Specifically, it looks for price to be within the 35% to 75% recovery range relative to the day's high. Candlestick Trigger: The actual entry trigger is a "Bullish Reversal" sequence: Two consecutive bearish candles (representing a minor pullback). Followed immediately by a strong bullish candle (representing the resumption of strength). Risk Management The strategy uses fixed point-based exits to maintain a disciplined approach: Take Profit: 30 points (underlying Nifty price). Stop Loss: 35 points (underlying Nifty price). Intended Use This script is designed for traders interested in mechanical trend-following systems. It provides a structured way to observe how moving average slopes and specific price action sequences interact during intraday recoveries. Disclaimer: This script is for educational and informational purposes only. It is not financial advice. All trading involves risk, and past performance is not indicative of future results. Please conduct your own research and backtesting before making any trading decisions.Chiến lược Pine Script®của AlgoProfessor1
NIFTY_2min_FVG_sell_StrategyThis strategy is designed for scalping Nifty on a 2-minute chart, focusing exclusively on short entries. The script's purpose is to identify and act on specific bearish patterns based on volume analysis and price action. Concept & Core Logic The strategy operates on a two-stage confirmation process: Volume Absorption: The initial condition seeks to identify potential bearish movements by detecting signs of buying pressure being absorbed by sellers. This suggests that a upward move may be losing momentum. Fair Value Gap (FVG) Confirmation: After a volume absorption signal, the strategy waits for a Bearish Fair Value Gap (FVG) to appear. A short entry signal is generated only after a candle closes below the FVG zone, serving as confirmation of bearish intent. Risk Management The strategy employs a fixed take profit and stop loss for each trade, based on the Nifty underlying price: Take Profit: The exit signal is triggered when a trade reaches a 30-point profit. Stop Loss: The exit signal is triggered when a trade reaches a 35-point loss. Intended Use This tool is intended for traders who: Utilize mechanical, rule-based systems for intraday trading and scalping. Are interested in studying a structured approach that combines volume analysis with price action inefficiencies like Fair Value Gaps.Chiến lược Pine Script®của AlgoProfessor4