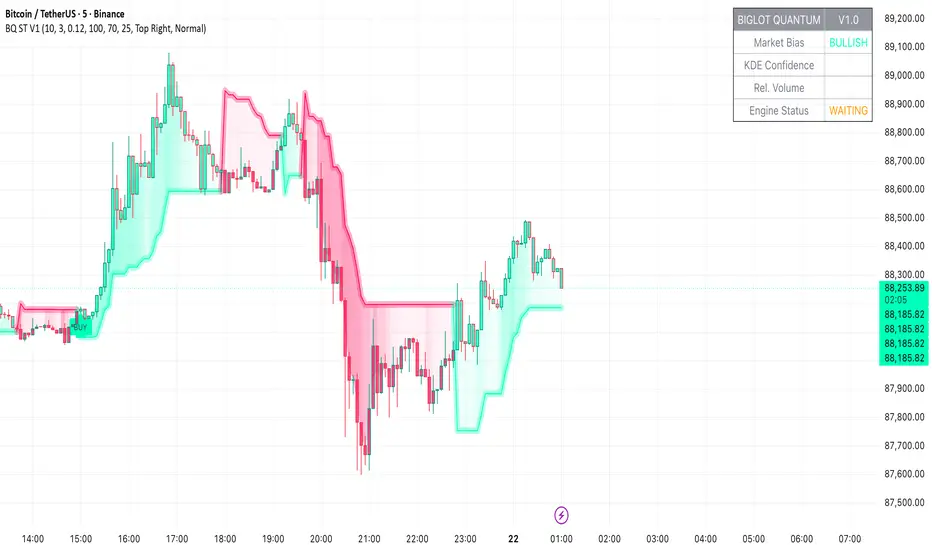
Custom ORBIT GSK-VIZAG-AP-INDIA🚀 Custom ORBIT — Opening Range Breakout & Reversal Indicator
This indicator automatically calculates and plots the Opening Range (OR) high and low levels for a user-defined session and duration. It is designed to assist intraday traders by providing immediate visual signals for both price breakouts and subsequent reversals from these key levels.
The indicator is particularly suitable for markets with defined trading hours, such as the Indian indices (Nifty, Bank Nifty), given its default time settings are based on GMT+5:30.
⚙️ How It Works (Indicator Logic)
The indicator operates based on three main logical components: time definition, level calculation, and signal generation.
1. Time Session and Range Definition: All time calculations are based on GMT+5:30 (Indian Standard Time/IST). The script defines a specific trading session from a customizable start time (default 9:15 AM) to a session end time (default 3:30 PM). The Opening Range (OR) is established during the initial duration, which is set by the rangeMinutes input (default 15 minutes, meaning the OR is calculated from 9:15 AM to 9:30 AM).
2. Level Calculation and Plotting: During the initial range duration, the script captures the absolute highest price (OR High) and the absolute lowest price (OR Low). Once this period ends, two horizontal lines—a green line for the OR High and a red line for the OR Low—are drawn and automatically extended across the chart for the remainder of the active trading session. The visual style of these lines can be customized to Dotted, Dashed, or Solid.
3. Breakout and Reversal Logic: The indicator actively tracks the market's state relative to the OR levels to generate four distinct signals:
Break Up: A signal is generated when the closing price crosses over the OR High, indicating potential upward momentum.
Break Down: A signal is generated when the closing price crosses under the OR Low, indicating potential downward momentum.
Reversal Down: This yellow signal occurs only after a price has already broken above the OR High (Break Up state), and then the price moves back into the range (closing below the ORH), suggesting a failed breakout.
Reversal Up: This yellow signal occurs only after a price has already broken below the OR Low (Break Down state), and then the price moves back into the range (closing above the ORL), suggesting a failed breakdown.
💡 Suggested Use Cases
The signals generated by this indicator can be used in two primary ways:
Breakout Trading: A trader may enter a long position on a "Break Up" signal or a short position on a "Break Down" signal. A common risk management practice is to use the opposite OR level (ORL for long trades, ORH for short trades) as a stop-loss reference.
Faded Breakout / Reversal Trading: Look for the yellow "Reversal Up" or "Reversal Down" signals. These signals indicate a rejection of the OR level, and a trader may take a counter-trend position with the expectation that the price will return to the consolidation range or move toward the opposite OR level.
⚠️ Educational Disclaimer
This indicator is for educational and illustrative purposes only. It provides technical signals based on mathematical calculation of price action and should not be construed as financial advice, trading advice, or a solicitation to buy or sell any financial instrument. Trading carries a high level of risk, and you may lose more than your initial deposit. Past performance is not indicative of future results. Always consult with a qualified financial professional before making any investment decisions.
Chỉ báo và chiến lược
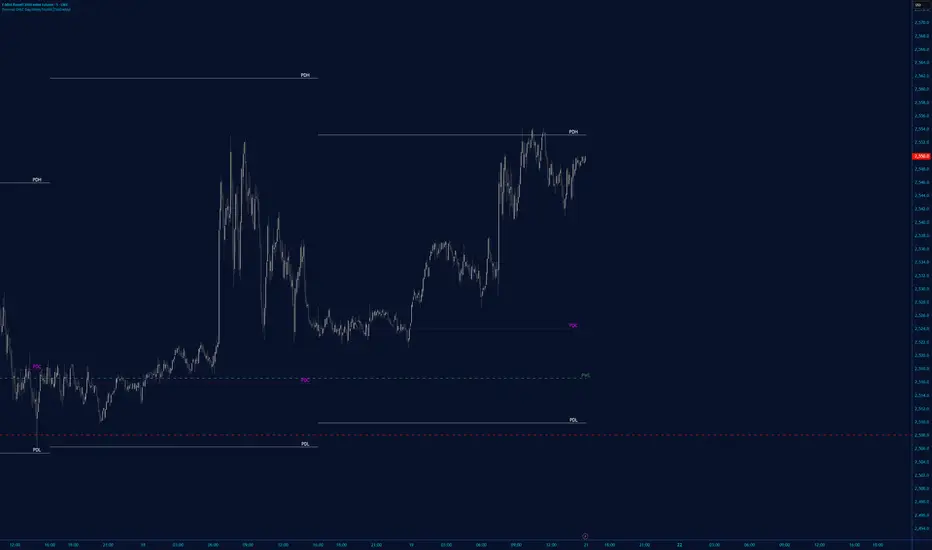
SMI Trigger System The SMI Trigger System is a lower-pane momentum indicator based on a Hull-smoothed Stochastic Momentum Index (SMI). It is designed to assist in identifying potential momentum shifts by highlighting signal alignment and level interactions.
This indicator is intended to be used as part of a broader analysis framework. Confluence between trend, structure, and higher-timeframe context defines the setup, while SMI signal behavior may be used for confirmation.
The script can be applied across multiple timeframes and markets. It does not generate trade signals on its own and should be used alongside additional analysis and risk management techniques.
For educational purposes only. Not financial advice.
Hosoda ZHosoda’s Clouds is a trend-following strategy designed to trade only long positions in traditionally trending markets with a strong bullish bias: SPY(D); DJI (D); NDX (D); XAUUSD (D); Tesla (D, H4, H1); AAPL (D, H4, H1); GOOG (D, H4); META (D, H4); NVDA (D, H4); AMZN(D, H4).
Strategy Parameters
Initial Capital: $10,000 USD.
Position Size: Risks 10% of your equity per trade.
Commission: 0.1%
Indicators
The strategy combines two main technical tools:
A. Ichimoku Cloud This is the core of the strategy. It calculates the classic lines:
• Tenkan-sen (Fast Line): Average of the highest high and lowest low of the last 9 periods.
• Kijun-sen (Base Line): Average of the last 26 periods.
• Cloud (Senkou Span A and B): Projects future support/resistance.
B. EMA 500 (Trend Filter)
• A 500-period Exponential Moving Average is calculated.
• Function: Serves as a very long-term trend filter. If the price is above the EMA 500, the market is considered bullish in the long term.
Entry Rules
• Bullish Cross (Bull Cross): The fast line (Tenkan) crosses above the base line (Kijun). This is the classic Ichimoku entry signal.
• Trend Filter (Optional):
•If you check the "Enable EMA Filter" box in the options, the system will only buy if the closing price is above the EMA 500.
•If the box is unchecked, it will ignore the EMA and buy based solely on the Ichimoku cross.
Exit Rules
A. Stop Loss (Loss Protection) It is a dynamic Stop Loss based on market structure, not a fixed percentage.
• At the moment of entry, the code looks back 12 bars (configurable in sl_bars_back) and finds the lowest price (low).
• It places the Stop Loss at that minimum level.
• Visual: Draws a dotted red line on the chart showing where your Stop Loss is.
B. Technical Take Profit (Exit due to Weakness) Lets profits run until the trend shows weakness.
• Condition: Closes the trade if the Tenkan line crosses below the bottom of the Cloud .
• This means short-term momentum has been lost and the price has entered or crossed below the cloud.
Statistics Panel
In the top right corner, the code draws a table (Panel) that updates in real-time or at the end of Backtesting. It shows:
• Total P&L: Net profit or loss in dollars.
• Win Rate: Percentage of winning trades.
• Trades: Total number of trades executed.
Summary
1. The script waits for the blue line (Tenkan) to cross over the red line (Kijun).
2. It verifies if the price is above the orange line (EMA 500) (if the filter is active).
3. If so, it BUYS.
4. It immediately places a Stop Loss at the low of the last 12 candles (red dotted line).
5. It keeps the trade open until the Stop Loss is hit or until the Tenkan line drops below the Cloud.
Customizable Settings
• Whether to use the EMA filter or not.
• The EMA length (default is 500).
• The Ichimoku periods (9, 26, 52 are standard).
• How many bars to look back to set the Stop Loss.
Gold Smart Scalper AI V21. The "Red Zone" (News Management)
The strategy logic does not "know" when the Federal Reserve is speaking.
Rule: Disable the strategy or stop taking signals 15 minutes before and after high-impact news (CPI, NFP, FOMC).
Why: During these times, Gold can move $30 in seconds. Slippage will cause your $1.50 Stop Loss to execute much further away, leading to massive drawdown.
2. Session Selection
Gold "Scalping" requires high liquidity and tight spreads.
Discretionary Filter: Only trade during the London/New York overlap (13:00 – 17:00 UTC).
Avoid: The late Asian session or Sunday market open. Spreads often widen to $0.50–$1.00, meaning you are already down 30-50% of your Stop Loss the moment you enter.
3. Market "Mood" (Trend vs. Range)
Trend Context: If the 50 EMA (the White line) is completely flat, the market is in a "Bracket." In this state, EMA crossovers generate many false signals.
The Adjustment: Discretionary traders wait for the 50 EMA to show a clear slope (up or down) before trusting the 9/21 crossover signals.
Varun's StrategyBuy and Sell strategy designed for a 1 minute chart to buy when RSI drops under 25 and sell when RSI exceeds 75
Sell-to-Buy Pressure RatioSell/Buy Pressure Ratio
What It Measures
The Sell/Buy Pressure Ratio quantifies the aggressiveness of sellers versus buyers by comparing conviction-weighted volume on down candles versus up candles. It answers a simple question: who is more committed right now—buyers or sellers?
How It Works
The indicator examines each candle and determines directional conviction based on where price closes within the bar's range. A candle that closes near its high shows strong buyer conviction. A candle that closes near its low shows strong seller conviction. This conviction percentage is then multiplied by volume to create a weighted measure of buying and selling pressure.
The ratio divides total selling pressure by total buying pressure over a lookback period. A ratio of 1.5 means sellers are 50% more aggressive than buyers. A ratio of 0.5 means buyers are twice as aggressive as sellers.
Key Features
Conviction weighting: Not all volume is equal. A strong close near the high counts more than a weak close mid-range.
Doji handling: Indecisive candles (where open and close are nearly equal) split volume 50/50 between buyers and sellers.
Volume filtering: Low-volume bars below 60% of average are excluded to focus on meaningful activity.
Normalized output: Optional -1 to +1 scale for cross-stock comparison.
Interpretation
RatioMeaning≤ 0.5Strong buyers — accumulation, continuation setups0.5 – 0.8Buyers favored — healthy environment for longs0.8 – 1.2Balanced — equilibrium, wait for direction1.2 – 1.5Sellers favored — caution warranted≥ 1.5Strong sellers — distribution, avoid new longs
Primary Use
Timing entries within confirmed trends. The ratio identifies when selling pressure has exhausted itself, signaling safer entry points. Rather than buying strength, traders wait for the ratio to transition from elevated levels back toward equilibrium—buying when selling stops being dangerous.
What It Does Not Do
This indicator does not predict direction. It measures current pressure dynamics. Pair it with trend analysis (moving averages, price structure) to determine direction, then use the pressure ratio to time entries and exits.
GS Institutional Trend (Vol Target)hedge fund strategy used on a 4 hour chart with a purple bar warning to signal dangerous volitilaty. this strategy will lose money in choppy sideways markets.
Buy / Sell Volume + % (Classic + Pressure)Buy / Sell Volume % (Classic + Pressure)
Overview
Buy / Sell Volume (Classic + Pressure) is a volume decomposition and dominance indicator designed to help traders understand how trading volume is distributed between buying and selling pressure on each candle.
Instead of treating volume as a single number, this indicator splits total volume into estimated Buy Volume and Sell Volume, visualizes them symmetrically, and summarizes dominance using a compact on-chart dashboard.
The indicator is intended as a context and confirmation tool, not a trade signal generator.
Core Concepts
1. Buy / Sell Volume Decomposition
The indicator estimates buying and selling activity based on the position of the close within the candle’s high–low range:
Closes near the high → more buying pressure
Closes near the low → more selling pressure
Middle closes → balanced activity
This provides a clear visual view of demand vs supply on every bar.
2. Dual Calculation Modes
🔹 Classic Mode (Default)
Uses pure candle-range logic
Buy Volume + Sell Volume = Total Volume (exact conservation)
No smoothing or directional bias
Values closely match traditional volume behavior
Best for:
Structural analysis
Accumulation / distribution studies
Comparing against raw volume
🔹 Pressure Mode
Introduces a directional bias:
Bullish candles slightly favor buy volume
Bearish candles slightly favor sell volume
Optional EMA smoothing reduces noise
Still volume-conserving (Buy + Sell = Total Volume)
Best for:
Identifying dominance
Trend continuation confirmation
Absorption vs initiative activity
Visual Elements
Volume Bars
Buy Volume plotted above zero
Sell Volume plotted below zero
Optional Total Volume Envelope for context
Color by Dominance
Bright colors when one side dominates
Faded colors when dominance is weak
Helps instantly identify:
Accumulation
Distribution
Absorption
Dashboard (Optional)
A compact dashboard displays:
Buy %
Sell %
Dominance State
BUY DOM
SELL DOM
BALANCED
The dashboard can be toggled ON/OFF and switched between Normal and Compact size to suit multi-pane layouts.
How to Use This Indicator
This indicator works best as a confirmation layer, not a standalone system.
Common Use Cases
Confirming breakouts or breakdowns
Spotting accumulation or distribution near key levels
Identifying absorption during consolidations
Filtering false price moves
Examples
Price rising + strong Buy % → constructive demand
Price rising + strong Sell % → possible distribution
Flat price + balanced volume → absorption / compression
What This Indicator Is NOT
❌ Not true order-flow or bid/ask data
❌ Not a buy/sell signal generator
❌ Not predictive on its own
All calculations are candle-based estimations, designed for context and insight, not execution timing.
Best Use
Works on all timeframes
Most reliable on liquid instruments
Especially useful when combined with:
Support / resistance
Trend structure
Market regime or breadth indicators
Summary
Buy / Sell Volume (Classic + Pressure) helps traders go beyond raw volume by visualizing who is in control of each candle, how strong that control is, and whether volume behavior supports price action.
Used correctly, it can significantly improve trade selectivity, confidence, and risk awareness.
Third eye Strategy v3.1 DogeThird eye • Strategy v3.1 Doge Third eye • Strategy v3.1 Doge Third eye • Strategy v3.1 Doge
Hicham XAUUSD Key Levels PRO (Custom Series) V2🔑 XAUUSD Key Levels PRO | 1H / 4H Structure + Psychological Levels v2
This indicator is designed specifically for Gold (XAUUSD) traders who want clean, institutional-grade key levels without chart clutter.
It combines market structure levels with true psychological price levels used by institutions, making it ideal for scalping, intraday, and swing trading.
📌 Features
🔹 Market Structure Key Levels
Automatic 1H & 4H High / Low detection
Based on swing pivots (configurable strength)
Solid lines for clear structure visibility
🔹 Gold Psychological Levels (XAUUSD)
Major levels: every 500$ (strong institutional zones)
Medium levels: every 250$
Minor levels: every 10$
Dynamic levels around current price
No line spam, optimized performance
🔹 Visual Clarity
Solid / dashed / dotted line styles
Custom colors & line thickness
Optional price labels
Works perfectly on M1 → H4
🎯 Best Use Cases
Liquidity sweeps & reactions
Premium / discount zones
Stop-loss & take-profit placement
Confluence with BOS / CHoCH
London & New York sessions
⚙️ Fully Customizable
Toggle 1H / 4H levels
Adjust psychological level spacing
Enable / disable labels
Clean & lightweight (no lag)
⚠️ Notes
Optimized for XAUUSD (Gold)
Best results when combined with price action & structure
Not a trading signal indicator
If you want:
Session-based levels
Alerts on key levels
Smart Money Concepts integration
Feel free to comment or DM 👊
Happy trading 💛📈
Open-source script
In true TradingView spirit, the creator of this script has made it open-source, so that traders can review and verify its functionality. Kudos to the author! While you can use it for free, remember that republishing the code is subject to our House Rules.
hichamfata
Disclaimer
The information and publications are not meant to be, and do not constitute, financial, investment, trading, or other types of advice or recommendations supplied or endorsed by TradingView. Read more in the Terms of Use.
ChanLun Structure: K/Fractals/Strokes/Segments/ZhongShuThis script implements the "line and center" concept of CHANLUN.
Intraday Volume Pulse GSK-VIZAG-AP-INDIA📊 Intraday Volume Pulse — by GSK-VIZAG-AP-INDIA
Overview:
This indicator displays a simple and effective intraday volume summary in table format, starting from a user-defined session time. It provides an approximate breakdown of buy volume, sell volume, cumulative delta, and total volume — all updated in real-time.
🧠 Key Features
✅ Session Start Control
Choose the session start hour and minute (default is 09:15 for NSE).
🌐 Timezone Selector
View volume data in your preferred timezone: IST, GMT, EST, CST, etc.
📈 Buy/Sell Volume Estimation Logic
Buy Volume: When candle closes above open
Sell Volume: When candle closes below open
Equal: Volume split equally if Open == Close
🔄 Daily Auto-Reset
All volume metrics reset at the start of a new trading day.
🎨 Color-Coded Volume Insights
Buy Volume: Green shade if positive
Sell Volume: Red shade if positive
Cumulative Delta: Dynamic red/green based on net pressure
Total Volume: Neutral gray with emphasis text
🧾 Readable Number Formatting
Volumes are displayed in "K", "L", and "Cr" units for easier readability.
📌 Table Positioning
Choose from top/bottom corners to best fit your layout.
⚠️ Note
All data shown is approximate and based on candle structure — it does not reflect actual order book or tick-level data. This is a visual estimation tool to guide real-time intraday decisions.
✍️ Signature
GSK-VIZAG-AP-INDIA
Creator of practical TradingView tools focused on volume dynamics and trader psychology.
SCOTTGO - RVOL Bull/Bear Painter (Real-Time) SCOTTGO - RVOL Bull/Bear Painter (Real-Time Momentum Detection)
📌Overview
The RVOL Bull/Bear Painter is a Pine Script indicator designed to instantly highlight high-momentum candles driven by significant Relative Volume (RVOL).
It provides a clear visual signal (bar color, shape, and label) when a candle's volume exceeds its average by a user-defined threshold, confirming strong bullish or bearish interest in real-time. This helps traders quickly identify potential institutional accumulation/distribution or breakout/breakdown attempts.
✨ Key Features
Relative Volume (RVOL) Calculation: Automatically calculates the ratio of the current bar's volume to its moving average (SMA or EMA) over a customizable lookback period.
Momentum Confirmation: Paints the candle green (bullish) or red (bearish) only when both price direction and high RVOL criteria are met.
Real-Time Detection: Uses a plotshape method to display the signal triangle as soon as the RVOL and direction conditions are met on the currently forming candle, aiming for faster alerts than bar-close coloring.
Customizable Threshold: Easily adjust the RVOL multiplier (e.g., 1.5x, 2.0x, 3.0x) to filter out noise and only focus on truly significant volume events.
Labels and Alerts: Displays a volume multiplier label (e.g., BULL 2.55x) and includes pre-configured alert conditions for automated notifications.
🛠️ How to Use It
1. Identify High-Conviction Moves
Look for the painted candles and the corresponding labels. A candle painted green with a BULL label (e.g., BULL 2.5x) indicates that buyers stepped in with 2.5 times the typical volume to drive the price higher.
2. Configure Your Sensitivity
The power of the script lies in customizing the inputs:
RVOL Lookback Period: Determines the length of the volume moving average.
Shorter periods (e.g., 9-20) make the indicator more reactive to recent volume changes.
Longer periods (e.g., 50-200) require a much larger volume spike to trigger a signal.
RVOL Threshold: This is the multiplier.
Lower values (e.g., 1.5) will generate more signals.
Higher values (e.g., 3.0) will generate fewer, but generally higher-conviction, signals.
3. Set Up Alerts
Use the pre-configured alert conditions (Bullish RVOL Signal and Bearish RVOL Signal) in TradingView's alert menu. Crucially, set the alert frequency to "Once per bar" or "Once per minute" to receive notifications as soon as the high RVOL event occurs, without waiting for the bar to close.
Vector Trinity indicator II: [Bottom: TTM Squeeze]**1. Introduction: The Engine of the System**
This indicator is **Part 2** of the "Vector Trinity" trading system. While Part I (Structure) defines *where* the price is, **Part II (Impulse)** defines *when* the move will happen and *how strong* it is.
It represents the **Time Dimension** of the system, focusing on momentum ignition and energy release.
* **I: Structure:** Spatial boundaries.
* **II: Impulse:** **Momentum velocity & Squeeze timing (Current Indicator).**
* **III: Flow:** Capital validation.
**2. Core Logic: Linear Regression Momentum**
Unlike standard momentum indicators (like MACD) which are based on Moving Averages and often lag significantly, **Vector Trinity II** utilizes **Linear Regression** on price deviations.
* **Math:** It calculates the distance between the price and the mean, then runs a linear regression to determine the angle of attack.
* **Benefit:** This provides a near-instantaneous reading of market "Velocity" and "Acceleration," reducing lag and allowing traders to see the turn before price fully commits.
**3. The "Squeeze" Mechanics (The Dots)**
The central line features dots that indicate the volatility state of the market:
* **🔴 Red Dot (Squeeze ON):** The Bollinger Bands have moved inside the Keltner Channels. Volatility is critically low. The market is storing energy like a compressed spring. **Action:** Wait. Do not trade yet.
* **🟢 Green Dot (Squeeze Fired):** The Bands have popped out of the Channels. The energy is releasing. **Action:** This is the "Ignition" signal. Look at the histogram color for direction.
**4. The 4-Color Momentum System**
The histogram bars are color-coded to tell the full story of the trend's lifecycle, not just direction:
* **Bullish Territory (Above 0):**
* **🟦 Cyan (Light Blue):** **Bullish Acceleration.** Buyers are aggressive. Momentum is increasing. (Best for entry).
* **🔷 Blue (Dark Blue):** **Bullish Deceleration.** Buyers are tired. Momentum is fading. (Prepare to take profit).
* **Bearish Territory (Below 0):**
* **🟥 Red:** **Bearish Acceleration.** Sellers are aggressive. Momentum is increasing. (Best for shorting).
* **🟨 Yellow:** **Bearish Deceleration.** Sellers are exhausted. Momentum is recovering towards zero. (Warning: Trend potential reversal).
**5. How to Use**
* **Step 1:** Look for **Red Dots** on the zero line. This identifies a high-potential setup building up.
* **Step 2:** Wait for the **First Green Dot**. This is the "Squeeze Fired" signal.
* **Step 3:** Confirm with the **Histogram Color**.
* If Green Dot + **Cyan Bar** = Long Signal.
* If Green Dot + **Red Bar** = Short Signal.
* **Advanced:** Use the **Yellow Bars** as an early warning to exit short positions before price actually reverses.
**Settings:**
* **Length:** 20 (Standard calculation period).
* **BB/KC Mult:** 2.0 / 1.5 (Standard ratios to define the Squeeze).
* **Smoothing:** Enabled (Default 3) to reduce noise and provide clearer color transitions.
---
### **中文说明**
**1. 简介:系统的核心引擎**
本指标是“矢量三位一体”交易系统的 **第二部分**。如果说第一部分 (Structure) 定义了价格*在哪里*,那么 **第二部分 (Impulse)** 则定义了行情*何时*启动以及力度*有多强*。
它代表了系统的 **时间维度**,专注于动能的点火与能量释放。
* **I: Structure 结构:** 空间边界。
* **II: Impulse 脉冲:** **动能速度与挤压时机(本指标)。**
* **III: Flow 流向:** 资金验证。
**2. 核心逻辑:线性回归动能**
传统的动能指标(如 MACD)通常基于移动平均线,存在显著的滞后性。**Vector Trinity II** 采用了基于价格偏离度的 **Linear Regression (线性回归)** 算法。
* **数学原理:** 它计算价格与均值的距离,并通过回归分析确定攻击的角度。
* **优势:** 这提供了几乎零滞后的市场“速度”与“加速度”读数,允许交易者在价格完全反转之前看到动能的拐点。
**3. “挤压”机制 (圆点信号)**
0轴上的圆点指示了市场的波动率状态:
* **🔴 红点 (Squeeze ON):** 布林带完全进入了肯特纳通道内部。波动率极低。市场像被压缩的弹簧一样在积蓄能量。**操作:** 等待,不要急于进场。
* **🟢 绿点 (Squeeze Fired):** 布林带扩张冲出通道。能量开始释放。**操作:** 这是“点火”信号。观察柱状图颜色以确定方向。
**4. 四色动能战术系统**
柱状图通过四种颜色讲述了趋势完整的生命周期,而不仅仅是涨跌:
* **多头区域 (0轴上方):**
* **🟦 青色 (Cyan):** **多头加速。** 买盘积极,动能增强。(最佳进场期)
* **🔷 蓝色 (Blue):** **多头减速。** 买盘疲惫,动能衰减。(准备止盈)
* **空头区域 (0轴下方):**
* **🟥 红色 (Red):** **空头加速。** 卖盘积极,动能增强。(最佳做空期)
* **🟨 黄色 (Yellow):** **空头减速。** 卖盘力竭,动能向0轴修复。(警告:趋势可能反转/抄底信号)
**5. 使用方法**
* **第一步:** 寻找0轴上的 **红点**。这标志着一个高爆发潜力的机会正在酝酿。
* **第二步:** 等待 **第一个绿点** 出现。这是“挤压释放/点火”的信号。
* **第三步:** 结合 **柱状图颜色** 确认。
* 绿点 + **青色柱** = 做多信号。
* 绿点 + **红色柱** = 做空信号。
* **进阶用法:** 利用 **黄色柱** 作为空单止盈的先行指标,往往在价格反弹之前,动能就已经变黄了。
**参数设置:**
* **Length (周期):** 20 (标准计算周期)。
* **BB/KC Mult (倍数):** 2.0 / 1.5 (定义挤压状态的标准比率)。
* **Smoothing (平滑):** 开启 (默认3) 以减少噪音,提供更平滑的颜色转换体验。
All-in-One Momentum Composite The Four Components (and Why They're Chosen)
RSI (Relative Strength Index) – Classic overbought/oversold oscillator (14-period default). Measures speed and change of price movements.
Stochastic (%D line) – Smoothened momentum indicator that compares closing price to the price range over a period. Excellent at spotting reversals in ranging markets.
WaveTrend – Very popular in crypto and forex communities (originally by LazyBear). It’s essentially a momentum oscillator based on overbought/oversold channels, similar to a faster, smoother RSI/Stochastic hybrid. Known for early divergence signals and clean crossovers.
MACD Histogram – Captures momentum changes and trend strength via the difference between fast and slow EMAs. The histogram shows acceleration/deceleration.
Raeinex Momentum Liquidity IndexEntry arrow signals with volumetric momentum (buying and selling pressure) and the possibility to use all entry signals as liquidity area for price retest.
NCL Noise FilterOne of our Favorite Indicators - the NeoChartLabs Noise Filter.
FILTER OUT THE NOISE and focus on the moves that matter, toggle the settings to match your preference.
Or switch the Duration Setting to Institutional on a high timeframe (1W+) to locate great spot buying opportunities near cycle tops and bottoms.
Volume Filter: The volume filter automatically turns OFF when you switch to Major Macro Cycle or Institutional Baseline, as those high-timeframe structural breaks are often valid even on lower relative volume.
You can change the volume requirement by checking the volume of the current breakout bar against its Relative Volume (RVOL) - A setting of 0 turns this OFF.
A common professional standard is to require the breakout volume to be at least 1.5x to 2x higher than the 20-period average volume.
*we recommend using a higher volume setting on low timeframes under the 4HR to reduce false signals.
MTF Filter:
*we recommend to set at least 1 timeframe above your trade (i.e if you enter on the 2hour set to the 4 hour)
It prevents entering trades that are essentially minor pullbacks in a much larger opposing trend.
By integrating a higher timeframe EMA (e.g., a 200-period EMA from a 4x higher timeframe), you can filter out counter-trend trades that have a higher probability of failing.
ATR Filter:
Filters "Fake-Outs": It forces the price to not just "touch" the trendline, but to break it with enough force to clear the current average volatility.
Adaptive: Unlike a fixed pip/dollar amount, the ATR adjusts to the asset. On Bitcoin, the threshold might be $500; on a penny stock, it might be $0.05.
Bullish Cross: The price must close above the support trendline + (0.5 * ATR).
Bearish Cross: The price must close below the resistance trendline - (0.5 * ATR).
MACD Filter:
Bullish Crosses require the MACD Histogram to be increasing (showing positive momentum acceleration).
Bearish Crosses require the MACD Histogram to be decreasing (showing negative momentum acceleration).
RSI Filter:
Bullish Breakout (Cross of the lower/support trendline): You would want the RSI to be rising or above 50, showing that buyers are in control.
Bearish Breakdown (Cross of the upper/resistance trendline): You would want the RSI to be falling or below 50, showing sellers are in control.
Market Structure Shifts (CHoCH) - identifying Trends with bullish/bearish dashed horizontal lines for each CHoCH providing a cleaner visualization of the support or resistance level that price has just violated.
Duration Table for 1Week Charts
Trading Style Fractal Length (p) Pattern Span Confirmation Delay
Standard Swing 2 5 Weeks 2 Weeks
Intermediate Trend 5 11 Weeks 5 Weeks
Major Macro Cycle 10–20 21–41 Weeks 10–20 Weeks
Institutional Baseline 44 ~2 Years ~10 Months
Microstructure Participation & Acceptance Indicator📊 Microstructure Participation & Acceptance Indicator
An advanced participation-based filter combining VWAP distance analysis, volume delta detection, and real-time acceptance/rejection state identification—designed for smaller timeframe trading.
📊 FEATURES
VWAP Distance Normalization
Context-aware fair value measurement:
Automatically resets based on selected anchor (Session/Week/Month)
ATR-normalized distance calculation for universal application
Identifies when price is extended or compressed relative to equilibrium
Configurable extreme distance threshold (default: 1.5 ATR)
Adjustable source input (default: HLC3)
Volume Delta Proxy
Bull vs Bear participation tracking:
Calculates volume imbalance between bullish and bearish candles
EMA smoothing for cleaner signal generation (default: 9 periods)
Delta ratio measurement to identify dominant side
Expansion/compression detection to gauge momentum commitment
Configurable expansion threshold (default: 1.3x)
Acceptance/Rejection State Machine
Real-time market regime identification with six distinct states:
🟢 Accepted Long
Price moving away from VWAP with expanding bullish delta
Distance from VWAP increasing
Volume confirming the move
Indicates real buying pressure—trade WITH the move
🟢 Accepted Short
Price moving away from VWAP with expanding bearish delta
Distance from VWAP increasing
Volume confirming the move
Indicates real selling pressure—trade WITH the move
🟠 Fade Long
Price extended beyond threshold (>1.5 ATR above VWAP)
Delta not supporting the extension
Volume participation absent or diminishing
Potential mean-reversion short setup
🟠 Fade Short
Price extended beyond threshold (>1.5 ATR below VWAP)
Delta not supporting the extension
Volume participation absent or diminishing
Potential mean-reversion long setup
⚪ Chop
Price compressed near VWAP
Bollinger Bands tight (width compressed)
Delta neutral—no clear commitment
NO TRADE ZONE—wait for expansion
⚪ Neutral
Transitional state between regimes
Momentum shifting but not yet confirmed
Monitor for next acceptance signal
Bollinger Bands
Standard volatility measurement with TradingView default styling:
Adjustable period length (default: 20)
Configurable standard deviation multiplier (default: 2.0)
Visual fill between bands for volatility context
Used internally for chop/compression detection
Live Dashboard
Real-time metrics display (top-right corner):
Current market state with color coding
VWAP distance in ATR units
Delta ratio (bull/bear volume balance)
Delta state (Expanding/Compressing)
High-contrast design for instant readability
🎯 HOW TO USE
For Trend Trading:
Accepted Long/Short backgrounds indicate confirmed participation—stay with the trend
Strong moves typically travel 1-1.5 ATR from VWAP with delta support
Use VWAP as dynamic support/resistance
Combine with momentum indicators (MACD, RSI) for confluence
Price above VWAP + Accepted Long state = bullish bias
Price below VWAP + Accepted Short state = bearish bias
For Mean Reversion:
Fade Long/Short states signal overextension without participation
Price beyond 1.5 ATR from VWAP with weak delta = potential reversal
Look for price return to VWAP when extended
Bollinger Band extremes + Fade state = high-probability mean reversion setup
VWAP acts as mean reversion anchor during range-bound sessions
For Risk Management:
Chop state = avoid new entries
Bollinger Band compression + Chop = pre-expansion zone (wait for breakout)
Delta compression after strong move = early exhaustion warning
State transitions (Accepted → Neutral → Fade) = tighten stops
Signal Confirmation:
Strongest setups occur when multiple factors align:
BB breakout + Accepted state + price above/below VWAP
Price rejection at BB bands + Fade state
VWAP support/resistance hold + state transition
Delta expansion + distance increasing + trend direction
⚙️ SETTINGS
All components are fully customizable through organized input groups:
VWAP Distance Group:
VWAP source (default: HLC3)
Anchor period (Session/Week/Month)
ATR length for normalization (default: 14)
Extreme distance threshold in ATR multiples (default: 1.5)
Volume Delta Group:
Delta EMA length (default: 9)
Delta expansion threshold (default: 1.3)
Acceptance Logic Group:
Acceptance lookback period (default: 5)
Chop threshold in VWAP/ATR units (default: 0.3)
Bollinger Bands Group:
BB length (default: 20)
Standard deviation multiplier (default: 2.0)
Display Group:
Toggle state backgrounds
Toggle state change labels
Toggle VWAP line
Toggle Bollinger Bands
💡 EDUCATIONAL VALUE
This indicator teaches important concepts:
How institutional money identifies fair value (VWAP)
The difference between price movement and market acceptance
Why volume participation matters more than price action alone
How to distinguish between noise and committed directional moves
The relationship between volatility compression and expansion cycles
Why distance from equilibrium predicts mean reversion probability
⚠️ IMPORTANT NOTES
This indicator is for educational and informational purposes only
This is a filter, not a standalone trading system
No indicator is perfect—always use proper risk management
Past performance does not guarantee future results
Combine with your own analysis and risk tolerance
Test thoroughly on historical data before live trading
This is not financial advice—use at your own risk
🔧 TECHNICAL DETAILS
Pine Script Version 6
Overlay indicator (displays on price chart)
All calculations use standard, well-documented formulas
No repainting—all signals are confirmed on bar close
Compatible with all timeframes and instruments
Optimized for smaller timeframes (1-5 minute charts)
Minimal computational overhead
📝 CHANGELOG
Version 1.0
Initial release
VWAP distance normalization with ATR scaling
Volume delta proxy system (bull/bear EMA)
6-state acceptance/rejection state machine
Bollinger Bands integration
Real-time dashboard with live metrics
State change labels and background coloring
Full customization options
Developed for traders who need objective participation filters to distinguish high-probability setups from low-quality noise—without cluttering their charts with multiple indicator panels.
EMA SMA Rhythmic Lite Public V1.1 by SRTEMA SMA Rhythmic Lite Public V1.1 by SRT
A clean, lightweight trend-rhythm engine designed for traders of all levels. Built on a robust combination of EMAs and SMAs, this indicator provides clear directional bias signals while remaining fully non-repainting.
Key Features:
Multi-Timeframe Friendly: Works seamlessly on M1 to Daily (D) charts. MA stacking and signal logic automatically adapt to any timeframe.
Bias Detection: Determines bullish, bearish, or neutral market conditions using a 4-MA stack.
Engulfing Bar (EB) & Long-Tail Body (LTB) Detection: Highlights strong price action setups, filtered by body size and ATR-based thresholds.
Flush Markers: Visual cues showing where price aligns with MA stack for trend confirmation.
Bias Table: Displays current MA bias and presence of LTB on the chart for at-a-glance clarity.
Advanced Alerts:
Flush Alerts: Trigger when MA stack aligns with price, signaling trend continuation.
Combo Alerts: Trigger when EB or LTB appears in alignment with MA bias.
LTB-only Alerts: For monitoring significant price action reversals.
Customizable Visualization: Colors, widths, and visibility of all MAs, labels, and flush dots can be tailored to your preference.
Why Lite?
This is the most lightweight version in the SRT rhythm series, optimized for any timeframe, from scalping to swing trading. Perfect for traders who want a clear bias engine without unnecessary complexity.
If you like this EMA SMA Rhythmic Lite, you may also explore:
▶ H1 Bias Rhythmic Lite Public (Free)
▶ SRT Premium Series
Invite-only advanced indicators with stronger bias enforcement and execution frameworks.
ADX Trend IndicatorThe Average Directional Index (ADX) is commonly known in English as the "Trend Strength Indicator" or "ADX Trend Strength Indicator".It measures the strength of a trend (regardless of direction: up or down), not the direction itself. Traders often call it a "trending ADX" or simply "ADX for trend" when focusing on its role in identifying strong trending markets (typically when ADX > 25).Quick Overview in English:ADX > 25 — Strong trend (good for trend-following strategies).
ADX < 20 — Weak or no trend (ranging/sideways market; avoid trend trades).
It combines with +DI (positive directional indicator) and -DI (negative directional indicator) to also show trend direction.
GEX Levels// Trading View Script v1.2 with BMO Gamma Levels and Dashboard
// Tickers Updated at 12/16/2025, 13:46:13 GMT
// SPY, QQQ , IWM, VXX, UVXY, VIX
// AAPL, ABNB, AEHR, AFRM, AMD, AMZN
// BA, BABA, FB, GOOGL, JPM, LC, MSFT,
// NFLX, NVDA, ROKU, SNOW, SOFI, SQ
// TSLA, UPST, ZM, SOS, PLTR, FCEL
//@version=5
indicator(title='GEX Levels', overlay=true, max_labels_count=500)
// This source code is subject to the terms of the Mozilla Public License 2.0 at mozilla.org
src = input(close)
// Constants colours that include fully non-transparent option.
ticker = syminfo.ticker
chartType = session.extended
source = close
//=============== User inputs ==============================
plotHLines = input(title='Plot Gamma Levels', defval=true)
showMA = input(title='Plot EMAs', defval=false)
//=============== Data for Table =================================
DPLevel_1 = 418.11
DPLevel_1 := na
DPLevel_2 = 416.97
DPLevel_2 := na
plusLG_3 = 415.32
plusLG_3 := na
plusLG_2 = 416.67
plusLG_2 := na
minusLG_3 = 415.32
minusLG_3 := na
minusLG_2 = 416.67
minusLG_2 := na
plus_GEX = 155.00
plus_GEX := na
COI = 150.00
COI := na
POI = 150.00
POI := na
Pos_Trans = 149.00
Pos_Trans := na
Neg_Trans = 148.00
Neg_Trans := na
ZeroGEX = 148.00
ZeroGEX := na
minus_GEX = 145.00
minus_GEX := na
COTMC = 145.00
COTMC := na
CITMC = 145.00
CITMC := na
COTMP = 145.00
COTMP := na
CITMP = 145.00
CITMP := na
Ticker = 'IWM'
Ticker := na
ExpDtGreaterThan = '2021-09-08'
ExpDtGreaterThan := na
Spot_Price = 223.92
Spot_Price := na
EMA21 = 223.47
EMA21 := na
SMA50 = 221.91
SMA50 := na
COIPOI_Trend = 'True'
COIPOI_Trend := na
closeGTzeroGEX = 'True'
closeGTzeroGEX := na
closeLTposGEX = 'True'
closeLTposGEX := na
percentdistPosTrans = 1.0
percentdistNegTrans = 1.0
percentdistPlusGEX = 1.0
percentdistMinusGEX = 1.0
percentdistanceSMA50 = 1.0
percentdistanceEMA21 = 1.0
percentdistCOTMC = 1.0
percentdistCOTMP = 1.0
percentdistCITMP = 1.0
percentdistCITMC = 1.0
percentdistPosTrans := na
percentdistNegTrans := na
percentdistPlusGEX := na
percentdistMinusGEX := na
percentdistanceSMA50 := na
percentdistanceEMA21 := na
percentdistCOTMC := na
percentdistCOTMP := na
percentdistCITMP := na
percentdistCITMC := na
prev_daily_close = request.security(ticker, 'D', close )
// if condition is true then the hline plots
// --------------------------------
if ( ticker == "SPY" and plotHLines and (timeframe.isintraday or timeframe.isdwm))
// Ticker: SPY
// 0 DTE Expirations Only
COTMC:= 690.00
COI:= 685.00
CITMP:= 684.42
plus_GEX:= 682.00
Pos_Trans:= 681.00
Spot_Price:= 680.05
POI:= 680.00
minus_GEX:= 680.00
Neg_Trans:= 680.00
ZeroGEX:= 680.00
EMA21:= 679.69
COTMP:= 677.70
SMA50:= 674.64
CITMC:= 630.23
if ( ticker == "QQQ" and plotHLines and (timeframe.isintraday or timeframe.isdwm))
// Ticker: QQQ
// 0 DTE Expirations Only
CITMP:= 620.53
COI:= 620.00
COTMC:= 619.30
EMA21:= 616.84
SMA50:= 613.56
plus_GEX:= 612.00
Pos_Trans:= 611.00
Neg_Trans:= 610.00
ZeroGEX:= 610.00
Spot_Price:= 609.50
minus_GEX:= 608.00
COTMP:= 607.89
POI:= 600.00
CITMC:= 549.05
if ( ticker == "IWM" and plotHLines and (timeframe.isintraday or timeframe.isdwm))
// Ticker: IWM
// 0 DTE Expirations Only
COI:= 255.00
COTMC:= 254.40
CITMP:= 254.20
plus_GEX:= 253.00
Pos_Trans:= 252.00
Neg_Trans:= 251.00
ZeroGEX:= 251.00
Spot_Price:= 250.81
COTMP:= 249.33
POI:= 249.00
minus_GEX:= 249.00
EMA21:= 248.25
SMA50:= 245.04
CITMC:= 239.44
if ( ticker == "NDX" and plotHLines and (timeframe.isintraday or timeframe.isdwm))
// Ticker: NDX
// 0 DTE Expirations Only
COI:= 25600.00
CITMP:= 25560.60
EMA21:= 25335.01
COTMC:= 25317.29
SMA50:= 25209.24
plus_GEX:= 25200.00
Pos_Trans:= 25190.00
ZeroGEX:= 25155.00
Neg_Trans:= 25120.00
Spot_Price:= 25064.04
minus_GEX:= 25020.00
COTMP:= 24972.64
POI:= 24600.00
CITMC:= 23113.84
if ( ticker == "DIA" and plotHLines and (timeframe.isintraday or timeframe.isdwm))
// Ticker: DIA
// 0 DTE Expirations Only
COI:= 495.00
plus_GEX:= 495.00
COTMC:= 493.68
CITMP:= 491.16
Pos_Trans:= 489.00
ZeroGEX:= 488.50
minus_GEX:= 488.00
Neg_Trans:= 488.00
Spot_Price:= 485.49
COTMP:= 483.75
EMA21:= 477.11
SMA50:= 471.27
CITMC:= 448.75
POI:= 425.00
if ( ticker == "SPX" and plotHLines and (timeframe.isintraday or timeframe.isdwm))
// Ticker: SPX
// 0 DTE Expirations Only
COI:= 7075.00
CITMP:= 6935.65
COTMC:= 6915.55
plus_GEX:= 6860.00
Pos_Trans:= 6845.00
Neg_Trans:= 6840.00
ZeroGEX:= 6840.00
Spot_Price:= 6816.34
EMA21:= 6809.78
COTMP:= 6795.37
minus_GEX:= 6780.00
SMA50:= 6763.86
POI:= 6585.00
CITMC:= 5810.94
if ( ticker == "SPXP" and plotHLines and (timeframe.isintraday or timeframe.isdwm))
// Ticker: SPXP
// 0 DTE Expirations Only
COI:= 7075.00
CITMP:= 6896.02
plus_GEX:= 6860.00
COTMC:= 6858.25
Pos_Trans:= 6845.00
Neg_Trans:= 6840.00
ZeroGEX:= 6840.00
Spot_Price:= 6816.34
EMA21:= 6809.78
COTMP:= 6805.18
minus_GEX:= 6780.00
SMA50:= 6763.86
POI:= 6585.00
CITMC:= 6273.89
if ( ticker == "SPXA" and plotHLines and (timeframe.isintraday or timeframe.isdwm))
// Ticker: SPXA
// 0 DTE Expirations Only
CITMP:= 6960.38
COTMC:= 6927.50
plus_GEX:= 6850.00
Pos_Trans:= 6835.00
Spot_Price:= 6816.34
EMA21:= 6809.78
COTMP:= 6790.64
minus_GEX:= 6780.00
Neg_Trans:= 6780.00
ZeroGEX:= 6780.00
SMA50:= 6763.86
CITMC:= 5735.12
COI:= 5000.00
POI:= 5000.00
if ( ticker == "VIX" and plotHLines and (timeframe.isintraday or timeframe.isdwm))
// Ticker: VIX
// 0 DTE Expirations Only
COI:= 60.00
plus_GEX:= 20.00
Pos_Trans:= 20.00
Neg_Trans:= 19.50
ZeroGEX:= 19.50
CITMP:= 18.97
SMA50:= 18.44
POI:= 18.00
minus_GEX:= 18.00
COTMC:= 17.90
EMA21:= 17.34
Spot_Price:= 16.48
COTMP:= 16.32
CITMC:= 14.87
if ( ticker == "BRK_B" and plotHLines and (timeframe.isintraday or timeframe.isdwm))
// Ticker: BRK_B
// 0 DTE Expirations Only
CITMP:= 516.19
COTMC:= 513.19
COI:= 510.00
plus_GEX:= 510.00
Spot_Price:= 505.61
COTMP:= 503.01
EMA21:= 500.63
Pos_Trans:= 497.50
SMA50:= 496.80
POI:= 495.00
minus_GEX:= 495.00
Neg_Trans:= 495.00
ZeroGEX:= 495.00
CITMC:= 426.03
if ( ticker == "AA" and plotHLines and (timeframe.isintraday or timeframe.isdwm))
// Ticker: AA
// 0 DTE Expirations Only
COI:= 47.50
plus_GEX:= 47.50
COTMC:= 47.08
CITMP:= 46.61
Pos_Trans:= 46.50
ZeroGEX:= 46.00
Spot_Price:= 45.53
minus_GEX:= 45.00
Neg_Trans:= 45.00
COTMP:= 44.97
POI:= 43.00
EMA21:= 42.32
CITMC:= 39.18
SMA50:= 38.92
if ( ticker == "AAPL" and plotHLines and (timeframe.isintraday or timeframe.isdwm))
// Ticker: AAPL
// 0 DTE Expirations Only
COI:= 300.00
COTMC:= 280.56
CITMP:= 280.07
plus_GEX:= 280.00
Pos_Trans:= 280.00
ZeroGEX:= 278.75
POI:= 277.50
minus_GEX:= 277.50
Neg_Trans:= 277.50
EMA21:= 276.03
Spot_Price:= 273.52
COTMP:= 271.52
SMA50:= 268.18
CITMC:= 226.86
if ( ticker == "ABBV" and plotHLines and (timeframe.isintraday or timeframe.isdwm))
// Ticker: ABBV
// 0 DTE Expirations Only
COI:= 240.00
plus_GEX:= 232.50
COTMC:= 231.00
CITMP:= 230.48
Spot_Price:= 227.41
SMA50:= 227.22
EMA21:= 226.47
COTMP:= 225.79
Pos_Trans:= 220.00
minus_GEX:= 217.50
Neg_Trans:= 217.50
ZeroGEX:= 217.50
CITMC:= 200.23
POI:= 185.00
if ( ticker == "ABNB" and plotHLines and (timeframe.isintraday or timeframe.isdwm))
// Ticker: ABNB
// 0 DTE Expirations Only
COTMC:= 137.34
CITMP:= 136.95
Spot_Price:= 131.26
COI:= 130.00
plus_GEX:= 130.00
COTMP:= 129.46
Pos_Trans:= 128.00
ZeroGEX:= 124.00
CITMC:= 123.15
EMA21:= 123.12
SMA50:= 122.30
POI:= 120.00
minus_GEX:= 120.00
Neg_Trans:= 120.00
if ( ticker == "ACHR" and plotHLines and (timeframe.isintraday or timeframe.isdwm))
// Ticker: ACHR
// 0 DTE Expirations Only
SMA50:= 9.68
COI:= 9.50
CITMP:= 9.37
plus_GEX:= 9.00
COTMC:= 8.75
Pos_Trans:= 8.50
EMA21:= 8.34
POI:= 8.00
minus_GEX:= 8.00
Neg_Trans:= 8.00
ZeroGEX:= 8.00
Spot_Price:= 7.76
COTMP:= 7.61
CITMC:= 5.81
if ( ticker == "ADBE" and plotHLines and (timeframe.isintraday or timeframe.isdwm))
// Ticker: ADBE
// 0 DTE Expirations Only
COI:= 400.00
CITMP:= 373.35
COTMC:= 360.63
plus_GEX:= 360.00
Pos_Trans:= 352.50
ZeroGEX:= 350.00
Spot_Price:= 349.96
COTMP:= 346.08
minus_GEX:= 345.00
Neg_Trans:= 345.00
EMA21:= 337.18
SMA50:= 336.74
CITMC:= 310.75
POI:= 300.00
if ( ticker == "AFRM" and plotHLines and (timeframe.isintraday or timeframe.isdwm))
// Ticker: AFRM
// 0 DTE Expirations Only
CITMP:= 72.66
SMA50:= 70.99
COI:= 70.00
POI:= 70.00
plus_GEX:= 70.00
COTMC:= 69.01
EMA21:= 68.80
Pos_Trans:= 68.00
Neg_Trans:= 67.50
ZeroGEX:= 67.50
Spot_Price:= 65.76
COTMP:= 64.00
minus_GEX:= 64.00
CITMC:= 47.37
if ( ticker == "AI" and plotHLines and (timeframe.isintraday or timeframe.isdwm))
// Ticker: AI
// 0 DTE Expirations Only
CITMP:= 17.94
SMA50:= 16.23
COI:= 15.50
plus_GEX:= 15.50
Pos_Trans:= 15.50
EMA21:= 15.12
POI:= 15.00
minus_GEX:= 15.00
Neg_Trans:= 15.00
ZeroGEX:= 15.00
COTMC:= 14.96
Spot_Price:= 14.54
COTMP:= 14.22
CITMC:= 11.07
if ( ticker == "ALAB" and plotHLines and (timeframe.isintraday or timeframe.isdwm))
// Ticker: ALAB
// 0 DTE Expirations Only
COI:= 180.00
SMA50:= 166.41
CITMP:= 165.85
POI:= 165.00
EMA21:= 157.86
COTMC:= 156.79
plus_GEX:= 155.00
Pos_Trans:= 155.00
ZeroGEX:= 148.50
Spot_Price:= 143.44
Neg_Trans:= 142.00
COTMP:= 141.48
minus_GEX:= 140.00
CITMC:= 109.85
if ( ticker == "ALB" and plotHLines and (timeframe.isintraday or timeframe.isdwm))
// Ticker: ALB
// 0 DTE Expirations Only
COI:= 140.00
plus_GEX:= 140.00
CITMP:= 137.32
COTMC:= 136.41
Spot_Price:= 133.01
Pos_Trans:= 133.00
COTMP:= 131.22
ZeroGEX:= 131.00
Neg_Trans:= 129.00
minus_GEX:= 126.00
EMA21:= 123.80
SMA50:= 108.67
CITMC:= 107.27
POI:= 60.00
if ( ticker == "AMD" and plotHLines and (timeframe.isintraday or timeframe.isdwm))
// Ticker: AMD
// 0 DTE Expirations Only
COI:= 235.00
SMA50:= 230.98
CITMP:= 225.70
EMA21:= 220.21
plus_GEX:= 220.00
COTMC:= 219.08
Pos_Trans:= 212.50
minus_GEX:= 210.00
Neg_Trans:= 210.00
ZeroGEX:= 210.00
Spot_Price:= 207.16
COTMP:= 203.60
POI:= 180.00
CITMC:= 148.83
if ( ticker == "AMZN" and plotHLines and (timeframe.isintraday or timeframe.isdwm))
// Ticker: AMZN
// 0 DTE Expirations Only
COI:= 260.00
CITMP:= 235.05
plus_GEX:= 235.00
EMA21:= 229.49
SMA50:= 229.22
COTMC:= 229.04
Pos_Trans:= 225.00
Spot_Price:= 223.30
Neg_Trans:= 222.50
ZeroGEX:= 222.50
COTMP:= 220.46
POI:= 220.00
minus_GEX:= 215.00
CITMC:= 183.13
if ( ticker == "ANET" and plotHLines and (timeframe.isintraday or timeframe.isdwm))
// Ticker: ANET
// 0 DTE Expirations Only
COI:= 170.00
plus_GEX:= 140.00
SMA50:= 138.89
CITMP:= 134.40
COTMC:= 132.11
EMA21:= 130.02
Pos_Trans:= 127.00
Spot_Price:= 126.48
Neg_Trans:= 126.00
ZeroGEX:= 126.00
minus_GEX:= 125.00
COTMP:= 124.52
POI:= 110.00
CITMC:= 98.55
if ( ticker == "ANF" and plotHLines and (timeframe.isintraday or timeframe.isdwm))
// Ticker: ANF
// 0 DTE Expirations Only
COTMC:= 123.43
CITMP:= 122.22
plus_GEX:= 120.00
Spot_Price:= 119.05
COTMP:= 118.08
Pos_Trans:= 116.00
minus_GEX:= 115.00
Neg_Trans:= 115.00
ZeroGEX:= 115.00
EMA21:= 95.07
CITMC:= 92.15
COI:= 85.00
SMA50:= 79.61
POI:= 60.00
if ( ticker == "APP" and plotHLines and (timeframe.isintraday or timeframe.isdwm))
// Ticker: APP
// 0 DTE Expirations Only
COTMC:= 713.12
CITMP:= 703.23
COI:= 700.00
plus_GEX:= 700.00
Pos_Trans:= 692.50
ZeroGEX:= 691.25
minus_GEX:= 690.00
Neg_Trans:= 690.00
Spot_Price:= 674.00
COTMP:= 668.14
EMA21:= 646.74
SMA50:= 610.71
POI:= 530.00
CITMC:= 504.50
if ( ticker == "ARKK" and plotHLines and (timeframe.isintraday or timeframe.isdwm))
// Ticker: ARKK
// 0 DTE Expirations Only
COI:= 85.00
SMA50:= 83.28
CITMP:= 82.73
plus_GEX:= 82.50
COTMC:= 82.13
Pos_Trans:= 81.50
Neg_Trans:= 81.00
ZeroGEX:= 81.00
EMA21:= 80.47
Spot_Price:= 79.30
COTMP:= 78.72
minus_GEX:= 78.00
CITMC:= 72.41
POI:= 70.00
if ( ticker == "ARM" and plotHLines and (timeframe.isintraday or timeframe.isdwm))
// Ticker: ARM
// 0 DTE Expirations Only
COI:= 180.00
SMA50:= 152.18
EMA21:= 138.82
CITMP:= 137.39
plus_GEX:= 134.00
Pos_Trans:= 133.00
COTMC:= 130.77
ZeroGEX:= 129.00
Neg_Trans:= 125.00
Spot_Price:= 124.00
COTMP:= 121.17
POI:= 120.00
minus_GEX:= 120.00
CITMC:= 94.13
if ( ticker == "ASHR" and plotHLines and (timeframe.isintraday or timeframe.isdwm))
// Ticker: ASHR
// 0 DTE Expirations Only
COI:= 35.00
CITMP:= 33.49
plus_GEX:= 33.00
COTMC:= 32.89
EMA21:= 32.81
SMA50:= 32.79
Spot_Price:= 32.58
COTMP:= 32.51
Pos_Trans:= 32.50
minus_GEX:= 32.00
Neg_Trans:= 32.00
ZeroGEX:= 32.00
POI:= 31.00
CITMC:= 30.84
if ( ticker == "ASML" and plotHLines and (timeframe.isintraday or timeframe.isdwm))
// Ticker: ASML
// 0 DTE Expirations Only
CITMP:= 1145.72
COTMC:= 1106.23
COI:= 1100.00
plus_GEX:= 1100.00
Pos_Trans:= 1100.00
Spot_Price:= 1085.19
COTMP:= 1076.84
EMA21:= 1075.75
ZeroGEX:= 1075.00
Neg_Trans:= 1065.00
SMA50:= 1040.95
minus_GEX:= 1040.00
CITMC:= 864.87
POI:= 600.00
if ( ticker == "ASTS" and plotHLines and (timeframe.isintraday or timeframe.isdwm))
// Ticker: ASTS
// 0 DTE Expirations Only
minus_GEX:= 80.00
COTMC:= 76.01
COI:= 75.00
CITMP:= 74.59
SMA50:= 71.27
plus_GEX:= 70.00
EMA21:= 68.31
Spot_Price:= 66.82
COTMP:= 65.63
POI:= 55.00
CITMC:= 40.56
Pos_Trans:= -1.00
Neg_Trans:= -1.00
ZeroGEX:= -1.00
if ( ticker == "AVGO" and plotHLines and (timeframe.isintraday or timeframe.isdwm))
// Ticker: AVGO
// 0 DTE Expirations Only
EMA21:= 376.69
SMA50:= 362.02
CITMP:= 360.22
COTMC:= 350.79
plus_GEX:= 350.00
Pos_Trans:= 347.50
Spot_Price:= 338.68
COTMP:= 335.39
COI:= 330.00
Neg_Trans:= 327.50
ZeroGEX:= 327.50
minus_GEX:= 325.00
POI:= 300.00
CITMC:= 232.52
if ( ticker == "AXP" and plotHLines and (timeframe.isintraday or timeframe.isdwm))
// Ticker: AXP
// 0 DTE Expirations Only
COTMC:= 405.70
COI:= 392.50
plus_GEX:= 387.50
CITMP:= 384.53
Spot_Price:= 382.48
COTMP:= 379.68
Pos_Trans:= 375.00
ZeroGEX:= 373.75
minus_GEX:= 372.50
Neg_Trans:= 372.50
EMA21:= 367.33
SMA50:= 355.18
CITMC:= 314.91
POI:= 300.00
if ( ticker == "BA" and plotHLines and (timeframe.isintraday or timeframe.isdwm))
// Ticker: BA
// 0 DTE Expirations Only
COI:= 215.00
CITMP:= 214.28
COTMC:= 211.44
plus_GEX:= 210.00
Spot_Price:= 205.19
SMA50:= 203.14
COTMP:= 202.88
Pos_Trans:= 200.00
EMA21:= 198.63
Neg_Trans:= 197.50
ZeroGEX:= 197.50
POI:= 190.00
minus_GEX:= 190.00
CITMC:= 180.41
if ( ticker == "BABA" and plotHLines and (timeframe.isintraday or timeframe.isdwm))
// Ticker: BABA
// 0 DTE Expirations Only
COI:= 200.00
SMA50:= 164.44
plus_GEX:= 162.50
EMA21:= 158.25
CITMP:= 158.09
Pos_Trans:= 157.50
COTMC:= 155.20
Neg_Trans:= 155.00
ZeroGEX:= 155.00
Spot_Price:= 148.45
COTMP:= 146.21
minus_GEX:= 145.00
POI:= 140.00
CITMC:= 129.16
if ( ticker == "BAC" and plotHLines and (timeframe.isintraday or timeframe.isdwm))
// Ticker: BAC
// 0 DTE Expirations Only
CITMP:= 57.57
COTMC:= 56.61
Spot_Price:= 55.33
COI:= 55.00
plus_GEX:= 55.00
COTMP:= 54.93
Pos_Trans:= 54.00
ZeroGEX:= 53.75
EMA21:= 53.63
Neg_Trans:= 53.50
minus_GEX:= 53.00
SMA50:= 52.45
POI:= 50.00
CITMC:= 48.84
if ( ticker == "BE" and plotHLines and (timeframe.isintraday or timeframe.isdwm))
// Ticker: BE
// 0 DTE Expirations Only
COI:= 130.00
SMA50:= 109.88
EMA21:= 105.64
CITMP:= 102.08
plus_GEX:= 100.00
Pos_Trans:= 95.00
COTMC:= 94.52
Neg_Trans:= 94.00
ZeroGEX:= 94.00
minus_GEX:= 90.00
Spot_Price:= 88.42
COTMP:= 88.33
CITMC:= 46.72
POI:= 40.00
if ( ticker == "BIDU" and plotHLines and (timeframe.isintraday or timeframe.isdwm))
// Ticker: BIDU
// 0 DTE Expirations Only
COI:= 140.00
CITMP:= 126.95
COTMC:= 123.94
SMA50:= 123.09
EMA21:= 122.05
plus_GEX:= 120.00
Pos_Trans:= 120.00
Spot_Price:= 119.47
Neg_Trans:= 119.00
ZeroGEX:= 119.00
minus_GEX:= 118.00
COTMP:= 117.90
CITMC:= 101.18
POI:= 90.00
if ( ticker == "BMNR" and plotHLines and (timeframe.isintraday or timeframe.isdwm))
// Ticker: BMNR
// 0 DTE Expirations Only
COTMC:= 54.55
plus_GEX:= 50.00
SMA50:= 42.13
COI:= 40.00
EMA21:= 35.47
Pos_Trans:= 34.00
ZeroGEX:= 33.50
CITMP:= 33.20
Spot_Price:= 31.69
COTMP:= 31.07
Neg_Trans:= 30.50
CITMC:= 26.53
POI:= 25.00
minus_GEX:= 25.00
if ( ticker == "BMY" and plotHLines and (timeframe.isintraday or timeframe.isdwm))
// Ticker: BMY
// 0 DTE Expirations Only
CITMP:= 57.46
COTMC:= 55.57
Spot_Price:= 54.50
COTMP:= 54.07
plus_GEX:= 53.00
EMA21:= 50.02
COI:= 50.00
CITMC:= 48.81
Pos_Trans:= 48.50
minus_GEX:= 48.00
Neg_Trans:= 48.00
ZeroGEX:= 48.00
POI:= 47.00
SMA50:= 46.89
if ( ticker == "BX" and plotHLines and (timeframe.isintraday or timeframe.isdwm))
// Ticker: BX
// 0 DTE Expirations Only
CITMP:= 160.90
COI:= 160.00
COTMC:= 156.60
plus_GEX:= 155.00
Pos_Trans:= 152.50
SMA50:= 150.52
Spot_Price:= 150.50
POI:= 150.00
minus_GEX:= 150.00
Neg_Trans:= 150.00
ZeroGEX:= 150.00
EMA21:= 149.55
COTMP:= 148.37
CITMC:= 138.74
if ( ticker == "C" and plotHLines and (timeframe.isintraday or timeframe.isdwm))
// Ticker: C
// 0 DTE Expirations Only
COTMC:= 115.75
plus_GEX:= 115.00
CITMP:= 113.97
Spot_Price:= 112.86
COTMP:= 112.05
COI:= 110.00
Pos_Trans:= 110.00
Neg_Trans:= 109.00
ZeroGEX:= 109.00
minus_GEX:= 108.00
EMA21:= 106.32
SMA50:= 101.41
POI:= 95.00
CITMC:= 89.87
if ( ticker == "CART" and plotHLines and (timeframe.isintraday or timeframe.isdwm))
// Ticker: CART
// 0 DTE Expirations Only
CITMP:= 47.26
COTMC:= 46.92
plus_GEX:= 46.00
Spot_Price:= 45.25
COTMP:= 44.88
Pos_Trans:= 43.00
EMA21:= 42.80
minus_GEX:= 42.50
Neg_Trans:= 42.50
ZeroGEX:= 42.50
CITMC:= 42.36
SMA50:= 40.11
COI:= 40.00
POI:= 35.00
if ( ticker == "CAT" and plotHLines and (timeframe.isintraday or timeframe.isdwm))
// Ticker: CAT
// 0 DTE Expirations Only
COI:= 630.00
COTMC:= 605.13
CITMP:= 603.24
plus_GEX:= 600.00
Pos_Trans:= 595.00
ZeroGEX:= 592.50
Spot_Price:= 590.74
COTMP:= 587.37
EMA21:= 583.80
Neg_Trans:= 577.50
minus_GEX:= 572.50
SMA50:= 554.97
POI:= 490.00
CITMC:= 463.05
if ( ticker == "CAVA" and plotHLines and (timeframe.isintraday or timeframe.isdwm))
// Ticker: CAVA
// 0 DTE Expirations Only
CITMP:= 59.56
COI:= 57.00
plus_GEX:= 55.00
Pos_Trans:= 55.00
SMA50:= 54.91
COTMC:= 54.15
Spot_Price:= 52.05
ZeroGEX:= 52.00
EMA21:= 51.98
COTMP:= 51.39
minus_GEX:= 50.00
Neg_Trans:= 50.00
CITMC:= 47.01
POI:= 40.00
if ( ticker == "CCJ" and plotHLines and (timeframe.isintraday or timeframe.isdwm))
// Ticker: CCJ
// 0 DTE Expirations Only
COI:= 100.00
CITMP:= 94.23
COTMC:= 92.01
EMA21:= 90.41
SMA50:= 90.30
plus_GEX:= 90.00
Pos_Trans:= 90.00
Spot_Price:= 89.35
Neg_Trans:= 89.00
ZeroGEX:= 89.00
COTMP:= 88.54
minus_GEX:= 85.00
POI:= 70.00
CITMC:= 64.50
if ( ticker == "CEG" and plotHLines and (timeframe.isintraday or timeframe.isdwm))
// Ticker: CEG
// 0 DTE Expirations Only
COI:= 372.50
plus_GEX:= 372.50
CITMP:= 371.63
COTMC:= 369.78
SMA50:= 365.10
Pos_Trans:= 365.00
ZeroGEX:= 362.50
EMA21:= 359.39
Spot_Price:= 358.13
Neg_Trans:= 357.50
COTMP:= 351.74
POI:= 350.00
minus_GEX:= 350.00
CITMC:= 300.99
if ( ticker == "CELH" and plotHLines and (timeframe.isintraday or timeframe.isdwm))
// Ticker: CELH
// 0 DTE Expirations Only
SMA50:= 51.26
CITMP:= 49.73
COTMC:= 46.51
EMA21:= 44.00
Spot_Price:= 43.85
plus_GEX:= 43.00
COTMP:= 42.97
Pos_Trans:= 42.50
Neg_Trans:= 42.00
ZeroGEX:= 42.00
minus_GEX:= 41.00
POI:= 40.00
CITMC:= 37.41
COI:= 36.00
if ( ticker == "CLS" and plotHLines and (timeframe.isintraday or timeframe.isdwm))
// Ticker: CLS
// 0 DTE Expirations Only
COI:= 360.00
EMA21:= 321.53
CITMP:= 315.09
COTMC:= 310.97
SMA50:= 306.06
Spot_Price:= 298.40
minus_GEX:= 297.50
COTMP:= 294.57
plus_GEX:= 280.00
CITMC:= 195.74
POI:= 45.00
Pos_Trans:= -1.00
Neg_Trans:= -1.00
ZeroGEX:= -1.00
if ( ticker == "CMCSA" and plotHLines and (timeframe.isintraday or timeframe.isdwm))
// Ticker: CMCSA
// 0 DTE Expirations Only
CITMP:= 33.08
COI:= 30.00
COTMC:= 29.10
plus_GEX:= 28.50
Spot_Price:= 28.30
SMA50:= 28.12
COTMP:= 28.01
EMA21:= 27.37
CITMC:= 27.28
Pos_Trans:= 27.00
minus_GEX:= 26.50
Neg_Trans:= 26.50
ZeroGEX:= 26.50
POI:= 25.00
if ( ticker == "CMG" and plotHLines and (timeframe.isintraday or timeframe.isdwm))
// Ticker: CMG
// 0 DTE Expirations Only
CITMP:= 38.67
COI:= 37.50
minus_GEX:= 37.50
COTMC:= 37.12
Spot_Price:= 35.93
SMA50:= 35.67
COTMP:= 35.54
plus_GEX:= 35.00
EMA21:= 34.09
CITMC:= 33.15
POI:= 27.50
Pos_Trans:= -1.00
Neg_Trans:= -1.00
ZeroGEX:= -1.00
if ( ticker == "COF" and plotHLines and (timeframe.isintraday or timeframe.isdwm))
// Ticker: COF
// 0 DTE Expirations Only
COTMC:= 243.74
COI:= 240.00
plus_GEX:= 240.00
Pos_Trans:= 240.00
Spot_Price:= 239.81
COTMP:= 237.82
ZeroGEX:= 236.25
CITMP:= 235.92
minus_GEX:= 232.50
Neg_Trans:= 232.50
EMA21:= 226.36
CITMC:= 218.77
SMA50:= 218.28
POI:= 175.00
if ( ticker == "COIN" and plotHLines and (timeframe.isintraday or timeframe.isdwm))
// Ticker: COIN
// 0 DTE Expirations Only
COI:= 500.00
SMA50:= 306.66
CITMP:= 290.70
plus_GEX:= 275.00
EMA21:= 273.49
Pos_Trans:= 270.00
COTMC:= 269.05
Spot_Price:= 253.95
Neg_Trans:= 252.50
ZeroGEX:= 252.50
COTMP:= 250.73
minus_GEX:= 250.00
CITMC:= 138.70
POI:= 100.00
if ( ticker == "CORZ" and plotHLines and (timeframe.isintraday or timeframe.isdwm))
// Ticker: CORZ
// 0 DTE Expirations Only
COI:= 30.00
SMA50:= 17.94
CITMP:= 17.24
EMA21:= 16.83
COTMC:= 15.99
Spot_Price:= 15.20
COTMP:= 15.04
plus_GEX:= 15.00
Pos_Trans:= 15.00
Neg_Trans:= 14.50
ZeroGEX:= 14.50
minus_GEX:= 14.00
CITMC:= 12.09
POI:= 10.00
if ( ticker == "COST" and plotHLines and (timeframe.isintraday or timeframe.isdwm))
// Ticker: COST
// 0 DTE Expirations Only
SMA50:= 915.28
CITMP:= 902.76
EMA21:= 896.32
COTMC:= 869.23
COI:= 865.00
plus_GEX:= 865.00
Pos_Trans:= 865.00
Spot_Price:= 860.51
Neg_Trans:= 860.00
ZeroGEX:= 860.00
COTMP:= 856.16
POI:= 850.00
minus_GEX:= 850.00
CITMC:= 774.17
if ( ticker == "CRCL" and plotHLines and (timeframe.isintraday or timeframe.isdwm))
// Ticker: CRCL
// 0 DTE Expirations Only
COTMC:= 107.90
SMA50:= 105.74
CITMP:= 92.08
COI:= 90.00
plus_GEX:= 90.00
EMA21:= 85.72
Pos_Trans:= 80.00
Spot_Price:= 77.08
ZeroGEX:= 77.00
COTMP:= 76.03
Neg_Trans:= 68.50
CITMC:= 68.36
POI:= 68.00
minus_GEX:= 68.00
if ( ticker == "CRDO" and plotHLines and (timeframe.isintraday or timeframe.isdwm))
// Ticker: CRDO
// 0 DTE Expirations Only
EMA21:= 160.72
SMA50:= 156.28
CITMP:= 155.09
POI:= 155.00
COTMC:= 150.09
COI:= 150.00
Spot_Price:= 141.28
minus_GEX:= 140.00
plus_GEX:= 139.00
COTMP:= 138.93
CITMC:= 98.36
Pos_Trans:= -1.00
Neg_Trans:= -1.00
ZeroGEX:= -1.00
if ( ticker == "CRM" and plotHLines and (timeframe.isintraday or timeframe.isdwm))
// Ticker: CRM
// 0 DTE Expirations Only
COI:= 290.00
CITMP:= 271.34
plus_GEX:= 260.00
Pos_Trans:= 260.00
ZeroGEX:= 258.75
COTMC:= 258.36
Neg_Trans:= 257.50
minus_GEX:= 255.00
Spot_Price:= 252.45
COTMP:= 249.49
EMA21:= 248.86
SMA50:= 246.04
CITMC:= 227.74
POI:= 220.00
if ( ticker == "CRWD" and plotHLines and (timeframe.isintraday or timeframe.isdwm))
// Ticker: CRWD
// 0 DTE Expirations Only
COI:= 550.00
SMA50:= 516.92
EMA21:= 513.16
CITMP:= 512.06
COTMC:= 506.02
POI:= 500.00
plus_GEX:= 500.00
Pos_Trans:= 500.00
Neg_Trans:= 497.50
ZeroGEX:= 497.50
Spot_Price:= 487.00
COTMP:= 481.34
minus_GEX:= 470.00
CITMC:= 390.12
if ( ticker == "CRWV" and plotHLines and (timeframe.isintraday or timeframe.isdwm))
// Ticker: CRWV
// 0 DTE Expirations Only
SMA50:= 105.07
COI:= 95.00
plus_GEX:= 95.00
Pos_Trans:= 88.00
CITMP:= 85.40
COTMC:= 85.35
EMA21:= 84.76
ZeroGEX:= 77.50
Neg_Trans:= 73.00
Spot_Price:= 71.90
minus_GEX:= 70.00
COTMP:= 69.94
CITMC:= 61.64
POI:= 60.00
if ( ticker == "CVNA" and plotHLines and (timeframe.isintraday or timeframe.isdwm))
// Ticker: CVNA
// 0 DTE Expirations Only
COI:= 500.00
plus_GEX:= 500.00
Pos_Trans:= 465.00
COTMC:= 464.44
CITMP:= 456.19
Spot_Price:= 451.00
ZeroGEX:= 447.50
COTMP:= 444.70
Neg_Trans:= 417.50
minus_GEX:= 415.00
EMA21:= 400.29
SMA50:= 355.43
CITMC:= 353.77
POI:= 250.00
if ( ticker == "CVS" and plotHLines and (timeframe.isintraday or timeframe.isdwm))
// Ticker: CVS
// 0 DTE Expirations Only
CITMP:= 81.38
COTMC:= 80.80
COI:= 80.00
plus_GEX:= 80.00
Pos_Trans:= 80.00
Spot_Price:= 79.64
COTMP:= 78.98
SMA50:= 78.95
EMA21:= 78.44
Neg_Trans:= 77.50
ZeroGEX:= 77.50
POI:= 77.00
minus_GEX:= 77.00
CITMC:= 66.75
if ( ticker == "CVX" and plotHLines and (timeframe.isintraday or timeframe.isdwm))
// Ticker: CVX
// 0 DTE Expirations Only
COI:= 170.00
SMA50:= 152.75
plus_GEX:= 152.50
Pos_Trans:= 152.50
CITMP:= 152.45
COTMC:= 151.48
EMA21:= 151.10
Neg_Trans:= 150.00
ZeroGEX:= 150.00
minus_GEX:= 149.00
Spot_Price:= 148.88
COTMP:= 147.57
CITMC:= 137.40
POI:= 125.00
if ( ticker == "DAL" and plotHLines and (timeframe.isintraday or timeframe.isdwm))
// Ticker: DAL
// 0 DTE Expirations Only
COTMC:= 74.07
plus_GEX:= 72.50
Spot_Price:= 71.55
CITMP:= 70.81
COTMP:= 70.73
Pos_Trans:= 69.00
ZeroGEX:= 68.00
minus_GEX:= 67.00
Neg_Trans:= 67.00
EMA21:= 65.41
COI:= 62.50
SMA50:= 61.07
CITMC:= 59.98
POI:= 50.00
if ( ticker == "DASH" and plotHLines and (timeframe.isintraday or timeframe.isdwm))
// Ticker: DASH
// 0 DTE Expirations Only
minus_GEX:= 250.00
COTMC:= 238.15
CITMP:= 236.71
SMA50:= 233.39
Spot_Price:= 227.21
plus_GEX:= 225.00
COTMP:= 224.44
COI:= 220.00
EMA21:= 219.07
CITMC:= 187.40
POI:= 180.00
Pos_Trans:= -1.00
Neg_Trans:= -1.00
ZeroGEX:= -1.00
if ( ticker == "DDOG" and plotHLines and (timeframe.isintraday or timeframe.isdwm))
// Ticker: DDOG
// 0 DTE Expirations Only
SMA50:= 162.62
COI:= 160.00
plus_GEX:= 160.00
Pos_Trans:= 160.00
ZeroGEX:= 157.50
EMA21:= 156.54
POI:= 155.00
CITMP:= 154.02
Neg_Trans:= 150.00
COTMC:= 147.80
minus_GEX:= 145.00
Spot_Price:= 142.78
COTMP:= 139.61
CITMC:= 121.98
if ( ticker == "DELL" and plotHLines and (timeframe.isintraday or timeframe.isdwm))
// Ticker: DELL
// 0 DTE Expirations Only
COI:= 160.00
SMA50:= 143.47
plus_GEX:= 140.00
Pos_Trans:= 136.00
CITMP:= 135.75
EMA21:= 135.59
ZeroGEX:= 135.00
COTMC:= 134.21
minus_GEX:= 130.00
Neg_Trans:= 130.00
Spot_Price:= 129.75
COTMP:= 127.10
POI:= 120.00
CITMC:= 106.48
if ( ticker == "DIS" and plotHLines and (timeframe.isintraday or timeframe.isdwm))
// Ticker: DIS
// 0 DTE Expirations Only
CITMP:= 116.64
COI:= 115.00
COTMC:= 113.44
plus_GEX:= 112.00
Spot_Price:= 111.06
COTMP:= 110.09
Pos_Trans:= 110.00
SMA50:= 109.38
Neg_Trans:= 109.00
ZeroGEX:= 109.00
EMA21:= 107.94
POI:= 105.00
minus_GEX:= 105.00
CITMC:= 102.49
if ( ticker == "DJT" and plotHLines and (timeframe.isintraday or timeframe.isdwm))
// Ticker: DJT
// 0 DTE Expirations Only
COI:= 20.00
CITMP:= 15.39
POI:= 14.00
SMA50:= 13.48
EMA21:= 11.46
plus_GEX:= 11.00
Pos_Trans:= 11.00
COTMC:= 10.79
Neg_Trans:= 10.50
ZeroGEX:= 10.50
Spot_Price:= 10.45
COTMP:= 10.27
minus_GEX:= 10.00
CITMC:= 9.48
if ( ticker == "DKNG" and plotHLines and (timeframe.isintraday or timeframe.isdwm))
// Ticker: DKNG
// 0 DTE Expirations Only
COI:= 55.00
CITMP:= 38.63
COTMC:= 37.51
plus_GEX:= 36.00
Spot_Price:= 35.57
COTMP:= 34.99
Pos_Trans:= 34.00
EMA21:= 33.53
Neg_Trans:= 33.50
ZeroGEX:= 33.50
POI:= 33.00
minus_GEX:= 33.00
CITMC:= 32.54
SMA50:= 32.40
if ( ticker == "DUOL" and plotHLines and (timeframe.isintraday or timeframe.isdwm))
// Ticker: DUOL
// 0 DTE Expirations Only
SMA50:= 242.85
COI:= 240.00
CITMP:= 221.89
EMA21:= 199.11
COTMC:= 195.72
minus_GEX:= 190.00
Spot_Price:= 186.70
COTMP:= 183.08
plus_GEX:= 175.00
CITMC:= 159.95
POI:= 145.00
Pos_Trans:= -1.00
Neg_Trans:= -1.00
ZeroGEX:= -1.00
if ( ticker == "DXCM" and plotHLines and (timeframe.isintraday or timeframe.isdwm))
// Ticker: DXCM
// 0 DTE Expirations Only
COI:= 100.00
CITMP:= 71.78
COTMC:= 69.17
Spot_Price:= 65.40
minus_GEX:= 65.00
EMA21:= 64.55
COTMP:= 64.38
SMA50:= 64.08
plus_GEX:= 63.00
CITMC:= 60.91
POI:= 55.00
Pos_Trans:= -1.00
Neg_Trans:= -1.00
ZeroGEX:= -1.00
if ( ticker == "EBAY" and plotHLines and (timeframe.isintraday or timeframe.isdwm))
// Ticker: EBAY
// 0 DTE Expirations Only
CITMP:= 87.52
SMA50:= 86.79
COTMC:= 85.37
plus_GEX:= 85.00
Pos_Trans:= 85.00
Neg_Trans:= 84.00
ZeroGEX:= 84.00
EMA21:= 83.62
Spot_Price:= 83.09
minus_GEX:= 83.00
COTMP:= 82.35
COI:= 75.00
POI:= 75.00
CITMC:= 70.89
if ( ticker == "EEM" and plotHLines and (timeframe.isintraday or timeframe.isdwm))
// Ticker: EEM
// 0 DTE Expirations Only
COI:= 58.00
plus_GEX:= 55.00
Pos_Trans:= 54.50
SMA50:= 54.48
EMA21:= 54.43
Neg_Trans:= 54.00
ZeroGEX:= 54.00
CITMP:= 53.92
COTMC:= 53.39
minus_GEX:= 53.00
Spot_Price:= 52.97
COTMP:= 52.81
CITMC:= 49.33
POI:= 44.00
if ( ticker == "EFA" and plotHLines and (timeframe.isintraday or timeframe.isdwm))
// Ticker: EFA
// 0 DTE Expirations Only
CITMP:= 98.16
COI:= 98.00
plus_GEX:= 98.00
Pos_Trans:= 96.50
Neg_Trans:= 96.00
ZeroGEX:= 96.00
COTMC:= 95.99
EMA21:= 95.38
Spot_Price:= 95.15
minus_GEX:= 95.00
COTMP:= 94.77
SMA50:= 94.67
CITMC:= 93.44
POI:= 87.00
if ( ticker == "ELF" and plotHLines and (timeframe.isintraday or timeframe.isdwm))
// Ticker: ELF
// 0 DTE Expirations Only
SMA50:= 100.57
CITMP:= 94.82
COI:= 90.00
plus_GEX:= 85.00
COTMC:= 83.14
Pos_Trans:= 81.00
EMA21:= 80.61
POI:= 80.00
Spot_Price:= 78.35
minus_GEX:= 77.00
Neg_Trans:= 77.00
ZeroGEX:= 77.00
COTMP:= 76.83
CITMC:= 69.51
if ( ticker == "ENPH" and plotHLines and (timeframe.isintraday or timeframe.isdwm))
// Ticker: ENPH
// 0 DTE Expirations Only
CITMP:= 38.14
COI:= 35.00
POI:= 35.00
COTMC:= 34.24
plus_GEX:= 33.00
SMA50:= 32.06
Spot_Price:= 31.58
Pos_Trans:= 31.00
COTMP:= 30.97
EMA21:= 30.69
Neg_Trans:= 30.50
ZeroGEX:= 30.50
minus_GEX:= 30.00
CITMC:= 28.18
if ( ticker == "EQT" and plotHLines and (timeframe.isintraday or timeframe.isdwm))
// Ticker: EQT
// 0 DTE Expirations Only
COI:= 62.50
EMA21:= 57.78
CITMP:= 56.91
SMA50:= 56.69
COTMC:= 56.60
plus_GEX:= 56.00
Pos_Trans:= 56.00
ZeroGEX:= 55.50
minus_GEX:= 55.00
Neg_Trans:= 55.00
Spot_Price:= 54.80
COTMP:= 54.00
CITMC:= 47.06
POI:= 45.00
if ( ticker == "ETHA" and plotHLines and (timeframe.isintraday or timeframe.isdwm))
// Ticker: ETHA
// 0 DTE Expirations Only
COI:= 35.00
CITMP:= 27.05
SMA50:= 26.59
plus_GEX:= 24.00
EMA21:= 23.86
COTMC:= 23.40
Pos_Trans:= 22.50
Spot_Price:= 22.22
Neg_Trans:= 22.00
ZeroGEX:= 22.00
COTMP:= 21.94
minus_GEX:= 20.00
CITMC:= 15.78
POI:= 6.00
if ( ticker == "ETSY" and plotHLines and (timeframe.isintraday or timeframe.isdwm))
// Ticker: ETSY
// 0 DTE Expirations Only
COI:= 80.00
SMA50:= 61.71
CITMP:= 59.42
COTMC:= 56.02
EMA21:= 55.24
plus_GEX:= 55.00
Pos_Trans:= 54.00
Spot_Price:= 53.13
Neg_Trans:= 53.00
ZeroGEX:= 53.00
COTMP:= 52.17
POI:= 50.00
minus_GEX:= 50.00
CITMC:= 46.82
if ( ticker == "EWZ" and plotHLines and (timeframe.isintraday or timeframe.isdwm))
// Ticker: EWZ
// 0 DTE Expirations Only
CITMP:= 37.06
COI:= 35.00
POI:= 35.00
COTMC:= 34.57
plus_GEX:= 34.00
Spot_Price:= 33.59
COTMP:= 33.37
Pos_Trans:= 33.00
EMA21:= 32.96
Neg_Trans:= 32.50
ZeroGEX:= 32.50
minus_GEX:= 32.00
CITMC:= 31.96
SMA50:= 31.74
if ( ticker == "FCX" and plotHLines and (timeframe.isintraday or timeframe.isdwm))
// Ticker: FCX
// 0 DTE Expirations Only
COTMC:= 49.38
CITMP:= 49.26
Spot_Price:= 47.55
COI:= 47.00
plus_GEX:= 47.00
Pos_Trans:= 47.00
ZeroGEX:= 46.75
COTMP:= 46.61
minus_GEX:= 46.50
Neg_Trans:= 46.50
EMA21:= 44.15
CITMC:= 42.75
SMA50:= 42.05
POI:= 40.00
if ( ticker == "FSLR" and plotHLines and (timeframe.isintraday or timeframe.isdwm))
// Ticker: FSLR
// 0 DTE Expirations Only
COTMC:= 285.57
CITMP:= 271.29
EMA21:= 258.37
Spot_Price:= 254.92
SMA50:= 250.46
COI:= 250.00
plus_GEX:= 250.00
Pos_Trans:= 250.00
COTMP:= 249.09
ZeroGEX:= 247.50
Neg_Trans:= 237.50
minus_GEX:= 230.00
CITMC:= 217.73
POI:= 200.00
if ( ticker == "FTNT" and plotHLines and (timeframe.isintraday or timeframe.isdwm))
// Ticker: FTNT
// 0 DTE Expirations Only
CITMP:= 88.31
COI:= 85.00
plus_GEX:= 85.00
COTMC:= 84.76
SMA50:= 83.26
EMA21:= 82.48
Spot_Price:= 81.48
POI:= 80.00
Pos_Trans:= 80.00
COTMP:= 79.96
minus_GEX:= 79.00
Neg_Trans:= 79.00
ZeroGEX:= 79.00
CITMC:= 74.71
if ( ticker == "FUTU" and plotHLines and (timeframe.isintraday or timeframe.isdwm))
// Ticker: FUTU
// 0 DTE Expirations Only
COI:= 180.00
plus_GEX:= 175.00
Pos_Trans:= 175.00
SMA50:= 173.29
Neg_Trans:= 172.50
ZeroGEX:= 172.50
CITMP:= 172.23
EMA21:= 171.09
COTMC:= 167.59
minus_GEX:= 165.00
Spot_Price:= 161.59
COTMP:= 160.28
POI:= 140.00
CITMC:= 103.00
if ( ticker == "FXI" and plotHLines and (timeframe.isintraday or timeframe.isdwm))
// Ticker: FXI
// 0 DTE Expirations Only
COI:= 42.00
SMA50:= 39.85
EMA21:= 39.38
plus_GEX:= 39.00
Pos_Trans:= 39.00
CITMP:= 38.97
Neg_Trans:= 38.50
ZeroGEX:= 38.50
COTMC:= 38.46
minus_GEX:= 38.00
Spot_Price:= 37.91
COTMP:= 37.62
CITMC:= 35.81
POI:= 30.00
if ( ticker == "GDX" and plotHLines and (timeframe.isintraday or timeframe.isdwm))
// Ticker: GDX
// 0 DTE Expirations Only
minus_GEX:= 87.00
COTMC:= 86.71
CITMP:= 86.34
plus_GEX:= 85.00
Spot_Price:= 84.86
COTMP:= 84.45
EMA21:= 80.73
SMA50:= 77.20
COI:= 75.00
POI:= 65.00
CITMC:= 63.02
Pos_Trans:= -1.00
Neg_Trans:= -1.00
ZeroGEX:= -1.00
if ( ticker == "GDXJ" and plotHLines and (timeframe.isintraday or timeframe.isdwm))
// Ticker: GDXJ
// 0 DTE Expirations Only
CITMP:= 120.51
COTMC:= 118.88
Spot_Price:= 112.41
COTMP:= 111.67
plus_GEX:= 108.00
Pos_Trans:= 108.00
ZeroGEX:= 107.50
minus_GEX:= 107.00
Neg_Trans:= 107.00
EMA21:= 105.97
COI:= 105.00
SMA50:= 100.67
CITMC:= 92.31
POI:= 90.00
if ( ticker == "GEV" and plotHLines and (timeframe.isintraday or timeframe.isdwm))
// Ticker: GEV
// 0 DTE Expirations Only
COTMC:= 710.09
CITMP:= 704.00
plus_GEX:= 700.00
Pos_Trans:= 690.00
Spot_Price:= 689.59
COTMP:= 681.07
ZeroGEX:= 677.50
Neg_Trans:= 667.50
minus_GEX:= 655.00
COI:= 650.00
EMA21:= 627.11
SMA50:= 598.92
CITMC:= 566.94
POI:= 480.00
if ( ticker == "GLD" and plotHLines and (timeframe.isintraday or timeframe.isdwm))
// Ticker: GLD
// 0 DTE Expirations Only
COI:= 410.00
COTMC:= 401.84
plus_GEX:= 400.00
Pos_Trans:= 399.00
CITMP:= 396.58
Spot_Price:= 396.06
COTMP:= 394.88
Neg_Trans:= 394.00
ZeroGEX:= 394.00
minus_GEX:= 392.00
POI:= 390.00
EMA21:= 385.45
SMA50:= 378.72
CITMC:= 352.61
if ( ticker == "GLW" and plotHLines and (timeframe.isintraday or timeframe.isdwm))
// Ticker: GLW
// 0 DTE Expirations Only
COI:= 100.00
CITMP:= 91.34
COTMC:= 90.42
plus_GEX:= 90.00
Pos_Trans:= 90.00
COTMP:= 89.35
ZeroGEX:= 89.00
Spot_Price:= 88.05
minus_GEX:= 87.00
Neg_Trans:= 87.00
EMA21:= 86.97
SMA50:= 85.88
POI:= 85.00
CITMC:= 66.16
if ( ticker == "GM" and plotHLines and (timeframe.isintraday or timeframe.isdwm))
// Ticker: GM
// 0 DTE Expirations Only
COTMC:= 85.17
CITMP:= 82.95
Spot_Price:= 82.14
COTMP:= 81.65
plus_GEX:= 81.00
Pos_Trans:= 78.00
ZeroGEX:= 77.75
minus_GEX:= 77.50
Neg_Trans:= 77.50
EMA21:= 75.17
COI:= 75.00
SMA50:= 68.54
POI:= 65.00
CITMC:= 64.42
if ( ticker == "GME" and plotHLines and (timeframe.isintraday or timeframe.isdwm))
// Ticker: GME
// 0 DTE Expirations Only
CITMP:= 26.41
COI:= 25.00
COTMC:= 23.27
plus_GEX:= 23.00
SMA50:= 22.37
Spot_Price:= 22.18
EMA21:= 22.11
POI:= 22.00
COTMP:= 21.71
Pos_Trans:= 21.50
minus_GEX:= 21.00
Neg_Trans:= 21.00
ZeroGEX:= 21.00
CITMC:= 20.04
if ( ticker == "GOOG" and plotHLines and (timeframe.isintraday or timeframe.isdwm))
// Ticker: GOOG
// 0 DTE Expirations Only
COI:= 320.00
CITMP:= 317.64
COTMC:= 316.69
plus_GEX:= 315.00
Pos_Trans:= 310.00
Spot_Price:= 308.63
EMA21:= 307.79
COTMP:= 307.67
Neg_Trans:= 302.50
ZeroGEX:= 302.50
minus_GEX:= 297.50
POI:= 290.00
SMA50:= 283.54
CITMC:= 235.03
if ( ticker == "GOOGL" and plotHLines and (timeframe.isintraday or timeframe.isdwm))
// Ticker: GOOGL
// 0 DTE Expirations Only
COI:= 335.00
plus_GEX:= 317.50
Pos_Trans:= 317.50
COTMC:= 315.98
CITMP:= 315.92
Neg_Trans:= 315.00
ZeroGEX:= 315.00
minus_GEX:= 310.00
Spot_Price:= 307.93
EMA21:= 307.09
COTMP:= 306.20
POI:= 290.00
SMA50:= 282.92
CITMC:= 235.92
if ( ticker == "HAL" and plotHLines and (timeframe.isintraday or timeframe.isdwm))
// Ticker: HAL
// 0 DTE Expirations Only
COI:= 30.00
plus_GEX:= 30.00
CITMP:= 29.61
COTMC:= 29.56
Spot_Price:= 28.41
COTMP:= 28.01
Pos_Trans:= 28.00
ZeroGEX:= 27.75
EMA21:= 27.56
minus_GEX:= 27.50
Neg_Trans:= 27.50
SMA50:= 26.18
CITMC:= 25.94
POI:= 23.00
if ( ticker == "HIMS" and plotHLines and (timeframe.isintraday or timeframe.isdwm))
// Ticker: HIMS
// 0 DTE Expirations Only
SMA50:= 43.88
CITMP:= 43.17
COTMC:= 41.00
COI:= 40.00
EMA21:= 38.62
plus_GEX:= 38.50
Pos_Trans:= 37.50
Neg_Trans:= 37.00
ZeroGEX:= 37.00
Spot_Price:= 36.30
COTMP:= 35.62
POI:= 30.00
minus_GEX:= 30.00
CITMC:= 20.89
if ( ticker == "HOOD" and plotHLines and (timeframe.isintraday or timeframe.isdwm))
// Ticker: HOOD
// 0 DTE Expirations Only
SMA50:= 131.78
COI:= 130.00
plus_GEX:= 127.00
EMA21:= 126.67
CITMP:= 125.93
COTMC:= 124.91
Pos_Trans:= 124.00
ZeroGEX:= 123.00
Neg_Trans:= 117.00
Spot_Price:= 115.84
COTMP:= 113.98
minus_GEX:= 110.00
POI:= 90.00
CITMC:= 63.00
if ( ticker == "HUT" and plotHLines and (timeframe.isintraday or timeframe.isdwm))
// Ticker: HUT
// 0 DTE Expirations Only
COI:= 50.00
SMA50:= 43.99
EMA21:= 41.86
CITMP:= 41.17
minus_GEX:= 38.00
COTMC:= 37.21
Spot_Price:= 35.72
COTMP:= 35.50
POI:= 35.00
plus_GEX:= 35.00
CITMC:= 25.59
Pos_Trans:= -1.00
Neg_Trans:= -1.00
ZeroGEX:= -1.00
if ( ticker == "HYG" and plotHLines and (timeframe.isintraday or timeframe.isdwm))
// Ticker: HYG
// 0 DTE Expirations Only
COI:= 82.00
plus_GEX:= 81.00
Pos_Trans:= 81.00
CITMP:= 80.98
COTMC:= 80.82
Spot_Price:= 80.64
EMA21:= 80.60
COTMP:= 80.59
SMA50:= 80.59
Neg_Trans:= 80.50
ZeroGEX:= 80.50
CITMC:= 80.22
minus_GEX:= 80.00
POI:= 75.00
if ( ticker == "IBIT" and plotHLines and (timeframe.isintraday or timeframe.isdwm))
// Ticker: IBIT
// 0 DTE Expirations Only
COI:= 60.00
SMA50:= 57.73
CITMP:= 56.36
EMA21:= 52.41
plus_GEX:= 52.00
Pos_Trans:= 51.00
COTMC:= 50.97
Neg_Trans:= 50.50
ZeroGEX:= 50.50
Spot_Price:= 49.41
COTMP:= 49.09
minus_GEX:= 48.00
POI:= 43.00
CITMC:= 28.58
if ( ticker == "INTC" and plotHLines and (timeframe.isintraday or timeframe.isdwm))
// Ticker: INTC
// 0 DTE Expirations Only
COI:= 50.00
plus_GEX:= 40.00
COTMC:= 39.98
CITMP:= 39.87
EMA21:= 38.88
SMA50:= 38.08
Pos_Trans:= 38.00
Spot_Price:= 37.76
Neg_Trans:= 37.50
ZeroGEX:= 37.50
COTMP:= 37.20
minus_GEX:= 37.00
CITMC:= 29.29
POI:= 20.00
if ( ticker == "IONQ" and plotHLines and (timeframe.isintraday or timeframe.isdwm))
// Ticker: IONQ
// 0 DTE Expirations Only
SMA50:= 57.07
COI:= 55.00
plus_GEX:= 55.00
CITMP:= 54.48
COTMC:= 51.48
Pos_Trans:= 51.00
EMA21:= 50.89
ZeroGEX:= 50.00
Neg_Trans:= 47.00
minus_GEX:= 46.00
Spot_Price:= 45.53
COTMP:= 44.76
POI:= 36.00
CITMC:= 32.19
if ( ticker == "IREN" and plotHLines and (timeframe.isintraday or timeframe.isdwm))
// Ticker: IREN
// 0 DTE Expirations Only
COI:= 70.00
SMA50:= 54.58
CITMP:= 46.39
EMA21:= 46.08
COTMC:= 40.36
plus_GEX:= 39.50
Pos_Trans:= 39.50
ZeroGEX:= 39.00
minus_GEX:= 36.00
Neg_Trans:= 36.00
Spot_Price:= 35.31
COTMP:= 34.75
POI:= 27.00
CITMC:= 20.45
if ( ticker == "ISRG" and plotHLines and (timeframe.isintraday or timeframe.isdwm))
// Ticker: ISRG
// 0 DTE Expirations Only
COI:= 630.00
plus_GEX:= 575.00
COTMC:= 573.84
Pos_Trans:= 570.00
CITMP:= 569.27
Spot_Price:= 559.17
EMA21:= 557.06
minus_GEX:= 555.00
Neg_Trans:= 555.00
ZeroGEX:= 555.00
COTMP:= 552.84
SMA50:= 529.33
POI:= 500.00
CITMC:= 485.94
if ( ticker == "JD" and plotHLines and (timeframe.isintraday or timeframe.isdwm))
// Ticker: JD
// 0 DTE Expirations Only
COI:= 40.00
SMA50:= 31.50
CITMP:= 31.32
plus_GEX:= 30.50
Pos_Trans:= 30.50
POI:= 30.00
ZeroGEX:= 30.00
EMA21:= 29.90
COTMC:= 29.03
Neg_Trans:= 29.00
Spot_Price:= 28.44
COTMP:= 27.90
minus_GEX:= 27.50
CITMC:= 24.23
if ( ticker == "JPM" and plotHLines and (timeframe.isintraday or timeframe.isdwm))
// Ticker: JPM
// 0 DTE Expirations Only
COTMC:= 325.74
CITMP:= 324.06
Spot_Price:= 320.25
plus_GEX:= 320.00
COTMP:= 318.50
Pos_Trans:= 315.00
ZeroGEX:= 313.75
minus_GEX:= 312.50
Neg_Trans:= 312.50
EMA21:= 310.91
SMA50:= 307.00
COI:= 300.00
POI:= 300.00
CITMC:= 272.37
if ( ticker == "KRE" and plotHLines and (timeframe.isintraday or timeframe.isdwm))
// Ticker: KRE
// 0 DTE Expirations Only
CITMP:= 68.20
COTMC:= 68.16
plus_GEX:= 68.00
Spot_Price:= 67.22
COTMP:= 66.60
Pos_Trans:= 66.00
Neg_Trans:= 65.50
ZeroGEX:= 65.50
COI:= 65.00
POI:= 65.00
EMA21:= 64.24
minus_GEX:= 64.00
CITMC:= 62.25
SMA50:= 62.01
if ( ticker == "KVUE" and plotHLines and (timeframe.isintraday or timeframe.isdwm))
// Ticker: KVUE
// 0 DTE Expirations Only
CITMP:= 19.80
COI:= 18.00
plus_GEX:= 18.00
COTMC:= 17.64
Spot_Price:= 17.21
COTMP:= 17.08
Pos_Trans:= 17.00
EMA21:= 16.89
ZeroGEX:= 16.75
minus_GEX:= 16.50
Neg_Trans:= 16.50
SMA50:= 16.20
CITMC:= 16.06
POI:= 16.00
if ( ticker == "KWEB" and plotHLines and (timeframe.isintraday or timeframe.isdwm))
// Ticker: KWEB
// 0 DTE Expirations Only
COI:= 50.00
SMA50:= 38.94
CITMP:= 38.26
plus_GEX:= 38.00
EMA21:= 37.54
Pos_Trans:= 37.50
POI:= 37.00
Neg_Trans:= 37.00
ZeroGEX:= 37.00
COTMC:= 36.55
minus_GEX:= 36.00
Spot_Price:= 35.93
COTMP:= 35.59
CITMC:= 31.34
if ( ticker == "LLY" and plotHLines and (timeframe.isintraday or timeframe.isdwm))
// Ticker: LLY
// 0 DTE Expirations Only
plus_GEX:= 1100.00
COTMC:= 1093.45
Spot_Price:= 1063.60
CITMP:= 1060.79
COTMP:= 1054.33
Pos_Trans:= 1045.00
ZeroGEX:= 1042.50
Neg_Trans:= 1040.00
minus_GEX:= 1035.00
EMA21:= 1014.40
COI:= 1000.00
POI:= 1000.00
SMA50:= 939.00
CITMC:= 888.04
if ( ticker == "LMND" and plotHLines and (timeframe.isintraday or timeframe.isdwm))
// Ticker: LMND
// 0 DTE Expirations Only
COI:= 85.00
plus_GEX:= 85.00
CITMP:= 81.28
COTMC:= 80.78
Pos_Trans:= 80.00
Spot_Price:= 76.48
COTMP:= 75.63
EMA21:= 74.66
Neg_Trans:= 74.00
ZeroGEX:= 74.00
minus_GEX:= 71.00
SMA50:= 65.66
CITMC:= 49.51
POI:= 37.00
if ( ticker == "LOW" and plotHLines and (timeframe.isintraday or timeframe.isdwm))
// Ticker: LOW
// 0 DTE Expirations Only
CITMP:= 254.05
COTMC:= 252.92
COI:= 250.00
plus_GEX:= 250.00
Spot_Price:= 248.78
Pos_Trans:= 247.50
COTMP:= 246.76
minus_GEX:= 245.00
Neg_Trans:= 245.00
ZeroGEX:= 245.00
EMA21:= 242.47
SMA50:= 238.85
POI:= 230.00
CITMC:= 223.63
if ( ticker == "LRCX" and plotHLines and (timeframe.isintraday or timeframe.isdwm))
// Ticker: LRCX
// 0 DTE Expirations Only
COTMC:= 170.84
CITMP:= 170.58
COI:= 165.00
plus_GEX:= 165.00
Pos_Trans:= 165.00
Spot_Price:= 164.98
COTMP:= 164.33
minus_GEX:= 162.50
Neg_Trans:= 162.50
ZeroGEX:= 162.50
EMA21:= 158.64
POI:= 155.00
SMA50:= 152.73
CITMC:= 122.19
if ( ticker == "LULU" and plotHLines and (timeframe.isintraday or timeframe.isdwm))
// Ticker: LULU
// 0 DTE Expirations Only
CITMP:= 234.17
COTMC:= 223.08
Spot_Price:= 206.40
COTMP:= 204.78
COI:= 200.00
plus_GEX:= 200.00
Pos_Trans:= 200.00
minus_GEX:= 192.50
Neg_Trans:= 192.50
ZeroGEX:= 192.50
EMA21:= 183.92
CITMC:= 181.59
SMA50:= 174.96
POI:= 130.00
if ( ticker == "LUV" and plotHLines and (timeframe.isintraday or timeframe.isdwm))
// Ticker: LUV
// 0 DTE Expirations Only
COTMC:= 44.08
CITMP:= 42.93
Spot_Price:= 42.51
COTMP:= 42.13
plus_GEX:= 42.00
Pos_Trans:= 42.00
minus_GEX:= 41.00
Neg_Trans:= 41.00
ZeroGEX:= 41.00
EMA21:= 36.70
CITMC:= 35.93
COI:= 35.00
SMA50:= 33.66
POI:= 30.00
if ( ticker == "LVS" and plotHLines and (timeframe.isintraday or timeframe.isdwm))
// Ticker: LVS
// 0 DTE Expirations Only
plus_GEX:= 70.00
Pos_Trans:= 69.00
COTMC:= 68.37
CITMP:= 68.09
minus_GEX:= 68.00
Neg_Trans:= 68.00
ZeroGEX:= 68.00
Spot_Price:= 67.00
COTMP:= 66.48
EMA21:= 65.71
SMA50:= 60.63
CITMC:= 53.15
COI:= 52.50
POI:= 50.00
if ( ticker == "LYFT" and plotHLines and (timeframe.isintraday or timeframe.isdwm))
// Ticker: LYFT
// 0 DTE Expirations Only
COI:= 33.00
EMA21:= 21.12
SMA50:= 20.99
CITMP:= 20.45
COTMC:= 20.18
plus_GEX:= 20.00
Pos_Trans:= 20.00
Neg_Trans:= 19.50
ZeroGEX:= 19.50
Spot_Price:= 19.12
COTMP:= 18.79
minus_GEX:= 18.00
CITMC:= 15.28
POI:= 15.00
if ( ticker == "MA" and plotHLines and (timeframe.isintraday or timeframe.isdwm))
// Ticker: MA
// 0 DTE Expirations Only
plus_GEX:= 580.00
COTMC:= 577.05
CITMP:= 575.96
Spot_Price:= 570.00
COTMP:= 564.21
Pos_Trans:= 560.00
minus_GEX:= 557.50
Neg_Trans:= 557.50
ZeroGEX:= 557.50
SMA50:= 554.77
EMA21:= 550.81
COI:= 550.00
POI:= 550.00
CITMC:= 527.20
if ( ticker == "MARA" and plotHLines and (timeframe.isintraday or timeframe.isdwm))
// Ticker: MARA
// 0 DTE Expirations Only
SMA50:= 15.61
CITMP:= 15.20
EMA21:= 12.34
COI:= 12.00
POI:= 12.00
plus_GEX:= 12.00
COTMC:= 11.61
Pos_Trans:= 11.50
Neg_Trans:= 11.00
ZeroGEX:= 11.00
Spot_Price:= 10.72
COTMP:= 10.61
minus_GEX:= 10.00
CITMC:= 8.32
if ( ticker == "MDB" and plotHLines and (timeframe.isintraday or timeframe.isdwm))
// Ticker: MDB
// 0 DTE Expirations Only
COTMC:= 427.47
CITMP:= 424.08
plus_GEX:= 420.00
Pos_Trans:= 420.00
Neg_Trans:= 417.50
ZeroGEX:= 417.50
Spot_Price:= 411.28
COTMP:= 410.97
COI:= 400.00
minus_GEX:= 395.00
EMA21:= 385.02
SMA50:= 352.29
CITMC:= 313.26
POI:= 210.00
if ( ticker == "META" and plotHLines and (timeframe.isintraday or timeframe.isdwm))
// Ticker: META
// 0 DTE Expirations Only
COI:= 700.00
CITMP:= 673.08
COTMC:= 666.44
SMA50:= 666.20
plus_GEX:= 650.00
Pos_Trans:= 647.50
EMA21:= 646.33
Spot_Price:= 645.51
ZeroGEX:= 645.00
COTMP:= 638.47
Neg_Trans:= 627.50
minus_GEX:= 620.00
POI:= 600.00
CITMC:= 495.89
if ( ticker == "MP" and plotHLines and (timeframe.isintraday or timeframe.isdwm))
// Ticker: MP
// 0 DTE Expirations Only
COI:= 95.00
SMA50:= 65.35
CITMP:= 60.50
EMA21:= 59.47
plus_GEX:= 59.00
Pos_Trans:= 58.00
COTMC:= 57.57
ZeroGEX:= 57.50
Neg_Trans:= 57.00
Spot_Price:= 52.69
COTMP:= 51.92
POI:= 50.00
minus_GEX:= 50.00
CITMC:= 33.80
if ( ticker == "MRNA" and plotHLines and (timeframe.isintraday or timeframe.isdwm))
// Ticker: MRNA
// 0 DTE Expirations Only
CITMP:= 34.70
COTMC:= 34.56
COI:= 30.00
plus_GEX:= 30.00
Spot_Price:= 29.86
COTMP:= 29.12
Pos_Trans:= 28.50
minus_GEX:= 28.00
Neg_Trans:= 28.00
ZeroGEX:= 28.00
EMA21:= 26.91
SMA50:= 26.14
POI:= 26.00
CITMC:= 25.97
if ( ticker == "MRVL" and plotHLines and (timeframe.isintraday or timeframe.isdwm))
// Ticker: MRVL
// 0 DTE Expirations Only
COI:= 90.00
plus_GEX:= 90.00
Pos_Trans:= 90.00
CITMP:= 89.45
COTMC:= 89.00
ZeroGEX:= 89.00
EMA21:= 89.00
SMA50:= 88.17
Spot_Price:= 84.26
Neg_Trans:= 84.00
minus_GEX:= 83.00
COTMP:= 82.24
CITMC:= 69.44
POI:= 50.00
if ( ticker == "MS" and plotHLines and (timeframe.isintraday or timeframe.isdwm))
// Ticker: MS
// 0 DTE Expirations Only
COTMC:= 182.11
CITMP:= 181.59
plus_GEX:= 180.00
Pos_Trans:= 180.00
Spot_Price:= 178.30
minus_GEX:= 177.50
Neg_Trans:= 177.50
ZeroGEX:= 177.50
COTMP:= 177.28
EMA21:= 172.13
COI:= 170.00
SMA50:= 164.90
CITMC:= 144.02
POI:= 90.00
if ( ticker == "MSFT" and plotHLines and (timeframe.isintraday or timeframe.isdwm))
// Ticker: MSFT
// 0 DTE Expirations Only
COI:= 585.00
SMA50:= 503.82
CITMP:= 494.94
EMA21:= 487.42
COTMC:= 481.26
plus_GEX:= 480.00
Pos_Trans:= 477.50
minus_GEX:= 475.00
Neg_Trans:= 475.00
ZeroGEX:= 475.00
Spot_Price:= 473.79
COTMP:= 470.49
POI:= 460.00
CITMC:= 393.72
if ( ticker == "MSTR" and plotHLines and (timeframe.isintraday or timeframe.isdwm))
// Ticker: MSTR
// 0 DTE Expirations Only
COI:= 400.00
SMA50:= 238.76
CITMP:= 235.03
EMA21:= 190.98
plus_GEX:= 182.50
Pos_Trans:= 180.00
ZeroGEX:= 178.00
COTMC:= 176.88
Neg_Trans:= 166.00
Spot_Price:= 165.20
minus_GEX:= 165.00
COTMP:= 163.92
CITMC:= 84.12
POI:= 10.50
if ( ticker == "MU" and plotHLines and (timeframe.isintraday or timeframe.isdwm))
// Ticker: MU
// 0 DTE Expirations Only
CITMP:= 253.47
COI:= 250.00
plus_GEX:= 250.00
COTMC:= 248.09
Pos_Trans:= 240.00
Spot_Price:= 237.99
EMA21:= 237.86
Neg_Trans:= 237.50
ZeroGEX:= 237.50
COTMP:= 235.28
POI:= 230.00
minus_GEX:= 225.00
SMA50:= 223.23
CITMC:= 151.94
if ( ticker == "NBIS" and plotHLines and (timeframe.isintraday or timeframe.isdwm))
// Ticker: NBIS
// 0 DTE Expirations Only
COI:= 150.00
SMA50:= 106.45
plus_GEX:= 100.00
EMA21:= 95.30
Pos_Trans:= 94.00
ZeroGEX:= 93.00
CITMP:= 92.38
COTMC:= 91.75
Neg_Trans:= 87.00
Spot_Price:= 80.20
POI:= 80.00
minus_GEX:= 80.00
COTMP:= 78.61
CITMC:= 56.73
if ( ticker == "NEM" and plotHLines and (timeframe.isintraday or timeframe.isdwm))
// Ticker: NEM
// 0 DTE Expirations Only
CITMP:= 103.65
COTMC:= 102.32
COI:= 100.00
plus_GEX:= 100.00
Spot_Price:= 98.87
COTMP:= 98.16
Pos_Trans:= 98.00
Neg_Trans:= 94.00
ZeroGEX:= 94.00
minus_GEX:= 93.00
EMA21:= 91.65
SMA50:= 88.06
POI:= 80.00
CITMC:= 67.60
if ( ticker == "NET" and plotHLines and (timeframe.isintraday or timeframe.isdwm))
// Ticker: NET
// 0 DTE Expirations Only
COI:= 220.00
SMA50:= 213.89
CITMP:= 208.94
COTMC:= 206.28
EMA21:= 205.56
POI:= 200.00
plus_GEX:= 200.00
Pos_Trans:= 200.00
Neg_Trans:= 197.50
ZeroGEX:= 197.50
Spot_Price:= 195.95
minus_GEX:= 195.00
COTMP:= 194.08
CITMC:= 144.43
if ( ticker == "NFLX" and plotHLines and (timeframe.isintraday or timeframe.isdwm))
// Ticker: NFLX
// 0 DTE Expirations Only
SMA50:= 110.34
CITMP:= 103.01
EMA21:= 102.18
POI:= 100.00
plus_GEX:= 97.00
COTMC:= 96.08
Pos_Trans:= 95.50
Neg_Trans:= 95.00
ZeroGEX:= 95.00
minus_GEX:= 94.50
Spot_Price:= 93.75
COTMP:= 93.26
CITMC:= 47.38
COI:= 1.00
if ( ticker == "NKE" and plotHLines and (timeframe.isintraday or timeframe.isdwm))
// Ticker: NKE
// 0 DTE Expirations Only
COI:= 75.00
CITMP:= 73.15
COTMC:= 70.57
Spot_Price:= 67.81
COTMP:= 66.74
SMA50:= 65.44
EMA21:= 65.27
POI:= 65.00
plus_GEX:= 65.00
Pos_Trans:= 64.00
Neg_Trans:= 63.00
ZeroGEX:= 63.00
minus_GEX:= 62.50
CITMC:= 62.44
if ( ticker == "NNE" and plotHLines and (timeframe.isintraday or timeframe.isdwm))
// Ticker: NNE
// 0 DTE Expirations Only
POI:= 45.00
SMA50:= 40.01
CITMP:= 39.67
EMA21:= 35.08
COTMC:= 34.48
COI:= 32.00
plus_GEX:= 32.00
Pos_Trans:= 31.50
Spot_Price:= 31.35
ZeroGEX:= 31.00
COTMP:= 30.95
minus_GEX:= 30.00
Neg_Trans:= 30.00
CITMC:= 27.27
if ( ticker == "NVDA" and plotHLines and (timeframe.isintraday or timeframe.isdwm))
// Ticker: NVDA
// 0 DTE Expirations Only
COI:= 200.00
SMA50:= 186.62
CITMP:= 186.33
COTMC:= 185.90
plus_GEX:= 185.00
EMA21:= 182.41
Pos_Trans:= 177.50
Neg_Trans:= 177.00
ZeroGEX:= 177.00
Spot_Price:= 176.85
COTMP:= 175.62
minus_GEX:= 175.00
POI:= 160.00
CITMC:= 110.29
if ( ticker == "NVO" and plotHLines and (timeframe.isintraday or timeframe.isdwm))
// Ticker: NVO
// 0 DTE Expirations Only
CITMP:= 54.11
COTMC:= 52.25
SMA50:= 50.89
COI:= 50.00
plus_GEX:= 50.00
Spot_Price:= 49.84
Pos_Trans:= 49.00
COTMP:= 48.88
EMA21:= 48.77
Neg_Trans:= 47.00
ZeroGEX:= 47.00
POI:= 45.00
minus_GEX:= 45.00
CITMC:= 42.98
if ( ticker == "OKLO" and plotHLines and (timeframe.isintraday or timeframe.isdwm))
// Ticker: OKLO
// 0 DTE Expirations Only
SMA50:= 118.07
COTMC:= 108.60
CITMP:= 100.58
EMA21:= 99.12
COI:= 95.00
plus_GEX:= 95.00
Pos_Trans:= 94.00
ZeroGEX:= 93.00
Neg_Trans:= 91.00
Spot_Price:= 81.69
COTMP:= 81.21
minus_GEX:= 80.00
POI:= 65.00
CITMC:= 49.21
if ( ticker == "OKTA" and plotHLines and (timeframe.isintraday or timeframe.isdwm))
// Ticker: OKTA
// 0 DTE Expirations Only
CITMP:= 94.76
COTMC:= 93.09
COI:= 90.00
plus_GEX:= 90.00
Spot_Price:= 89.83
Pos_Trans:= 89.00
COTMP:= 88.03
minus_GEX:= 87.00
Neg_Trans:= 87.00
ZeroGEX:= 87.00
SMA50:= 86.53
EMA21:= 85.96
POI:= 85.00
CITMC:= 80.74
if ( ticker == "ONON" and plotHLines and (timeframe.isintraday or timeframe.isdwm))
// Ticker: ONON
// 0 DTE Expirations Only
CITMP:= 50.47
COI:= 50.00
plus_GEX:= 50.00
COTMC:= 49.50
Spot_Price:= 47.84
COTMP:= 47.25
Pos_Trans:= 47.00
ZeroGEX:= 46.50
EMA21:= 45.35
minus_GEX:= 45.00
Neg_Trans:= 45.00
CITMC:= 42.55
SMA50:= 42.16
POI:= 35.00
if ( ticker == "ORCL" and plotHLines and (timeframe.isintraday or timeframe.isdwm))
// Ticker: ORCL
// 0 DTE Expirations Only
COI:= 280.00
SMA50:= 245.17
EMA21:= 213.02
CITMP:= 212.22
POI:= 200.00
COTMC:= 195.47
plus_GEX:= 195.00
Pos_Trans:= 192.50
ZeroGEX:= 190.00
Neg_Trans:= 185.00
Spot_Price:= 184.87
COTMP:= 182.99
minus_GEX:= 177.50
CITMC:= 162.84
if ( ticker == "OSCR" and plotHLines and (timeframe.isintraday or timeframe.isdwm))
// Ticker: OSCR
// 0 DTE Expirations Only
COI:= 20.00
plus_GEX:= 18.00
COTMC:= 17.95
CITMP:= 17.67
SMA50:= 17.67
Pos_Trans:= 17.50
POI:= 17.00
ZeroGEX:= 17.00
EMA21:= 16.44
Neg_Trans:= 16.00
Spot_Price:= 15.90
COTMP:= 15.55
minus_GEX:= 15.50
CITMC:= 12.63
if ( ticker == "OXY" and plotHLines and (timeframe.isintraday or timeframe.isdwm))
// Ticker: OXY
// 0 DTE Expirations Only
COI:= 42.50
plus_GEX:= 42.50
CITMP:= 42.28
SMA50:= 41.84
EMA21:= 41.60
Pos_Trans:= 41.50
COTMC:= 41.03
Neg_Trans:= 41.00
ZeroGEX:= 41.00
minus_GEX:= 40.00
Spot_Price:= 39.84
COTMP:= 39.30
POI:= 35.00
CITMC:= 33.43
if ( ticker == "PANW" and plotHLines and (timeframe.isintraday or timeframe.isdwm))
// Ticker: PANW
// 0 DTE Expirations Only
COI:= 230.00
SMA50:= 204.68
plus_GEX:= 200.00
CITMP:= 195.06
EMA21:= 194.63
Pos_Trans:= 192.50
COTMC:= 190.32
Neg_Trans:= 190.00
ZeroGEX:= 190.00
Spot_Price:= 185.03
minus_GEX:= 185.00
COTMP:= 182.56
POI:= 175.00
CITMC:= 161.47
if ( ticker == "PDD" and plotHLines and (timeframe.isintraday or timeframe.isdwm))
// Ticker: PDD
// 0 DTE Expirations Only
SMA50:= 126.38
COI:= 120.00
POI:= 120.00
EMA21:= 118.10
CITMP:= 117.29
COTMC:= 111.64
minus_GEX:= 110.00
Spot_Price:= 108.77
COTMP:= 107.18
plus_GEX:= 105.00
CITMC:= 97.15
Pos_Trans:= -1.00
Neg_Trans:= -1.00
ZeroGEX:= -1.00
if ( ticker == "PEP" and plotHLines and (timeframe.isintraday or timeframe.isdwm))
// Ticker: PEP
// 0 DTE Expirations Only
CITMP:= 156.39
COI:= 155.00
COTMC:= 153.91
Spot_Price:= 151.16
COTMP:= 150.22
plus_GEX:= 150.00
Pos_Trans:= 148.00
EMA21:= 147.73
ZeroGEX:= 147.50
SMA50:= 147.36
Neg_Trans:= 147.00
minus_GEX:= 146.00
CITMC:= 144.66
POI:= 140.00
if ( ticker == "PG" and plotHLines and (timeframe.isintraday or timeframe.isdwm))
// Ticker: PG
// 0 DTE Expirations Only
COI:= 160.00
CITMP:= 152.40
plus_GEX:= 150.00
SMA50:= 147.78
COTMC:= 147.18
Pos_Trans:= 146.00
Spot_Price:= 145.64
ZeroGEX:= 145.50
minus_GEX:= 145.00
Neg_Trans:= 145.00
EMA21:= 144.75
COTMP:= 144.60
CITMC:= 140.03
POI:= 140.00
if ( ticker == "PINS" and plotHLines and (timeframe.isintraday or timeframe.isdwm))
// Ticker: PINS
// 0 DTE Expirations Only
SMA50:= 29.21
COI:= 29.00
CITMP:= 28.34
POI:= 27.00
minus_GEX:= 27.00
EMA21:= 26.97
COTMC:= 26.50
Spot_Price:= 25.66
COTMP:= 25.17
CITMC:= 24.72
plus_GEX:= 24.00
Pos_Trans:= -1.00
Neg_Trans:= -1.00
ZeroGEX:= -1.00
if ( ticker == "PLTR" and plotHLines and (timeframe.isintraday or timeframe.isdwm))
// Ticker: PLTR
// 0 DTE Expirations Only
COI:= 200.00
CITMP:= 195.42
plus_GEX:= 192.50
COTMC:= 192.48
Pos_Trans:= 185.00
ZeroGEX:= 182.50
Spot_Price:= 181.50
COTMP:= 179.90
SMA50:= 179.66
EMA21:= 178.28
Neg_Trans:= 177.50
POI:= 170.00
minus_GEX:= 170.00
CITMC:= 109.63
if ( ticker == "PM" and plotHLines and (timeframe.isintraday or timeframe.isdwm))
// Ticker: PM
// 0 DTE Expirations Only
CITMP:= 167.36
plus_GEX:= 165.00
COTMC:= 161.84
COI:= 160.00
Pos_Trans:= 160.00
Spot_Price:= 158.84
COTMP:= 157.70
Neg_Trans:= 157.50
ZeroGEX:= 157.50
minus_GEX:= 155.00
SMA50:= 153.66
EMA21:= 152.97
POI:= 145.00
CITMC:= 138.65
if ( ticker == "PYPL" and plotHLines and (timeframe.isintraday or timeframe.isdwm))
// Ticker: PYPL
// 0 DTE Expirations Only
COI:= 72.50
CITMP:= 68.05
SMA50:= 65.87
COTMC:= 64.19
plus_GEX:= 63.00
Pos_Trans:= 62.50
EMA21:= 62.28
Neg_Trans:= 62.00
ZeroGEX:= 62.00
Spot_Price:= 61.71
COTMP:= 60.84
POI:= 60.00
minus_GEX:= 60.00
CITMC:= 55.46
if ( ticker == "QCOM" and plotHLines and (timeframe.isintraday or timeframe.isdwm))
// Ticker: QCOM
// 0 DTE Expirations Only
COTMC:= 184.91
CITMP:= 183.01
COI:= 180.00
plus_GEX:= 180.00
Spot_Price:= 179.00
Pos_Trans:= 177.50
COTMP:= 176.62
POI:= 175.00
minus_GEX:= 175.00
Neg_Trans:= 175.00
ZeroGEX:= 175.00
EMA21:= 173.96
SMA50:= 171.01
CITMC:= 162.40
if ( ticker == "QUBT" and plotHLines and (timeframe.isintraday or timeframe.isdwm))
// Ticker: QUBT
// 0 DTE Expirations Only
COI:= 15.00
SMA50:= 14.54
plus_GEX:= 14.00
CITMP:= 13.58
COTMC:= 13.51
EMA21:= 12.37
Pos_Trans:= 11.50
POI:= 11.00
minus_GEX:= 11.00
Neg_Trans:= 11.00
ZeroGEX:= 11.00
Spot_Price:= 10.92
COTMP:= 10.62
CITMC:= 9.18
if ( ticker == "RBLX" and plotHLines and (timeframe.isintraday or timeframe.isdwm))
// Ticker: RBLX
// 0 DTE Expirations Only
SMA50:= 109.89
COI:= 100.00
CITMP:= 97.75
EMA21:= 96.37
plus_GEX:= 90.00
Pos_Trans:= 90.00
COTMC:= 89.56
Neg_Trans:= 89.00
ZeroGEX:= 89.00
Spot_Price:= 86.44
COTMP:= 85.50
minus_GEX:= 85.00
CITMC:= 67.16
POI:= 60.00
if ( ticker == "RCL" and plotHLines and (timeframe.isintraday or timeframe.isdwm))
// Ticker: RCL
// 0 DTE Expirations Only
CITMP:= 309.46
COTMC:= 297.73
Spot_Price:= 289.97
COTMP:= 288.15
minus_GEX:= 282.50
COI:= 280.00
plus_GEX:= 280.00
SMA50:= 279.31
EMA21:= 267.46
CITMC:= 224.57
POI:= 45.00
Pos_Trans:= -1.00
Neg_Trans:= -1.00
ZeroGEX:= -1.00
if ( ticker == "RDDT" and plotHLines and (timeframe.isintraday or timeframe.isdwm))
// Ticker: RDDT
// 0 DTE Expirations Only
COI:= 250.00
plus_GEX:= 235.00
CITMP:= 233.01
COTMC:= 231.95
Pos_Trans:= 230.00
EMA21:= 218.54
Spot_Price:= 217.16
minus_GEX:= 215.00
Neg_Trans:= 215.00
ZeroGEX:= 215.00
COTMP:= 210.02
SMA50:= 206.49
POI:= 190.00
CITMC:= 169.53
if ( ticker == "RGTI" and plotHLines and (timeframe.isintraday or timeframe.isdwm))
// Ticker: RGTI
// 0 DTE Expirations Only
COI:= 36.00
SMA50:= 34.45
CITMP:= 28.77
plus_GEX:= 28.00
Pos_Trans:= 28.00
COTMC:= 27.92
EMA21:= 27.37
ZeroGEX:= 26.00
Neg_Trans:= 25.00
Spot_Price:= 23.53
COTMP:= 23.04
POI:= 20.00
minus_GEX:= 20.00
CITMC:= 13.69
if ( ticker == "RIOT" and plotHLines and (timeframe.isintraday or timeframe.isdwm))
// Ticker: RIOT
// 0 DTE Expirations Only
SMA50:= 17.78
CITMP:= 16.36
EMA21:= 15.40
COTMC:= 14.57
minus_GEX:= 14.50
COI:= 14.00
plus_GEX:= 14.00
Spot_Price:= 13.75
COTMP:= 13.42
POI:= 13.00
CITMC:= 10.94
Pos_Trans:= -1.00
Neg_Trans:= -1.00
ZeroGEX:= -1.00
if ( ticker == "RIVN" and plotHLines and (timeframe.isintraday or timeframe.isdwm))
// Ticker: RIVN
// 0 DTE Expirations Only
COI:= 20.00
plus_GEX:= 20.00
COTMC:= 19.86
CITMP:= 19.69
Spot_Price:= 18.70
Pos_Trans:= 18.50
COTMP:= 18.41
minus_GEX:= 18.00
Neg_Trans:= 18.00
ZeroGEX:= 18.00
EMA21:= 16.85
CITMC:= 15.15
SMA50:= 15.02
POI:= 7.50
if ( ticker == "RKLB" and plotHLines and (timeframe.isintraday or timeframe.isdwm))
// Ticker: RKLB
// 0 DTE Expirations Only
COI:= 80.00
COTMC:= 60.22
CITMP:= 59.70
SMA50:= 55.19
plus_GEX:= 55.00
Pos_Trans:= 55.00
Spot_Price:= 54.45
Neg_Trans:= 54.00
ZeroGEX:= 54.00
COTMP:= 53.81
minus_GEX:= 53.00
EMA21:= 51.48
POI:= 40.00
CITMC:= 31.61
if ( ticker == "RKT" and plotHLines and (timeframe.isintraday or timeframe.isdwm))
// Ticker: RKT
// 0 DTE Expirations Only
CITMP:= 21.62
COTMC:= 19.05
EMA21:= 18.62
POI:= 18.50
minus_GEX:= 18.50
Spot_Price:= 18.25
COI:= 18.00
plus_GEX:= 18.00
COTMP:= 17.98
SMA50:= 17.57
CITMC:= 16.10
Pos_Trans:= -1.00
Neg_Trans:= -1.00
ZeroGEX:= -1.00
if ( ticker == "ROKU" and plotHLines and (timeframe.isintraday or timeframe.isdwm))
// Ticker: ROKU
// 0 DTE Expirations Only
COTMC:= 118.79
CITMP:= 116.40
plus_GEX:= 115.00
Spot_Price:= 114.36
COTMP:= 113.13
Pos_Trans:= 107.00
ZeroGEX:= 106.50
minus_GEX:= 106.00
Neg_Trans:= 106.00
EMA21:= 101.18
COI:= 100.00
SMA50:= 99.45
CITMC:= 94.64
POI:= 90.00
if ( ticker == "SE" and plotHLines and (timeframe.isintraday or timeframe.isdwm))
// Ticker: SE
// 0 DTE Expirations Only
SMA50:= 151.02
EMA21:= 134.41
CITMP:= 133.93
COI:= 130.00
plus_GEX:= 130.00
Pos_Trans:= 128.00
COTMC:= 125.16
Neg_Trans:= 124.00
ZeroGEX:= 124.00
Spot_Price:= 121.61
COTMP:= 120.71
minus_GEX:= 120.00
CITMC:= 82.12
POI:= 30.00
if ( ticker == "SEDG" and plotHLines and (timeframe.isintraday or timeframe.isdwm))
// Ticker: SEDG
// 0 DTE Expirations Only
SMA50:= 35.86
COI:= 35.00
CITMP:= 34.25
EMA21:= 32.69
plus_GEX:= 32.50
Pos_Trans:= 32.50
ZeroGEX:= 32.00
COTMC:= 31.68
Neg_Trans:= 30.00
Spot_Price:= 29.12
COTMP:= 28.46
minus_GEX:= 27.50
POI:= 22.50
CITMC:= 21.97
if ( ticker == "SLV" and plotHLines and (timeframe.isintraday or timeframe.isdwm))
// Ticker: SLV
// 0 DTE Expirations Only
CITMP:= 61.16
COI:= 60.00
COTMC:= 58.61
plus_GEX:= 58.00
Pos_Trans:= 58.00
Neg_Trans:= 57.50
ZeroGEX:= 57.50
Spot_Price:= 57.39
COTMP:= 57.20
minus_GEX:= 57.00
EMA21:= 51.97
SMA50:= 47.47
POI:= 47.00
CITMC:= 46.52
if ( ticker == "SMCI" and plotHLines and (timeframe.isintraday or timeframe.isdwm))
// Ticker: SMCI
// 0 DTE Expirations Only
SMA50:= 42.88
CITMP:= 39.12
EMA21:= 35.16
COTMC:= 34.63
COI:= 34.50
plus_GEX:= 34.50
Pos_Trans:= 32.50
Neg_Trans:= 32.00
ZeroGEX:= 32.00
Spot_Price:= 31.04
COTMP:= 30.57
minus_GEX:= 30.00
POI:= 23.00
CITMC:= 22.45
if ( ticker == "SMR" and plotHLines and (timeframe.isintraday or timeframe.isdwm))
// Ticker: SMR
// 0 DTE Expirations Only
SMA50:= 30.86
CITMP:= 23.51
EMA21:= 21.99
COI:= 20.50
plus_GEX:= 20.50
Pos_Trans:= 20.50
ZeroGEX:= 20.00
COTMC:= 19.18
Neg_Trans:= 18.00
Spot_Price:= 17.14
COTMP:= 16.91
POI:= 16.00
minus_GEX:= 16.00
CITMC:= 12.88
if ( ticker == "SNOW" and plotHLines and (timeframe.isintraday or timeframe.isdwm))
// Ticker: SNOW
// 0 DTE Expirations Only
SMA50:= 249.46
EMA21:= 236.90
COI:= 230.00
CITMP:= 226.74
COTMC:= 221.09
plus_GEX:= 220.00
Pos_Trans:= 215.00
Spot_Price:= 213.73
Neg_Trans:= 212.50
ZeroGEX:= 212.50
COTMP:= 210.07
minus_GEX:= 210.00
POI:= 200.00
CITMC:= 182.64
if ( ticker == "SOFI" and plotHLines and (timeframe.isintraday or timeframe.isdwm))
// Ticker: SOFI
// 0 DTE Expirations Only
COI:= 30.00
plus_GEX:= 28.50
SMA50:= 28.25
EMA21:= 27.76
CITMP:= 27.55
Pos_Trans:= 27.50
COTMC:= 27.39
Neg_Trans:= 27.00
ZeroGEX:= 27.00
POI:= 26.00
minus_GEX:= 26.00
Spot_Price:= 25.70
COTMP:= 25.35
CITMC:= 16.37
if ( ticker == "SOUN" and plotHLines and (timeframe.isintraday or timeframe.isdwm))
// Ticker: SOUN
// 0 DTE Expirations Only
SMA50:= 15.02
CITMP:= 13.33
EMA21:= 12.40
COI:= 12.00
plus_GEX:= 12.00
COTMC:= 11.88
Pos_Trans:= 11.50
Neg_Trans:= 11.00
ZeroGEX:= 11.00
Spot_Price:= 10.70
COTMP:= 10.49
POI:= 9.50
minus_GEX:= 9.50
CITMC:= 7.28
if ( ticker == "SPOT" and plotHLines and (timeframe.isintraday or timeframe.isdwm))
// Ticker: SPOT
// 0 DTE Expirations Only
COI:= 720.00
SMA50:= 631.22
CITMP:= 614.69
EMA21:= 596.21
COTMC:= 595.25
plus_GEX:= 590.00
Pos_Trans:= 587.50
Neg_Trans:= 585.00
ZeroGEX:= 585.00
Spot_Price:= 575.68
COTMP:= 569.28
POI:= 550.00
minus_GEX:= 550.00
CITMC:= 441.07
if ( ticker == "TGT" and plotHLines and (timeframe.isintraday or timeframe.isdwm))
// Ticker: TGT
// 0 DTE Expirations Only
CITMP:= 106.33
COI:= 105.00
COTMC:= 101.29
plus_GEX:= 101.00
Spot_Price:= 97.48
COTMP:= 96.23
Pos_Trans:= 93.00
EMA21:= 92.52
minus_GEX:= 92.00
Neg_Trans:= 92.00
ZeroGEX:= 92.00
SMA50:= 91.17
CITMC:= 89.49
POI:= 85.00
if ( ticker == "TLT" and plotHLines and (timeframe.isintraday or timeframe.isdwm))
// Ticker: TLT
// 0 DTE Expirations Only
CITMP:= 90.43
SMA50:= 89.78
EMA21:= 88.72
COI:= 88.00
plus_GEX:= 88.00
COTMC:= 87.91
POI:= 87.50
Pos_Trans:= 87.50
Spot_Price:= 87.30
COTMP:= 87.02
minus_GEX:= 87.00
Neg_Trans:= 87.00
ZeroGEX:= 87.00
CITMC:= 83.88
if ( ticker == "TMUS" and plotHLines and (timeframe.isintraday or timeframe.isdwm))
// Ticker: TMUS
// 0 DTE Expirations Only
COI:= 220.00
CITMP:= 215.66
SMA50:= 213.52
plus_GEX:= 210.00
Pos_Trans:= 210.00
ZeroGEX:= 207.50
COTMC:= 205.56
EMA21:= 204.89
Spot_Price:= 197.98
COTMP:= 196.21
minus_GEX:= 195.00
Neg_Trans:= 195.00
POI:= 190.00
CITMC:= 172.62
if ( ticker == "TSLA" and plotHLines and (timeframe.isintraday or timeframe.isdwm))
// Ticker: TSLA
// 0 DTE Expirations Only
CITMP:= 517.79
COTMC:= 516.95
COI:= 500.00
plus_GEX:= 500.00
Spot_Price:= 473.32
COTMP:= 467.86
Pos_Trans:= 445.00
Neg_Trans:= 442.50
ZeroGEX:= 442.50
EMA21:= 441.19
SMA50:= 436.49
minus_GEX:= 435.00
CITMC:= 318.03
POI:= 170.00
if ( ticker == "TSM" and plotHLines and (timeframe.isintraday or timeframe.isdwm))
// Ticker: TSM
// 0 DTE Expirations Only
COI:= 300.00
plus_GEX:= 300.00
COTMC:= 298.01
CITMP:= 297.23
EMA21:= 293.56
SMA50:= 293.52
Pos_Trans:= 292.50
Neg_Trans:= 290.00
ZeroGEX:= 290.00
Spot_Price:= 288.28
COTMP:= 287.03
minus_GEX:= 285.00
CITMC:= 226.14
POI:= 180.00
if ( ticker == "TTD" and plotHLines and (timeframe.isintraday or timeframe.isdwm))
// Ticker: TTD
// 0 DTE Expirations Only
SMA50:= 45.42
CITMP:= 44.59
COI:= 40.00
EMA21:= 39.86
COTMC:= 39.70
plus_GEX:= 39.00
Pos_Trans:= 38.00
Neg_Trans:= 37.50
ZeroGEX:= 37.50
Spot_Price:= 36.22
COTMP:= 35.28
POI:= 35.00
minus_GEX:= 35.00
CITMC:= 32.67
if ( ticker == "TXN" and plotHLines and (timeframe.isintraday or timeframe.isdwm))
// Ticker: TXN
// 0 DTE Expirations Only
CITMP:= 188.37
COTMC:= 183.62
Spot_Price:= 178.03
COTMP:= 176.05
COI:= 175.00
plus_GEX:= 175.00
EMA21:= 173.64
SMA50:= 169.57
CITMC:= 166.97
Pos_Trans:= 162.50
minus_GEX:= 160.00
Neg_Trans:= 160.00
ZeroGEX:= 160.00
POI:= 145.00
if ( ticker == "U" and plotHLines and (timeframe.isintraday or timeframe.isdwm))
// Ticker: U
// 0 DTE Expirations Only
COI:= 50.00
plus_GEX:= 50.00
Pos_Trans:= 49.00
ZeroGEX:= 48.25
CITMP:= 47.99
COTMC:= 47.55
Neg_Trans:= 47.50
minus_GEX:= 47.00
Spot_Price:= 45.09
COTMP:= 44.44
EMA21:= 44.23
SMA50:= 39.94
POI:= 35.00
CITMC:= 34.77
if ( ticker == "UAL" and plotHLines and (timeframe.isintraday or timeframe.isdwm))
// Ticker: UAL
// 0 DTE Expirations Only
CITMP:= 112.24
COTMC:= 111.77
Spot_Price:= 107.76
COTMP:= 106.65
COI:= 105.00
plus_GEX:= 105.00
Pos_Trans:= 105.00
minus_GEX:= 104.00
Neg_Trans:= 104.00
ZeroGEX:= 104.00
EMA21:= 102.77
SMA50:= 98.83
POI:= 95.00
CITMC:= 82.49
if ( ticker == "UBER" and plotHLines and (timeframe.isintraday or timeframe.isdwm))
// Ticker: UBER
// 0 DTE Expirations Only
COI:= 100.00
SMA50:= 91.68
EMA21:= 87.98
CITMP:= 86.91
COTMC:= 84.43
plus_GEX:= 84.00
Pos_Trans:= 84.00
ZeroGEX:= 83.50
Neg_Trans:= 83.00
Spot_Price:= 82.10
COTMP:= 81.14
minus_GEX:= 80.00
CITMC:= 66.77
POI:= 50.00
if ( ticker == "UNG" and plotHLines and (timeframe.isintraday or timeframe.isdwm))
// Ticker: UNG
// 0 DTE Expirations Only
EMA21:= 14.14
CITMP:= 14.00
SMA50:= 13.68
COI:= 13.00
plus_GEX:= 13.00
Pos_Trans:= 13.00
POI:= 12.50
minus_GEX:= 12.50
Neg_Trans:= 12.50
ZeroGEX:= 12.50
COTMC:= 12.46
Spot_Price:= 12.13
COTMP:= 12.00
CITMC:= 10.91
if ( ticker == "UNH" and plotHLines and (timeframe.isintraday or timeframe.isdwm))
// Ticker: UNH
// 0 DTE Expirations Only
COI:= 400.00
CITMP:= 365.20
COTMC:= 357.03
plus_GEX:= 350.00
SMA50:= 340.09
Spot_Price:= 339.13
COTMP:= 332.70
Pos_Trans:= 332.50
EMA21:= 331.32
minus_GEX:= 330.00
Neg_Trans:= 330.00
ZeroGEX:= 330.00
POI:= 300.00
CITMC:= 288.85
if ( ticker == "UPS" and plotHLines and (timeframe.isintraday or timeframe.isdwm))
// Ticker: UPS
// 0 DTE Expirations Only
CITMP:= 111.10
COTMC:= 103.16
Spot_Price:= 100.13
COI:= 100.00
plus_GEX:= 100.00
COTMP:= 98.81
EMA21:= 96.46
Pos_Trans:= 95.00
CITMC:= 94.47
minus_GEX:= 94.00
Neg_Trans:= 94.00
ZeroGEX:= 94.00
SMA50:= 92.48
POI:= 75.00
if ( ticker == "UPST" and plotHLines and (timeframe.isintraday or timeframe.isdwm))
// Ticker: UPST
// 0 DTE Expirations Only
CITMP:= 55.72
COI:= 50.00
plus_GEX:= 50.00
Pos_Trans:= 49.00
COTMC:= 48.76
Spot_Price:= 45.60
SMA50:= 45.49
EMA21:= 45.15
COTMP:= 44.68
ZeroGEX:= 44.50
Neg_Trans:= 40.50
POI:= 40.00
minus_GEX:= 40.00
CITMC:= 36.85
if ( ticker == "USO" and plotHLines and (timeframe.isintraday or timeframe.isdwm))
// Ticker: USO
// 0 DTE Expirations Only
COI:= 71.00
CITMP:= 70.90
SMA50:= 70.79
EMA21:= 70.24
POI:= 70.00
plus_GEX:= 69.00
Pos_Trans:= 69.00
ZeroGEX:= 68.50
Neg_Trans:= 68.00
COTMC:= 67.67
minus_GEX:= 67.00
Spot_Price:= 66.98
COTMP:= 66.43
CITMC:= 64.57
if ( ticker == "UUUU" and plotHLines and (timeframe.isintraday or timeframe.isdwm))
// Ticker: UUUU
// 0 DTE Expirations Only
COI:= 35.00
SMA50:= 17.53
CITMP:= 16.36
COTMC:= 16.12
plus_GEX:= 16.00
Pos_Trans:= 15.50
EMA21:= 15.28
POI:= 15.00
minus_GEX:= 15.00
Neg_Trans:= 15.00
ZeroGEX:= 15.00
Spot_Price:= 13.70
COTMP:= 13.30
CITMC:= 9.13
if ( ticker == "UVXY" and plotHLines and (timeframe.isintraday or timeframe.isdwm))
// Ticker: UVXY
// 0 DTE Expirations Only
COI:= 75.00
SMA50:= 52.57
CITMP:= 50.98
EMA21:= 47.85
plus_GEX:= 45.00
COTMC:= 44.81
Spot_Price:= 42.41
Pos_Trans:= 42.00
COTMP:= 41.61
Neg_Trans:= 41.50
ZeroGEX:= 41.50
POI:= 40.00
minus_GEX:= 40.00
CITMC:= 39.87
if ( ticker == "V" and plotHLines and (timeframe.isintraday or ti


