Bollinger Bounce Reversal Strategy – Visual EditionOverview:
The Bollinger Bounce Reversal Strategy – Visual Edition is designed to capture potential reversal moves at price extremes—often termed “bounce points”—by using a combination of technical indicators. The strategy integrates Bollinger Bands, MACD, and volume analysis, and it provides rich on‑chart visual cues to help traders understand its signals and conditions. Additionally, the strategy enforces a maximum of 5 trades per day and uses fixed risk management parameters. This publication is intended for educational purposes and offers a systematic, transparent approach that you can further adjust to fit your market or risk profile.
How It Works:
Bollinger Bands:
A 20‑period simple moving average (SMA) and a user‑defined standard deviation multiplier (default 2.0) are used to calculate the Bollinger Bands.
When the price reaches or crosses these bands (i.e. falls below the lower band or rises above the upper band), it suggests that the price is in an extreme, potentially oversold or overbought, state.
MACD Filter:
The MACD (calculated with standard lengths, e.g. 12, 26, 9) provides momentum information.
For a bullish (long) signal, the MACD line should be above its signal line; for a bearish (short) signal, the MACD line should be below.
Volume Confirmation:
The strategy uses a 20‑period volume moving average to determine if current volume is strong enough to validate a signal.
A signal is confirmed only if the current volume is at or above a specified multiple (by default, 1.0×) of this moving average, ensuring that the move is supported by increased market participation.
Visual Cues:
Bollinger Bands and Fill: The basis (SMA), upper, and lower Bollinger Bands are plotted, and the area between the upper and lower bands is filled with a semi‑transparent color.
Signal Markers: When a long or short signal is generated, corresponding markers (labels) appear on the chart.
Background Coloring: The chart’s background changes color (green for long signals and red for short signals) on the bars where signals occur.
Information Table: An on‑chart table displays key indicator values (MACD, signal line, volume, average volume) and the number of trades executed that day.
Entry Conditions:
Long Entry:
A long trade is triggered when the previous bar’s close is below the lower Bollinger Band and the current bar’s close crosses above it, combined with a bullish MACD condition and strong volume.
Short Entry:
A short trade is triggered when the previous bar’s close is above the upper Bollinger Band and the current bar’s close crosses below it, with a bearish MACD condition and high volume.
Risk Management:
Daily Trade Limit: The strategy restricts trading to no more than 5 trades per day.
Stop-Loss and Take-Profit:
For each position, a stop loss is set at a fixed percentage away from the entry price (typically 2%), and a take profit is set to target a 1:2 risk-reward ratio (typically 4% from the entry price).
Backtesting Setup:
Initial Capital: $10,000
Commission: 0.1% per trade
Slippage: 1 tick per bar
These realistic parameters help ensure that backtesting results reflect the conditions of an average trader.
Disclaimer:
Past performance is not indicative of future results. This strategy is experimental and provided solely for educational purposes. It is essential to backtest extensively and paper trade before any live deployment. All risk management practices are advisory, and you should adjust parameters to suit your own trading style and risk tolerance.
Conclusion:
By combining Bollinger Bands, MACD, and volume analysis, the Bollinger Bounce Reversal Strategy – Visual Edition provides a clear, systematic method to identify potential reversal opportunities at price extremes. The added visual cues help traders quickly interpret signals and assess market conditions, while strict risk management and a daily trade cap help keep trading disciplined. Adjust and refine the settings as needed to better suit your specific market and risk profile.
Pattern

Volatility Momentum Breakout StrategyDescription:
Overview:
The Volatility Momentum Breakout Strategy is designed to capture significant price moves by combining a volatility breakout approach with trend and momentum filters. This strategy dynamically calculates breakout levels based on market volatility and uses these levels along with trend and momentum conditions to identify trade opportunities.
How It Works:
1. Volatility Breakout:
• Methodology:
The strategy computes the highest high and lowest low over a defined lookback period (excluding the current bar to avoid look-ahead bias). A multiple of the Average True Range (ATR) is then added to (or subtracted from) these levels to form dynamic breakout thresholds.
• Purpose:
This method helps capture significant price movements (breakouts) while ensuring that only past data is used, thereby maintaining realistic signal generation.
2. Trend Filtering:
• Methodology:
A short-term Exponential Moving Average (EMA) is applied to determine the prevailing trend.
• Purpose:
Long trades are considered only when the current price is above the EMA, indicating an uptrend, while short trades are taken only when the price is below the EMA, indicating a downtrend.
3. Momentum Confirmation:
• Methodology:
The Relative Strength Index (RSI) is used to gauge market momentum.
• Purpose:
For long entries, the RSI must be above a mid-level (e.g., above 50) to confirm upward momentum, and for short entries, it must be below a similar threshold. This helps filter out signals during overextended conditions.
Entry Conditions:
• Long Entry:
A long position is triggered when the current closing price exceeds the calculated long breakout level, the price is above the short-term EMA, and the RSI confirms momentum (e.g., above 50).
• Short Entry:
A short position is triggered when the closing price falls below the calculated short breakout level, the price is below the EMA, and the RSI confirms momentum (e.g., below 50).
Risk Management:
• Position Sizing:
Trades are sized to risk a fixed percentage of account equity (set here to 5% per trade in the code, with each trade’s stop loss defined so that risk is limited to approximately 2% of the entry price).
• Stop Loss & Take Profit:
A stop loss is placed a fixed ATR multiple away from the entry price, and a take profit target is set to achieve a 1:2 risk-reward ratio.
• Realistic Backtesting:
The strategy is backtested using an initial capital of $10,000, with a commission of 0.1% per trade and slippage of 1 tick per bar—parameters chosen to reflect conditions faced by the average trader.
Important Disclaimers:
• No Look-Ahead Bias:
All breakout levels are calculated using only past data (excluding the current bar) to ensure that the strategy does not “peek” into future data.
• Educational Purpose:
This strategy is experimental and provided solely for educational purposes. Past performance is not indicative of future results.
• User Responsibility:
Traders should thoroughly backtest and paper trade the strategy under various market conditions and adjust parameters to fit their own risk tolerance and trading style before live deployment.
Conclusion:
By integrating volatility-based breakout signals with trend and momentum filters, the Volatility Momentum Breakout Strategy offers a unique method to capture significant price moves in a disciplined manner. This publication provides a transparent explanation of the strategy’s components and realistic backtesting parameters, making it a useful tool for educational purposes and further customization by the TradingView community.

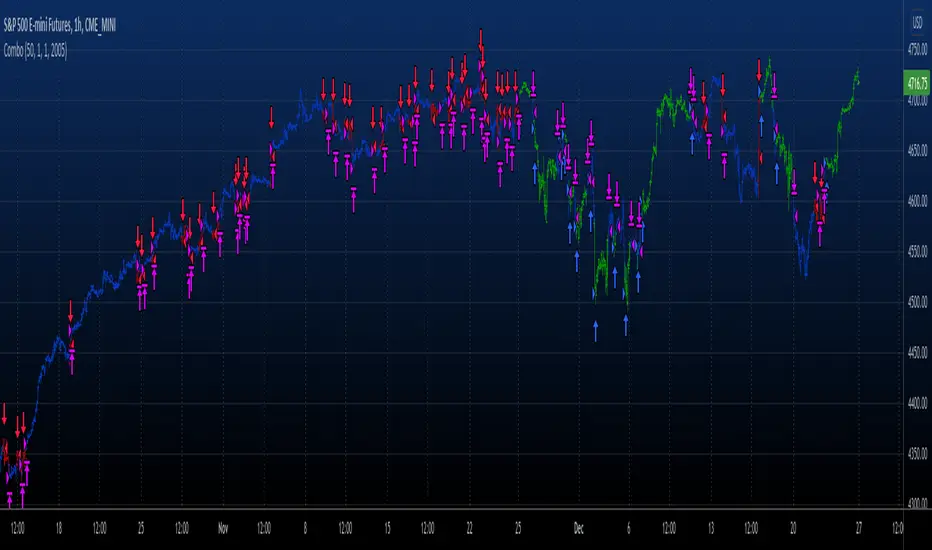
Combo 2/20 EMA & 3 Day Pattern This is combo strategies for get a cumulative signal.
First strategy
This indicator plots 2/20 exponential moving average. For the Mov
Avg X 2/20 Indicator, the EMA bar will be painted when the Alert criteria is met.
Second strategy
This startegy based on 3-day pattern reversal described in "Are Three-Bar
Patterns Reliable For Stocks" article by Thomas Bulkowski, presented in
January,2000 issue of Stocks&Commodities magazine.
That pattern conforms to the following rules:
- It uses daily prices, not intraday or weekly prices;
- The middle day of the three-day pattern has the lowest low of the three days, with no ties allowed;
- The last day must have a close above the prior day's high, with no ties allowed;
- Each day must have a nonzero trading range.
WARNING:
- For purpose educate only
- This script to change bars colors.
Engulfing strategy with DMI confirmationThe strategy contains Bearish and Bullish Engulfing trend reverse alerts with entry and closure notifications. Entries are enforced by Directional Movement Index (DMI) indicator levels combination. The strategy can be applied to spot, futures and marginal trading exchanges. It is suitable for both long and short positions and works accurately with BTC, USDT, ETH and BNB quote currencies. Best to use with 1H timeframe charts
Strategy elements can be configured at your own desire with user interface settings, no programming skills required:
1. Choose signals type: Long, Short or Both
2. Choose trend detection pattern rule:
SMA50 - provides a higher number of positions
SMA50 + SMA200 provides a higher accuracy
3. Change risk management settings to make the most accurate and efficient configuration. You can set up unique stop loss, take profit and trailing offset for different assets
4. Configure strategy periods
DMI and ADX lengths
ADX Smoothing
Key level
EMA and SMA lengths
5. Configure backtest dates
6. Show or hide RSI support and resistance bands
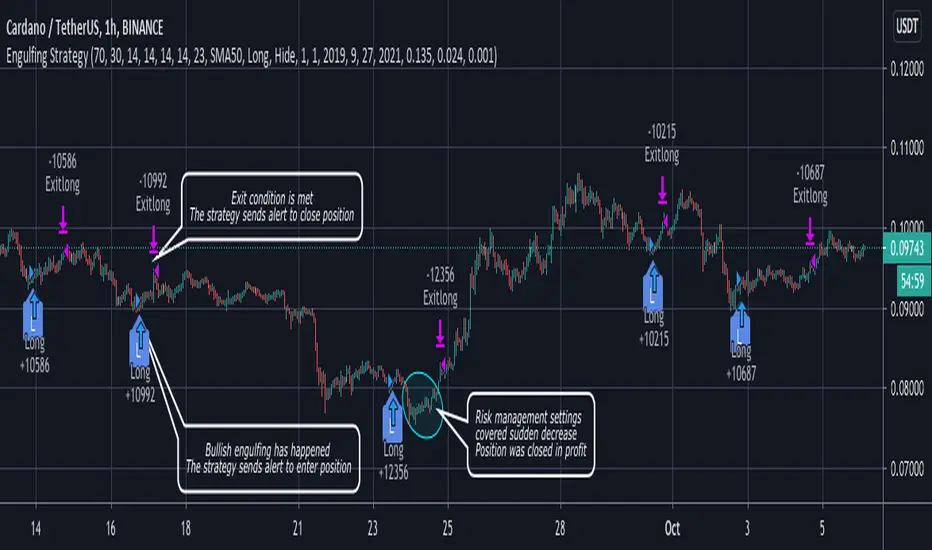
Engulfing strategy provides information for traders to enter the market in anticipation of a possible reversal in trend. Engulfing candles tend to signal a reversal of the current trend in the market. This specific pattern involves two candles with the latter candle "engulfing" the entire body of the candle before it. The engulfing candle can be bullish or bearish depending on where it forms in relation to the existing trend. The script calculates and compares values of the price action candles to define is there an engulfing and what type it is: bullish or bearish
If there is a bullish engulfing the indicator fills price action candle with yellow color
If there is a bearish engulfing the indicator fills price action candle with purple color
Advantages of the script:
1. The script detects presence of both types of engulfing: Bullish and Bearish
2. Weak engulfment signals and market noises are filtered by RSI bands and DMI confirmations. This allows to receive only strong and confirmed engulfment signals
3. This script has configurable risk management settings (order size, commission, take profit, stop loss and trailing). This provides you opportunity of direct broker connection and allows to conduct backtests before applying the strategy to real account. You also can set up strategy actions alerts
At the chart you can see the historical price action of ADAUSDT at Binance exchange from the January 1st 2019 till current date. The strategy is set up to receive only long signals because it is a spot market. Moments when the strategy triggered to enter a position are shown as L label while position entries are shown as "Long" messages. Moments when a certain position should be closed are shown as "Exitlong" messages
The strategy demonstrate high backtest results:
Mathematical expectation of risk management settings is positive = 1.34%
Percent profitable = 93.33%
Profit factor = 3.253
Quantity of entries = 75
Net profit = 15.22%
How to use?
Long signals:
1. Apply indicator to a trading pair your are interested in.
2. Click Settings button and select Alert Positions Type Long
3. Once bullish engulfing and confirmation conditions are met price action candle will be colored yellow and script strategy will enter a position.
4. Check Strategy Tester to set up optimal Risk management settings: stop loss, trailing profit activation point, trailing offset
5. Set up the strategy alert to be notified when a position should be opened or closed
Short signals:
1. Apply indicator to a trading pair your are interested in.
2. Click Settings button and select Alert Positions Type Short
3. Once bearish engulfing and confirmation conditions are met price action candle will be colored purple and script strategy will enter a position.
4. Check Strategy Tester to set up optimal Risk management settings: stop loss, trailing profit activation point, trailing offset
5. Set up the strategy alert to be notified when a position should be opened or closed
Best regards,
SkyRock Signals team
If you want to receive access to the strategy please contact us in personal message!
triangle pattern strategy (lirshah)the triangle strategy is based on price action which plots a triangle pattern, in upward trends it plots green colored upward triangle, while in downward trend , red bearish triangle will be plotted.
the strategy can be applied on both manual and automated trading.
the user friend and simplicity is the future of this strategy.
the standard parameter are as below:
reverse factor: 2
reverse length:1
creep period:20
slope factor: 100
shift: 1
the results of 1 contract and 3$ commission per order is as below.
in order to access script contact me directly on trading view.

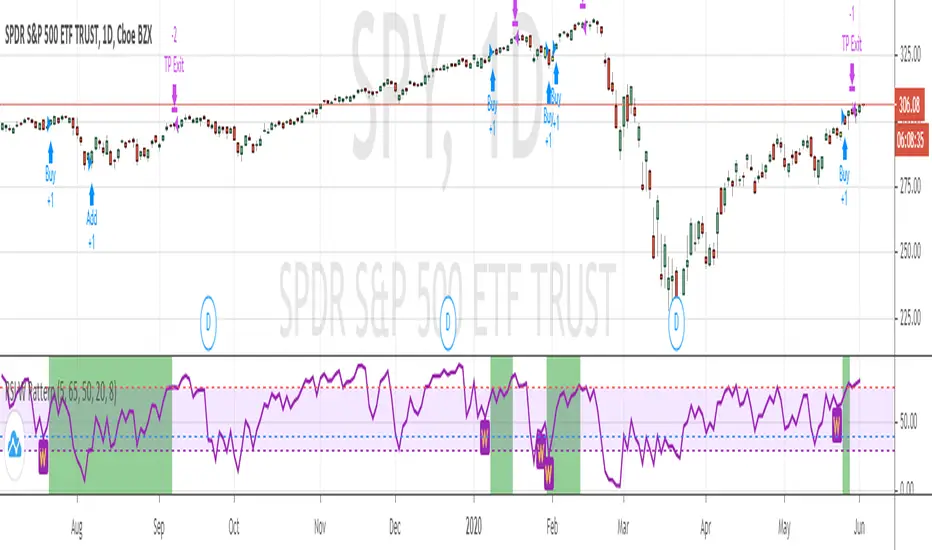
RSI W Pattern strategyThis strategy is similar to RSI V pattern strategy, but it looks for W pattern in RSI chart.
RULES
======
BUY
1. ema20 is above ema50
2. RSI5 crossing up 30 from oversold area
3. and RSI5 must be below overbought area (default value set to 65)
Add to existing Position
1. You can add on the next W pattern OR
2. if RSI5 is crossing up from below 20
Exit
1. when RSI5 reaches 75
Note: This is for short term/swing trading . which gets on when price dip in trending and quickly gets you out on RSI overbought area
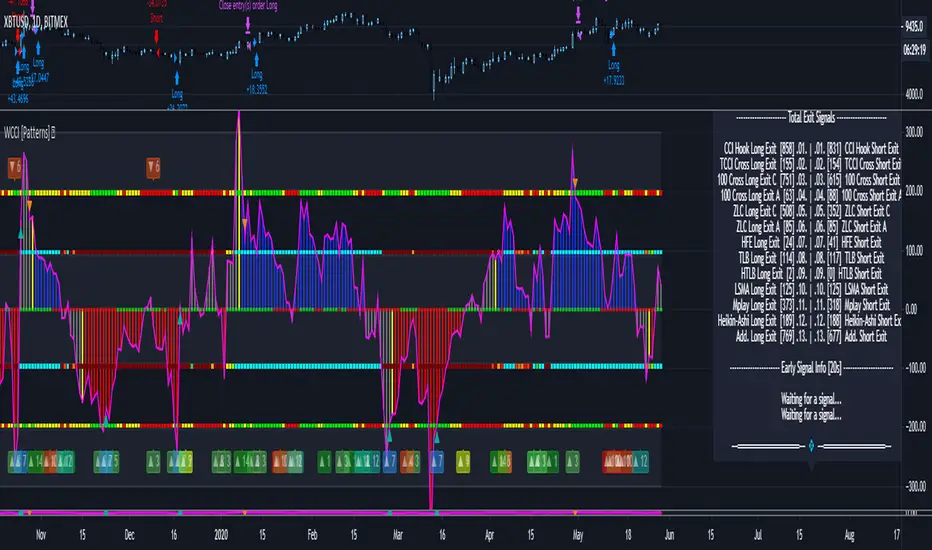
Woodies CCI Trading System - Patterns - Strategy TesterWoodies CCI Trading System - Patterns (Strategy Tester Mode) .
The Woodies CCI was initially designed for trading Stocks, Options and the Future Market.
However, different styles of traders can make use of it in various markets and any chart timeframes.
The Woodies CCI Trading System - Patterns takes a Strategy Builder like approach and can be easily configured to scan simultaneously for any available pattern.
The purpose of this tool is to compress everything down to 1 alert to warn of any opportunities, and it can also be automated .
To further improve the success rate , the patterns' performance can be studied with the help of the Strategy Tester .
The Strategy Tester Mode allows for instant backtesting on historical data.
It can assist in determining the right combination of patterns and exit rules , and it can help decide which patterns are better for which market.
The Alert Mode can be found on this page Woodies-CCI Trading System - Patterns (Alert Mode) .
This trading system contains all the particular features as described by Woodie, and more.
▪ Pattern Recognition (entry signals based on well-defined patterns)
- Trade patterns that are in agreement with the established trend
1. Zero-Line Reject (ZLR)
2. Trend Line Break (TLB) - with the trend
3. Horizontal Trend Line Break (HTLB) - with the trend
4. Tony Trade (TT)
5. GB100 (GB)
6. Reverse Divergence (RD)
- Trade patterns that are against the trend (these patterns indicate the possibility of a change in trend direction and are recommended for experienced traders)
1. Shamu Trade (ST)
2. The Famir Trade (FT)
3. Vegas Trade (VT)
4. Ghost Trade (GT)
5. Hook From Extreme (HFE)
6. Trend Line Break (TLB) - counter-trend
7. Horizontal Trend Line Break (HTLB) - counter-trend
▪ Exit rules
1. CCI Trend Line Breaks
2. CCI crossing back through the 100 lines
3. TCCI hooking or going flat, not moving, or no progress
4. CCI hook from extremes
5. Profit target hit
6. CCI forming a flat top formation
7. CCI crossing a Horizontal Trend Line
8. When the LSMA disagrees with the trade
9. CCI crossing the Zero-Line (ZL)
▪ WCCI Histogram coloring based on Woodie's trend definition
- Blue for Uptrend
- Red for Downtrend
- Gray for No Trend
- Yellow for trend establishment
▪ The LSMA is on the Zero-Line - it is the 25 period Least Squares Moving Average (it shows the ZL as a series of red and green segments)
- Red segments - the market price is below LSMA
- Green segments - the market price is above LSMA
▪ Chop Zone Indicator (CZI) - Positioned on the levels +100 and -100 (it shows market direction)
- Cyan shows up market
- Brown shows down market
- Multiple colors show market in a sideways mode
▪ Sidewinder Indicator (SI) - Positioned on the levels +200 and -200
- Red shows a flat or non-trending market
- Yellow shows a trending market
- Green shows a strong trending market
▪ The Woodies CCI (14) is indicated with the fuchsia color
▪ WCCI length auto-change to 20 on 1-hour chart intervals and higher
▪ The Turbo CCI (6) has a dark red color
▪ TWCCI auto-hide on 1-hour chart intervals and higher
▪ Early Alert Functionality available (eg 20 seconds before the signal is considered valid)
▪ Simplified Alerts
- An all in one alert
- Alerts for entry triggers
- Alerts for exit conditions
▪ Some Pattern Statistics are available on the chart in a panel
Simple Steps to set it up:
1 - Choose at least 1 pattern ( with-the-trend patterns are friendlier than the counter-trend ones)
2 - Choose at least 1 exit condition
3 - Set the alerts (1 for Entry and 1 for Exit, or 1 alert running for both Entry and Exit)
For Beginners:
For the new trader, the trend continuation patterns are easier to manage.
Newcomers should stick to trend-following patterns until they feel very confident!
Here are Three Entry Choices:
1 - Conservative -
Wait until the bar closes to enter - This is the easiest to execute.
2 - Conservative to Aggressive -
Woodie would like the beginner to enter the market if, with 20 seconds left in the bar, a valid CCI pattern presents itself.
3 - Very Aggressive -
Enter trade as soon as the bar indicates a signal during price bar formation. This is for experienced traders, as the signal conditions are final at the close of the bar and the intra-bar changes are not recorded.
Your implicit learned skills are put to the test here. Be fair to yourself and allow yourself time to grow and improve your skills.
You are strongly urged to follow the Option 2.
Money Management: Apply an Initial Protective Stop; Use Trade Exits; Study the past performance - Statistics (Strategy Tester Mode).
Related Tools:
Woodies-CCI Trading System - Patterns - Alerts
Risk Management System (Stop Loss, Take Profit, Trailing Stop Loss, Trailing Take Profit) - it can be connected to the Woodies-CCI Trading System - Patterns - Alerts
Early/Delayed Signal Explained
Bearish&Bullish Engulfing (created by LucaBono)Questo indicatore (o price action pattern) stampa sul grafico delle frecce o barre colorate (modificabili dalle impostazioni) quando si verificano entrambi i segnali del Bearish e Bullish Engulfing ufficiali, ovvero quando il corpo della candela è più ampio dell'intera candela precedente.
Il segnale LONG si effettua quando il massimo della Bullish bar viene rotto dalla candela successiva.
Il segnale SHORT viceversa si effettua alla rottura del minimo.
E' più facile trovare questo tipo di segnali su timefrime giornaliero e mercati come azioni, futures e titoli che non stanno aperti 24h.
Consiglio sempre di accompagnare questi segnali ad altri tipi di segnali o analisi per maggiorare le probabilità di successo e di tenuta del trade.
This indicator (or price action pattern) prints on the graph arrows or colored bars (which can be changed from the settings) when both official Bearish and Bullish Engulfing signals occur, ie when the body of the candle is wider than the entire previous candle.
The LONG signal is made when the maximum of the Bullish bar is broken by the next candle.
The SHORT signal, on the other hand, is performed when the minimum is broken.
It is easier to find this type of signals on daily timefrime and markets like stocks, futures and stocks that are not open 24h.
I always advise to accompany these signals to other types of signals or analyzes to increase the chances of success and stability of the trade.

Doji strategyThis is a simple strategy based on Doji star candlestick.
It places two orders: buy stop at doji star high or previous candle high and sell stop at doji star low or previous candle low.
Exit rules are with take profit and fixed stop loss or take profit and stop loss at doji min or max.
This strategy works very well with high time frames like Daily and Weekly because those are without noise in doji formation.
Each currency pair has its own optimal setting for TP and SL: it's up to user find the best ones.
I could implement SL based on ATR, maybe in next revision.
Please use comment section for any feedback.
Next improvement (only to whom is interested to this script and follows me): study with alerts on multiple tickers all at one. Leave a comment if you want to have access to study.
