RSI Multi-TimeFrame [PACHI]This will show a Table with multiple time frames RSI levels.
> 68 the table cell will be red for given timeframe to indicate overbought
< 35 the table cell will be green for given timeframe to indicate oversold
there are few settings you can play with. if you have any suggestions, let me know.
// Pachi
Rsiindicator

SBMS RSIThis is everyones favourite RSI with small modification as it has 60 as breaout level and 40 as breakdown level, 80 as Overbrought zone and 20 as oversold zone. An EMA helps to stay in the trend.

Bollinger Bands Mean Reversion using RSI [Krishna Peri]How it Works
Long entries trigger when:
- RSI reaches oversold levels, and
- At least one bullish candle closes inside the lower Bollinger Band
Short entries trigger when:
- RSI reaches overbought levels, and
- At least one bearish candle closes inside the upper Bollinger Band
This approach aims to capture exhaustion moves where price pushes into extreme deviation from its mean and then snaps back toward the middle band.
Important Disclaimer
This is a mean-reversion strategy, which means it performs best in sideways, ranging, or slowly oscillating market conditions. When markets shift into strong trends, Bollinger Bands expand and volatility increases, which may cause some signals to become inaccurate or fail altogether.
For best results, combine this script with:
- Price action
- Market structure
- Higher-timeframe trend context
- Previous day/week/month highs & lows
- Untested liquidity levels or imbalance zones
- Session timing (Asia, London, NY)
Using these confluences helps filter out low-probability trades and significantly improves consistency and precision.

RSI_RDRSI_RD - RSI Divergence Detector (Ryan DeBraal)
This script plots a standard RSI along with advanced automatic divergence detection.
It identifies four types of divergences using pivot logic and configurable
lookback windows. Signals appear directly on the RSI line as plotted marks and labels.
FEATURES
- Standard RSI with user-defined length and source.
- Midline (50), overbought (70), and oversold (30) levels with shaded background.
- Automatic detection of:
• Regular Bullish Divergence
• Regular Bearish Divergence
• Hidden Bullish Divergence
• Hidden Bearish Divergence
- Each divergence type can be toggled on/off individually.
- Pivot-based detection using left/right lookback lengths.
- Range filter (bars since pivot) to avoid stale or invalid divergences.
- Colored markers and labels placed exactly on pivot points.
- Alerts for all four divergence conditions.
PURPOSE
This indicator makes RSI divergence trading systematic and visual.
It highlights when price action disagrees with RSI momentum — often signaling
exhaustion, reversal setups, or continuation opportunities depending on the divergence type.
Ideal for combining with trend filters, VWAP, or ORB structures.

SNP420/RSI_GOD_KOMPLEXRSI_GOD_KOMPLEX is a multi–timeframe RSI scanner for TradingView that displays a compact table in the top-right corner of the chart. For each timeframe (1m, 5m, 15m, 30m, 1h, 4h, 1d) it tracks the fast RSI line (not the smoothed/main one) and marks BUY in green when RSI crosses up through 30 (leaving oversold territory) and SELL in red when RSI crosses down through 70 (leaving overbought territory), always using only closed candles for reliable, non-repainting signals. The indicator remembers the last valid signal per timeframe, so the table always shows the most recent directional impulse from RSI across all selected timeframes on the same instrument.
author: SNP420 + Jarvis
project: FNXS
ps: piece and love

RSI Forecast Colorful [DiFlip]RSI Forecast Colorful
Introducing one of the most complete RSI indicators available — a highly customizable analytical tool that integrates advanced prediction capabilities. RSI Forecast Colorful is an evolution of the classic RSI, designed to anticipate potential future RSI movements using linear regression. Instead of simply reacting to historical data, this indicator provides a statistical projection of the RSI’s future behavior, offering a forward-looking view of market conditions.
⯁ Real-Time RSI Forecasting
For the first time, a public RSI indicator integrates linear regression (least squares method) to forecast the RSI’s future behavior. This innovative approach allows traders to anticipate market movements based on historical trends. By applying Linear Regression to the RSI, the indicator displays a projected trendline n periods ahead, helping traders make more informed buy or sell decisions.
⯁ Highly Customizable
The indicator is fully adaptable to any trading style. Dozens of parameters can be optimized to match your system. All 28 long and short entry conditions are selectable and configurable, allowing the construction of quantitative, statistical, and automated trading models. Full control over signals ensures precise alignment with your strategy.
⯁ Innovative and Science-Based
This is the first public RSI indicator to apply least-squares predictive modeling to RSI calculations. Technically, it incorporates machine-learning logic into a classic indicator. Using Linear Regression embeds strong statistical foundations into RSI forecasting, making this tool especially valuable for traders seeking quantitative and analytical advantages.
⯁ Scientific Foundation: Linear Regression
Linear regression is a fundamental statistical method that models the relationship between a dependent variable y and one or more independent variables x. The general formula for simple linear regression is:
y = β₀ + β₁x + ε
where:
y = predicted variable (e.g., future RSI value)
x = explanatory variable (e.g., bar index or time)
β₀ = intercept (value of y when x = 0)
β₁ = slope (rate of change of y relative to x)
ε = random error term
The goal is to estimate β₀ and β₁ by minimizing the sum of squared errors. This is achieved using the least squares method, ensuring the best linear fit to historical data. Once the coefficients are calculated, the model extends the regression line forward, generating the RSI projection based on recent trends.
⯁ Least Squares Estimation
To minimize the error between predicted and observed values, we use the formulas:
β₁ = Σ((xᵢ - x̄)(yᵢ - ȳ)) / Σ((xᵢ - x̄)²)
β₀ = ȳ - β₁x̄
Σ denotes summation; x̄ and ȳ are the means of x and y; and i ranges from 1 to n (number of observations). These equations produce the best linear unbiased estimator under the Gauss–Markov assumptions — constant variance (homoscedasticity) and a linear relationship between variables.
⯁ Linear Regression in Machine Learning
Linear regression is a foundational component of supervised learning. Its simplicity and precision in numerical prediction make it essential in AI, predictive algorithms, and time-series forecasting. Applying regression to RSI is akin to embedding artificial intelligence inside a classic indicator, adding a new analytical dimension.
⯁ Visual Interpretation
Imagine a time series of RSI values like this:
Time →
RSI →
The regression line smooths these historical values and projects itself n periods forward, creating a predictive trajectory. This projected RSI line can cross the actual RSI, generating sophisticated entry and exit signals. In summary, the RSI Forecast Colorful indicator provides both the current RSI and the forecasted RSI, allowing comparison between past and future trend behavior.
⯁ Summary of Scientific Concepts Used
Linear Regression: Models relationships between variables using a straight line.
Least Squares: Minimizes squared prediction errors for optimal fit.
Time-Series Forecasting: Predicts future values from historical patterns.
Supervised Learning: Predictive modeling based on known output values.
Statistical Smoothing: Reduces noise to highlight underlying trends.
⯁ Why This Indicator Is Revolutionary
Scientifically grounded: Built on statistical and mathematical theory.
First of its kind: The first public RSI with least-squares predictive modeling.
Intelligent: Incorporates machine-learning logic into RSI interpretation.
Forward-looking: Generates predictive, not just reactive, signals.
Customizable: Exceptionally flexible for any strategic framework.
⯁ Conclusion
By combining RSI and linear regression, the RSI Forecast Colorful allows traders to predict market momentum rather than simply follow it. It's not just another indicator: it's a scientific advancement in technical analysis technology. Offering 28 configurable entry conditions and advanced signals, this open-source indicator paves the way for innovative quantitative systems.
⯁ Example of simple linear regression with one independent variable
This example demonstrates how a basic linear regression works when there is only one independent variable influencing the dependent variable. This type of model is used to identify a direct relationship between two variables.
⯁ In linear regression, observations (red) are considered the result of random deviations (green) from an underlying relationship (blue) between a dependent variable (y) and an independent variable (x)
This concept illustrates that sampled data points rarely align perfectly with the true trend line. Instead, each observed point represents the combination of the true underlying relationship and a random error component.
⯁ Visualizing heteroscedasticity in a scatterplot with 100 random fitted values using Matlab
Heteroscedasticity occurs when the variance of the errors is not constant across the range of fitted values. This visualization highlights how the spread of data can change unpredictably, which is an important factor in evaluating the validity of regression models.
⯁ The datasets in Anscombe’s quartet were designed to have nearly the same linear regression line (as well as nearly identical means, standard deviations, and correlations) but look very different when plotted
This classic example shows that summary statistics alone can be misleading. Even with identical numerical metrics, the datasets display completely different patterns, emphasizing the importance of visual inspection when interpreting a model.
⯁ Result of fitting a set of data points with a quadratic function
This example illustrates how a second-degree polynomial model can better fit certain datasets that do not follow a linear trend. The resulting curve reflects the true shape of the data more accurately than a straight line.
⯁ What Is RSI?
The RSI (Relative Strength Index) is a technical indicator developed by J. Welles Wilder. It measures the velocity and magnitude of recent price movements to identify overbought and oversold conditions. The RSI ranges from 0 to 100 and is commonly used to identify potential reversals and evaluate trend strength.
⯁ How RSI Works
RSI is calculated from average gains and losses over a set period (commonly 14 bars) and plotted on a 0–100 scale. It consists of three key zones:
Overbought: RSI above 70 may signal an overbought market.
Oversold: RSI below 30 may signal an oversold market.
Neutral Zone: RSI between 30 and 70, indicating no extreme condition.
These zones help identify potential price reversals and confirm trend strength.
⯁ Entry Conditions
All conditions below are fully customizable and allow detailed control over entry signal creation.
📈 BUY
🧲 Signal Validity: Signal remains valid for X bars.
🧲 Signal Logic: Configurable using AND or OR.
🧲 RSI > Upper
🧲 RSI < Upper
🧲 RSI > Lower
🧲 RSI < Lower
🧲 RSI > Middle
🧲 RSI < Middle
🧲 RSI > MA
🧲 RSI < MA
🧲 MA > Upper
🧲 MA < Upper
🧲 MA > Lower
🧲 MA < Lower
🧲 RSI (Crossover) Upper
🧲 RSI (Crossunder) Upper
🧲 RSI (Crossover) Lower
🧲 RSI (Crossunder) Lower
🧲 RSI (Crossover) Middle
🧲 RSI (Crossunder) Middle
🧲 RSI (Crossover) MA
🧲 RSI (Crossunder) MA
🧲 MA (Crossover)Upper
🧲 MA (Crossunder)Upper
🧲 MA (Crossover) Lower
🧲 MA (Crossunder) Lower
🧲 RSI Bullish Divergence
🧲 RSI Bearish Divergence
🔮 RSI (Crossover) Forecast MA
🔮 RSI (Crossunder) Forecast MA
📉 SELL
🧲 Signal Validity: Signal remains valid for X bars.
🧲 Signal Logic: Configurable using AND or OR.
🧲 RSI > Upper
🧲 RSI < Upper
🧲 RSI > Lower
🧲 RSI < Lower
🧲 RSI > Middle
🧲 RSI < Middle
🧲 RSI > MA
🧲 RSI < MA
🧲 MA > Upper
🧲 MA < Upper
🧲 MA > Lower
🧲 MA < Lower
🧲 RSI (Crossover) Upper
🧲 RSI (Crossunder) Upper
🧲 RSI (Crossover) Lower
🧲 RSI (Crossunder) Lower
🧲 RSI (Crossover) Middle
🧲 RSI (Crossunder) Middle
🧲 RSI (Crossover) MA
🧲 RSI (Crossunder) MA
🧲 MA (Crossover)Upper
🧲 MA (Crossunder)Upper
🧲 MA (Crossover) Lower
🧲 MA (Crossunder) Lower
🧲 RSI Bullish Divergence
🧲 RSI Bearish Divergence
🔮 RSI (Crossover) Forecast MA
🔮 RSI (Crossunder) Forecast MA
🤖 Automation
All BUY and SELL conditions can be automated using TradingView alerts. Every configurable condition can trigger alerts suitable for fully automated or semi-automated strategies.
⯁ Unique Features
Linear Regression Forecast
Signal Validity: Keep signals active for X bars
Signal Logic: AND/OR configuration
Condition Table: BUY/SELL
Condition Labels: BUY/SELL
Chart Labels: BUY/SELL markers above price
Automation & Alerts: BUY/SELL
Background Colors: bgcolor
Fill Colors: fill
Linear Regression Forecast
Signal Validity: Keep signals active for X bars
Signal Logic: AND/OR configuration
Condition Table: BUY/SELL
Condition Labels: BUY/SELL
Chart Labels: BUY/SELL markers above price
Automation & Alerts: BUY/SELL
Background Colors: bgcolor
Fill Colors: fill

AJFFRSI+QQEROC Uses Jurik RSI for smooth, responsive momentum measurement
Incorporates QQE features for trend strength and dynamic trailing stop signals
Designed for clearer, more reliable overbought/oversold and reversal signals on TradingView
Suitable for intraday, swing, and longer-term analysis
Not a financial advice. DYOR

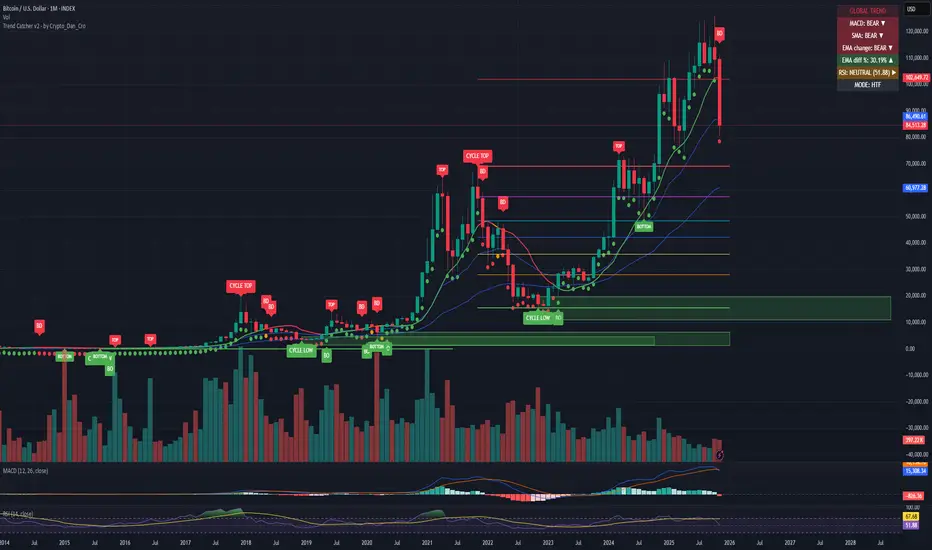
Trend Catcher - Alpha v2 - by Crypto_Dan_CroIf you want to get this indicator, contact me on
X handle: @crypto_dan_cro
What is Trend Catcher v2?
This is the only indicator you need ;)
This indicator is a proprietary market analysis system designed to identify high-probability trading zones by synchronizing multiple layers of market structure, momentum behaviour and cyclical dynamics.
It dynamically adapts to changing market conditions by evaluating:
- macro trend alignment
- structural price positioning
- momentum acceleration & deceleration
- volatility-based reaction zones
- cycle maturity levels
The system filters out low-quality setups and highlights only areas where multiple hidden conditions align, providing:
- trend continuation signals
- structural shift detection
- cycle-based expansion targets
- adaptive support & resistance mapping
Rather than reacting to price alone, the indicator anticipates areas where market psychology historically shifts, allowing traders to position themselves ahead of major moves.
Core philosophy:
This tool does not attempt to predict the market — it tracks the underlying pressure points where probability favours expansion or exhaustion.
It functions as:
- a trend alignment engine
- a cycle decoder
- a volatility interpreter
- a structure validation system
What it gives the user:
- Clear visual guidance without overloading the chart
- Objective market context independent of emotion
- Early trend recognition
- Cycle-aware price targeting
- Decision zones instead of random entries
Ideal for:
- traders who trade structure, not noise
- investors who respect market cycles
- strategists focused on probability over prediction
- disciplined entries & exits
In short:
It is a market interpretation framework built for traders who think two steps ahead.
Contains:
1. Higher Timeframe mode (Monthly / Weekly) on all timeframes
2. Current Chart Timeframe mode
3. Global Trend via BTC MACD
4. SMA
5. EMA
6. BO (Break Out), BD (Break Down) signals
7. TOP & BOTTOM Detection
8. Support & Resistance Zones
9. RSI confirmation
10. Smart Info Panel (Global trend, MACD, SMA, EMA, RSI statuses - Bull, Bear, Neutral)
11. Monthly timeframe (Fibbonaci Retracement levels)
12. Monthly timeframe (all Cycle tops, and Cycle bottoms)
Crypto markets are volatile, if you choose to use this indicator for trading, you are doing it on your own. Crypto_dan_cro is not responsible for any profits or losses created by using this Indicator.
Institution Radar Institution Radar
Institution Radar compares Price RSI with Volume-Delta RSI to show when price moves are real (backed by volume) or fake (moving without volume).
This helps reveal two powerful concepts:
Absorption (Bullish or Bearish)
Absorption happens when a large limit order is sitting in the order book.
Market orders hit it over and over, but the level doesn't break.
This usually means:
Strong players are absorbing the aggressive orders
Price is likely to move in the opposite direction
The next candle often reacts immediately
Can lead to a full reversal or just a short 1–2 candle move
Exhaustion (Bullish or Bearish)
Exhaustion happens when institutions pull their limit orders away.
There is no real volume behind the move, so price drifts up or down easily.
This usually means:
The current move is weak
A slowdown, pullback, or reversal is likely
Often shows up right before a flip in direction
📌 What the Signals Mean
Green signal → next candles often push upward
Red signal → next candles often push downward
These can mark trend reversals or temporary 1–2 candle reactions
🎚️ Sensitivity Setting
You can adjust how strict the signals are:
Lower sensitivity = more signals, more noise
Higher sensitivity = fewer signals, but more accurate and stronger
A higher sensitivity is recommended if you only want the cleanest institutional moments.

RSI ✶ YSTCThis is a Bonus Indicator from YSTC's Volume Profile Tools.
Relative Strength Index (RSI)
A momentum based oscillator which is used to measure the speed (velocity) as well as the change (magnitude) of directional price movements.
What Different about this RSI by YSTC.
You get Support and Resistance lines for RSI which are 20, 30, 40, 50, 60, 70, 80. as shown below.
It can also show RSI Candles as shown below.
For those who want all types of MA with MA Cross can play with this indicator. Below is MA Cross of 9, 21.
And for NEW user with untrained eyes who cant yet detect Divergence this indicator Saves you the trouble of finding.
Below is Regular Bullish and Bearish Divergence. Linewidth 2.
Below is Hidden Bullish and Bearish Divergence. Linewidth 1.
You can add this script to your chart by clicking "Add to favorites" button.
Have Questions ?
Contact: +91 9637070868.
Name: Yogesh Patil (YS Trading Coach).
Time: Monday to Saturday (10:00 AM - 06:00 PM).
Visit our website - YS Trading Coach .
FREE Self Study Yourself Course: Trading with Price Action Volume .
Free Stock Market Introduction Available here .
Paid Course: Trading with Price Action Volume
Paid Volume Profile Tools available here.

Trade The Matric / MACD-RSI Hybrid Candles**"MACD-RSI Hybrid Candles"** is a **custom TradingView Pine Script (v6)** indicator that **replaces your chart’s default candles** with **dynamically colored, intensity-adjusted candles** based on **combined MACD and RSI signals**.
It’s a **visual fusion** of:
- **MACD Histogram** → Momentum & Trend Strength
- **RSI** → Overbought/Oversold & Trend Confirmation
- **Dynamic Transparency** → Visualizes **signal strength**
The result? **At-a-glance confirmation of bullish/bearish phases** — no need to check subcharts.
---
## OVERVIEW: What This Indicator Does
| Feature | Purpose |
|-------|--------|
| **Replaces price candles** | Entire chart becomes a **live MACD-RSI signal map** |
| **Colors based on dual confirmation** | Only strong when **both** MACD and RSI agree |
| **Transparency = momentum intensity** | Brighter = stronger signal |
| **Labels & Alerts** | Highlights **phase changes** (bullish/bearish shifts) |
---
## USER INPUTS (Customizable)
| Input | Default | Description |
|------|--------|-----------|
| `fastLen` | 12 | MACD Fast EMA |
| `slowLen` | 26 | MACD Slow EMA |
| `signalLen` | 9 | MACD Signal Line |
| `rsiLen` | 14 | RSI Period |
| `showLabels` | true | Show "Bullish Phase" / "Bearish Phase" labels |
> Standard settings — tweak for sensitivity.
---
## CORE CALCULATIONS
### 1. **MACD**
```pinescript
macdLine = ta.ema(close, fastLen) - ta.ema(close, slowLen)
signalLine = ta.ema(macdLine, signalLen)
hist = macdLine - signalLine
```
- `hist > 0` → **Bullish momentum**
- `hist < 0` → **Bearish momentum**
### 2. **RSI**
```pinescript
rsi = ta.rsi(close, rsiLen)
```
- `rsi > 50` → **Bullish bias**
- `rsi < 50` → **Bearish bias**
---
## DUAL CONFIRMATION LOGIC
| Condition | Meaning |
|--------|--------|
| `bullCond = macdBull and rsiBull` | **MACD hist > 0** AND **RSI > 50** → **Confirmed Bullish** |
| `bearCond = macdBear and rsiBear` | **MACD hist < 0** AND **RSI < 50** → **Confirmed Bearish** |
| Otherwise | **Neutral / Conflicted** |
> Only **strong, aligned signals** get bright colors.
---
## DYNAMIC INTENSITY & TRANSPARENCY (Key Feature)
```pinescript
maxHist = ta.highest(math.abs(hist), 100)
intensity = math.abs(hist) / maxHist
transp = 90 - (intensity * 80)
```
### How It Works:
1. Finds **strongest MACD histogram value** in last 100 bars
2. Compares **current histogram** to that peak → `intensity` (0 to 1)
3. **Transparency scales from 90 (faint) → 10 (bright)**
| Intensity | Transparency | Visual Effect |
|---------|--------------|-------------|
| 0% (weak) | 90 | Almost transparent |
| 50% | 50 | Medium |
| 100% | 10 | **Vivid, bold candle** |
> **Brighter candle = stronger momentum relative to recent history**
---
## CANDLE COLOR LOGIC
| Condition | Candle & Wick Color | Transparency |
|--------|---------------------|------------|
| **Confirmed Bullish** (`bullCond`) | **Lime Green** | Dynamic (10–90) |
| **Confirmed Bearish** (`bearCond`) | **Red** | Dynamic (10–90) |
| **Neutral / Conflicted** | **Gray** | Fixed 80 (faint) |
> **Wicks and borders match body** → full candle takeover
---
## VISUAL OUTPUT
### 1. **Custom Candles**
```pinescript
plotcandle(open, high, low, close, color=barColor, wickcolor=barColor, bordercolor=barColor)
```
- **Replaces default chart candles**
- **No original candles visible**
### 2. **Labels (Optional)**
- **"Bullish Phase"** → Green label **below low** when:
- MACD histogram **crosses above zero**
- AND RSI **> 50**
- **"Bearish Phase"** → Red label **above high** when:
- MACD histogram **crosses below zero**
- AND RSI **< 50**
> Up to **500 labels** (`max_labels_count=500`)
---
## ALERTS (Built-In)
| Alert | Trigger |
|------|--------|
| **Bullish MACD-RSI Signal** | `ta.crossover(hist, 0) and rsi > 50` |
| **Bearish MACD-RSI Signal** | `ta.crossunder(hist, 0) and rsi < 50` |
> Message: *"MACD crossed above zero with RSI > 50 — Bullish phase."*
---
## HOW TO READ THE CHART
| Visual | Market State | Interpretation |
|-------|-------------|----------------|
| **Bright Lime Candles** | **Strong Bullish Momentum** | High conviction — trend accelerating |
| **Faint Lime Candles** | **Weak Bullish** | Momentum present but not strong |
| **Bright Red Candles** | **Strong Bearish Momentum** | Downtrend with power |
| **Faint Red Candles** | **Weak Bearish** | Selling pressure, but fading |
| **Gray Candles** | **Conflicted / Choppy** | MACD and RSI disagree — avoid |
| **"Bullish Phase" Label** | **New Uptrend Starting** | Entry signal |
| **"Bearish Phase" Label** | **New Downtrend Starting** | Short signal |
---
## TRADING STRATEGY (Example)
### **Long Entry**
1. Wait for **"Bullish Phase" label**
2. Confirm **bright lime candles** (intensity > 50%)
3. Enter on **pullback to support** or **breakout**
4. **Stop Loss**: Below recent swing low
5. **Take Profit**: Trail with EMA or at resistance
### **Short Entry**
1. Wait for **"Bearish Phase" label**
2. Confirm **bright red candles**
3. Enter on **rally to resistance**
> **Best in trending markets** — avoid choppy ranges.
---
## UNIQUE FEATURES
| Feature | Benefit |
|-------|--------|
| **Dual Confirmation** | Avoids false MACD signals in overbought/oversold zones |
| **Dynamic Transparency** | Shows **relative strength** — not just direction |
| **Full Candle Replacement** | Clean, uncluttered chart |
| **Phase Labels** | Marks **exact trend change points** |
| **Built-in Alerts** | No extra setup needed |
---
## LIMITATIONS
| Issue | Note |
|------|------|
| **Lagging by design** | MACD & RSI are reactive |
| **Repainting?** | **No** — all on close |
| **No volume filter** | Add separately for better accuracy |
| **Labels can clutter** | Toggle off in choppy markets |
| **Intensity uses 100-bar lookback** | May lag in very long trends |
---
## BEST USE CASES
| Market | Timeframe | Style |
|-------|----------|------|
| Stocks, Forex, Crypto | 15m, 1H, 4H | Swing / Trend Following |
| **Avoid**: Sideways markets | Yes | High noise = many gray candles |
---
## COMPARISON TO STANDARD MACD/RSI
| Feature | This Indicator | Standard MACD + RSI |
|-------|----------------|---------------------|
| Visual | **Candles = signal** | Subchart lines |
| Confirmation | Built-in dual logic | Manual |
| Strength | Dynamic brightness | Histogram height |
| Alerts | Phase changes | Need custom |
| Chart Clutter | Low | High (two panels) |
> **This is a "one-panel" momentum dashboard**
---
## SUMMARY: What This Indicator Does
> **"MACD-RSI Hybrid Candles"** turns your **entire price chart into a live momentum heatmap** where:
>
> 1. **Candle color** = **MACD + RSI agreement** (Bullish / Bearish / Neutral)
> 2. **Brightness** = **Momentum strength** vs. recent 100 bars
> 3. **Labels & Alerts** = **Trend phase changes** (zero-line crosses with RSI filter)
>
> It **eliminates subcharts** and gives **instant visual confirmation** of:
> - **Trend direction**
> - **Momentum power**
> - **High-probability entries**
---
**Ideal for traders who want:**
- **No indicator panels**
- **Clear, color-coded signals**
- **Strength at a glance**
- **Automated alerts on trend shifts**
---
**Pro Tip**: Use with **volume** or **support/resistance** for **higher win rate**.

RSI Maniac
RSI Maniac
A powerful, fully-customizable RSI indicator designed for traders who want deeper insight into momentum across multiple timeframes. This indicator enhances the traditional RSI by adding multi-timeframe analysis, multi-timeframe moving averages, and optional Bollinger Bands applied directly on the RSI curve.
----- Key Features -----
1️⃣ Multi-Timeframe RSI (HTF RSI) : Analyse higher-timeframe momentum while staying on your current chart.
Enable/Disable HTF RSI
Select any timeframe (1m → 1M)
Dedicated RSI length & source for HTF
Great for spotting:
Trend confirmation or divergence between LTF & HTF momentum
2️⃣ Multi-Timeframe Moving Averages : A powerful addition for traders using higher timeframe confirmation.
Enable/Disable HTF MAs
Independent Fast & Slow MA settings
Separate HTF timeframe
Separate MA type for HTF (EMA or HMA)
Great for spotting:
HTF RSI trend direction
HTF momentum overlays on LTF RSI
Cross-timeframe momentum alignment
🎛️ Clean & Organized User Interface : The indicator organizes settings into intuitive groups.
Current Timeframe RSI
Current Timeframe MA
Higher Timeframe RSI
Higher Timeframe MA
Bollinger Bands Settings
Traders can toggle any component independently.
How to trade ?
Based on my approach, I don’t use RSI to catch reversals. Instead, I use it to trade continuations—when the lower timeframe (LTF) RSI aligns with the higher timeframe (HTF) trend. I simply wait for the LTF RSI to move in the same direction as the HTF RSI and then take the continuation trade. Please check the snapshots for a clearer understanding of how these trades work.
Trade less, trade better!

Multi-Timeframe RSI + MA - Santosh - BangaloreThis script has a combined 5 and 15 min RSI's together in one indicator. Created using AI.

RSI + MACD Multi-Timeframe StrategyThis strategy combines the Relative Strength Index (RSI) from the daily timeframe with the Moving Average Convergence Divergence (MACD) from the 4-hour timeframe to generate precise long entry and exit signals.
The system uses a multi-timeframe approach to align longer-term trend conditions with shorter-term momentum shifts — allowing traders to catch dips with confirmation and exit before reversals.
🧠 Strategy Logic
✅ Long Entry Condition:
- RSI on the daily (1D) timeframe is oversold (below your defined threshold)
- MACD on the 4H timeframe crosses above the signal line
→ A long trade is opened when these two align
✅ Long Exit Condition:
- RSI on the daily timeframe is overbought
- MACD on the 4H timeframe crosses below the signal line
→ The long trade is closed when these two conditions are met
💡 This strategy currently supports long entries only. Short logic can be added if needed.
📊 Indicator Components
🔹 RSI (Relative Strength Index):
- A momentum oscillator that measures the speed and magnitude of price changes.
- Helps identify overbought (potential sell) and oversold (potential buy) conditions.
- Applied on the 1D timeframe (by default) to reflect broader market trend or exhaustion levels.
🔹 MACD (Moving Average Convergence Divergence):
- A trend-following momentum indicator based on moving averages.
- The MACD Line (fast EMA - slow EMA) crossing above the Signal Line indicates bullish momentum.
- Used here on the 4-hour timeframe (by default) for shorter-term momentum confirmation.
🔹 Multi-Timeframe (MTF) Logic:
- Uses request.security() to pull higher timeframe data (1D for RSI, 4H for MACD).
- Ensures no repainting, as it only uses closed candles from the higher timeframe.
- Aligns longer-term signals with shorter-term entries, reducing false signals.
📈 Plotting Options
The script includes a plot selector input allowing you to toggle between:
- RSI Plot (with overbought/oversold lines)
- MACD Plot (MACD line and signal line)
- This helps visualize signal conditions clearly on your chart.
🛠 Customization
- RSI & MACD settings are fully configurable
- RSI and MACD timeframes can be adjusted independently
⚠️ Disclaimer
This strategy is provided for educational and informational purposes only.
It is not financial advice or a recommendation to buy or sell any asset.
Past performance does not guarantee future results. Always test strategies in a simulated environment before live use, and consult with a licensed financial advisor for investment decisions.

Multi-Period MTF RSI MomentumThis indicator gives multi-period and multi-timeframe RSI momentum.
There are three RSI indicators. Current, Lower and Higher timeframes.
The relative position of different time frame RSIs provide relative momentum indication. Lower timeframe RIS above Higher time frame indicate improving momentum.
If the RSI is above 55 then stay bullish, below 45 bearish and 45-55 is ranging.
There are many strategies you can trade. one is if the high of candle where RSI cross 55 is crossed then buy, or low of the RSI crossng below 45 is broken ten sell etc.

icreature RSI Divergence + OB/OSThis script simply showing all divergences and fill in colours when ob or os . Enjoy!
Synthetic Point & Figure on RSIHere is a detailed description and user guide for the Synthetic Point & Figure RSI indicator, including how to use it for long and short trade considerations:
*
## Synthetic Point & Figure RSI Indicator – User Guide
### What It Is
This indicator applies classic Point & Figure (P&F) charting logic to the Relative Strength Index (RSI) instead of price. It transforms the RSI into synthetic “P&F candles” that filter out noise and highlight significant momentum moves and reversals based on configurable box size and reversal settings.
### How It Works
- The RSI is calculated normally over the selected length.
- The P&F engine tracks movements in the RSI above or below a defined “box size,” creating columns that switch direction only after a larger reversal.
- The synthetic candles connect these filtered RSI values visually, reducing false noise and emphasizing strong RSI trends.
- Optional EMA and SMA overlays on the synthetic P&F RSI allow smoother trend signals.
- Reference RSI levels at 33, 40, 50, 60, and 66 provide further context for momentum strength.
### How to Use for Trading
#### Long (Buy) Considerations
- The synthetic P&F RSI candle direction flips to *up (green candles)* indicating strength in momentum.
- Look for the RSI P&F value moving above the *40 or 50 level*, suggesting increasing bullish momentum.
- Confirmation is stronger if the synthetic RSI is above the EMA or SMA overlays.
- Ideal entries are after a reversal from a synthetic P&F downtrend (red candles) to an uptrend (green candles) near or above these levels.
#### Short (Sell) Considerations
- The candle direction flips to *down (red candles)*, showing weakening momentum or bearish reversal.
- Monitor if the synthetic RSI falls below the *60 or 50 level*, signaling momentum loss.
- Confirm bearish bias if the price is below the EMA or SMA overlays.
- Exit or short positions are signaled when the synthetic candle reverses from green to red near or below these threshold levels.
### Important RSI Levels to Watch
- *Level 33*: Lower bound indicating deep oversold conditions.
- *Level 40*: Early bullish zone suggesting momentum improvement.
- *Level 50*: Neutral midpoint; crossing above often signals bullish strength, below signals weakness.
- *Level 60*: Advanced bullish momentum; breaking below signals potential reversal.
- *Level 66*: Strong overbought area warning of possible pullback.
### Tips
- Use in conjunction with price action analysis and other volume/trend indicators for higher conviction.
- Adjust box size and reversal settings based on instrument volatility and timeframe for ideal filtering.
- The P&F RSI is best for identifying sustained momentum trends and avoiding false RSI whipsaws.
- Combine this indicator’s signals with stop-loss and risk management strategies.
*
This indicator converts RSI momentum analysis into a simplified, noise-filtered P&F chart format, helping traders better visualize and trade momentum shifts. It is especially useful when RSI signal noise can cause confusion in volatile markets.
Let me know if you want me to generate a shorter summary or code alerts based on these levels!
Sources
Relative Strength Index (RSI) — Indicators and Strategies in.tradingview.com
Indicators and strategies in.tradingview.com
Relative Strength Index (RSI) Indicator: Tutorial www.youtube.com
Stochastic RSI (STOCH RSI) in.tradingview.com
RSI Strategy docs.algotest.in
Stochastic RSI Indicator: Tutorial www.youtube.com
Relative Strength Index (RSI): What It Is, How It Works, and ... www.investopedia.com
rsi — Indicators and Strategies in.tradingview.com
Relative Strength Index (RSI) in.tradingview.com
Relative Strength Index (RSI) — Indicators and Strategies www.tradingview.com

Inakis-BB-Stoch-ATR-ADX StrategyStrategy Description
This advanced trading strategy combines multiple technical indicators to identify high-probability breakout opportunities in trending markets. The system uses a multi-layered filtering approach to ensure only the strongest signals trigger trades.
Key Components:
Primary Signals:
Bollinger Bands Breakout: Identifies price extremes when price breaks below the lower band (buy) or above the upper band (sell)
Stochastic Oscillator: Confirms oversold (<30) and overbought (>70) conditions
ADX Filter: Ensures sufficient trend strength is present (ADX > 20)
ATR Volatility Filter: Trades only during periods of adequate volatility
Advanced Features:
DMI Higher Timeframe Analysis: Incorporates directional movement from higher timeframes (default 1H) to align trades with the dominant trend
Volume Confirmation: Requires above-average volume for signal validation
Cooldown Period: Prevents overtrading by enforcing minimum bars between signals
Visual Feedback: Color-coded background based on higher timeframe trend direction
Risk Management:
Fixed position sizing with customizable contract size
Predefined Stop Loss (default 500 points) and Take Profit (default 1000 points) levels
Clear risk-reward ratio of 1:2
Trading Logic:
Long Entry: Price breaks below BB lower band + Stochastic < 30 + Higher TF bullish trend
Short Entry: Price breaks above BB upper band + Stochastic > 70 + Higher TF bearish trend
All entries require confirmation from ADX, ATR, and volume filters
Customization:
All parameters are fully adjustable through the input panel, allowing traders to optimize the strategy for different markets and timeframes. Each filter can be individually enabled/disabled for testing and optimization purposes.
This strategy is designed for trending markets and performs best on liquid instruments with clear directional moves.

MTF Oscillator Stack [BigBeluga]🔵 OVERVIEW
The MTF Oscillator Stack brings powerful multi-timeframe momentum analysis directly into your price chart. You can select one oscillator— RSI , MFI , or Stochastic RSI —and display it across up to 4 different timeframes. Each panel is neatly stacked horizontally above price , offering quick insight into cross-timeframe conditions like trend direction, exhaustion zones, and momentum shifts.
🔵 CONCEPTS
Single Oscillator Mode: Select one oscillator type (RSI, MFI, or Stoch RSI) to analyze across all selected timeframes.
Top-Chart Horizontal Panels: Oscillator plots are aligned horizontally at the top of the chart for seamless top-down reading.
Signal Comparison Arrows: Arrows (🢁 / 🢃) indicate oscillator position relative to its signal line.
Overbought/Oversold Zones: Transparent 30–70 fill zones highlight key reversal areas.
Dynamic Display Logic: Only enabled panels are shown; spacing adjusts based on active timeframes.
Timeframe Tagging: Each oscillator panel is labeled with its corresponding timeframe (e.g., 1H, 2H, 4H).
🔵 FEATURES
Choose one oscillator (RSI, MFI, or Stoch RSI) and apply it across up to 4 timeframes.
Each oscillator panel includes: price-synced plot, signal line, and zone shading.
Scale alignment allows users to place charts at the bottom or top.
Clear arrow signals show whether oscillator is bullish or bearish.
Individual length and signal settings per timeframe.
Toggle for alignment mode: evenly spaced or floating layout.
All panels use a consistent layout for faster decision-making.
🔵 HOW TO USE
Select your preferred oscillator and activate 2–4 key timeframes (e.g., 1H, 4H, D1, W1).
Use signal crossovers as a bullish (🢁) or bearish (🢃) trend cue.
Look for aligned extremes (e.g., all timeframes overbought) to spot momentum exhaustion.
Ideal for momentum confluence strategies and top-down confirmation.
Use horizontal layout to stay focused on price while assessing broader structure.
🔵 CONCLUSION
MTF Oscillator Stack simplifies complex multi-timeframe momentum analysis into one clean, actionable visual. Whether you're tracking RSI, MFI, or Stoch RSI, this tool helps you stay aligned with the broader trend—without ever leaving your main chart.

RSI Price LadderFX:XAUUSD
Overview
RSI Price Ladder is an indicator that visualizes RSI levels mapped directly to price levels across multiple timeframes.
It helps traders see where the RSI will reach certain threshold values (like 30, 50, 70) in terms of price, without calculating manually.
It dynamically draws ladder lines (price levels) based on user-defined RSI targets, allowing clear visualization of RSI movements versus price action.
Purpose for Traders
Forecast Price Zones: Understand at which price levels RSI would hit oversold/overbought zones.
Multi-Timeframe Analysis: Monitor RSI-price relationships across multiple timeframes simultaneously (e.g., M5, M15, H1, H4).
Timing Entries and Exits: Plan precise entries or exits based on expected RSI behavior without switching between charts.
Visual Clarity: Simplifies multi-timeframe RSI tracking by ladder-style price mapping directly on the current chart.
Configuration
RSI length: The period for RSI calculation (default 14).
RSI Target Levels (1–7): Define up to 7 custom RSI levels (e.g., 20, 30, 40, 50, 60, 70, 80).
Spacing Between Ladders: Horizontal spacing between different timeframe ladders on the chart.
Pointer Colors: Customize colors for current RSI, EMA(9) of RSI, and WMA(45) of RSI.
Show TF1–TF4: Toggle visibility of up to four different timeframe ladders.
Interval TF1–TF4: Select timeframes to draw ladders (choices from 1m to 1W including 3D).
Ladder Colors: Customize the ladder color for each timeframe separately.
How to read data
See explaination:
How to use
The primary goal of this indicator is to help traders easily and accurately see price levels corresponding to specific RSI values .
Identifying Multi-Timeframe Support and Resistance
According to RSI behavior:
- In an uptrend, RSI tends to find support around 40, previous RSI bottoms, and the WMA45.
- In a downtrend, RSI tends to face resistance around 60, previous RSI tops, and the WMA45.
Using the RSI Price Ladder, you can accurately pinpoint the exact price levels corresponding to these RSI support and resistance zones.
Defining Entry Zones, Stop Loss, and Take-Profit Areas Based on RSI
For example:
By observing RSI behavior, I noticed a downward trend forming.
On both M15 and H1 timeframes, RSI resistance levels align with the price zone around 3043–3054.
Thus, I can plan a sell trade in this entry zone:
- Stop loss: If RSI breaks above the resistance level, which also corresponds to a price resistance.
- Take-profits at two areas:
RSI support on M5 at RSI 30, corresponding to price 3007.
RSI support on M15 at RSI 30, corresponding to price 2988.
You see, with the ladder, we can directly visualize the price levels corresponding to RSI points on the chart, making decision-making more intuitive.
Result:
The price successfully hit TP1 and TP2.
Visualizing Buying and Selling Strength Across Timeframes
The indicator helps track the correlation of buying and selling strength across different timeframes at the same time. For instance: when selling pressure increases, higher timeframe RSI will typically be higher than lower timeframe RSI. Visualizing this makes it easier to observe and connect price movements across multiple timeframes quickly and clearly.
Visualizing When Combining with Other Methods
In this example:
- RSI shows support around 27.
- Instantly, on the price chart, I notice that the RSI 27 level aligns with the EMA200, a major dynamic price support.
Thus, a long setup can be considered:
- Entry: Near this confluence zone.
- Stop loss: Below the EMA200 or if RSI drops to 20.
Summary
RSI Price Ladder gives traders a powerful visual tool to link RSI behavior to real price levels across multiple timeframes, enhancing strategic entry/exit planning without needing to flip charts.
- Save time spotting RSI targets.
- Stay organized across multiple timeframes.
- Customize the entire ladder experience from colors to intervals.

Multi-Asset & TF RSI
Multi-Asset & TF RSI
This indicator allows you to compare the Relative Strength Index (RSI) values of two different assets across multiple timeframes in a single pane. It’s ideal for traders who wish to monitor momentum across different markets or instruments simultaneously.
Key Features:
Primary Asset RSI:
The indicator automatically calculates the RSI for the chart’s asset. You can adjust the timeframe for this asset using a dropdown that offers standard TradingView timeframes, a "Chart" option (which syncs with your current chart timeframe), or a "Custom" option where you can enter any timeframe.
Optional Second Asset RSI:
Enable the “Display Second Asset” option to compare another asset’s RSI. Simply select the symbol (default is “DXY”) and choose its timeframe from an identical dropdown. When enabled, the second asset’s RSI is computed and plotted for easy comparison.
RSI Settings:
Customize the RSI length and choose the data source (e.g., close price) to suit your trading strategy.
Visual Aids:
Overbought (70) and oversold (30) levels are clearly marked, along with a midline at 50. These visual cues help you quickly assess market conditions.
Asset Information Table:
A dynamic table at the top of the pane displays the symbols being analysed – the chart’s asset as the “1st” asset and, if enabled, the second asset as the “2nd.”
How to Use:
Apply the Indicator:
Add the indicator to your chart. By default, it will calculate the RSI for the chart’s current asset using your chart’s timeframe.
Adjust Primary Asset Settings:
Use the “Main Asset Timeframe” dropdown to choose the timeframe for the RSI calculation on the chart asset. Select “Chart” to automatically match your current chart’s timeframe or choose a preset/custom timeframe.
Enable and Configure the Second Asset:
Toggle the “Display Second Asset” option to enable the second asset’s RSI. Select the asset symbol and its desired timeframe using the provided dropdown. The RSI for the second asset will be plotted if enabled.
Monitor the RSI Values:
Observe the plotted RSI lines along with the overbought/oversold levels. Use the table at the top-centre of the pane to verify which asset symbols are being displayed.
This versatile tool is designed to support multi-asset analysis and can be a valuable addition to your technical analysis toolkit. Enjoy enhanced RSI comparison across markets and timeframes!
Happy Trading!

RSI Classic calculationClassic RSI with Moving Average
This script implements the Classic RSI (Relative Strength Index) method with the option to use either an Exponential Moving Average (EMA) or a Simple Moving Average (SMA) for smoothing the gains and losses. This custom implementation primarily aims to resolve a specific issue I encountered when cross-referencing RSI values with Python-based data, which is calculated differently than in Pine Script. However, the methodology here can benefit anyone who needs to align RSI calculations across different programming languages or platforms.
The Problem:
When working with Python for data analysis, the RSI values are calculated differently. The smoothing method, for example, can vary—RMA (Relative Moving Average) may be used instead of SMA or EMA, resulting in discrepancies when comparing RSI values across systems. To solve this problem, this script allows for the same type of smoothing to be applied (EMA or SMA) as used in Python, ensuring consistency in the data.
Why This Implementation:
The main goal of this approach was to align RSI calculations across Python and Pine Script so that I could cross-check the results accurately. By offering both EMA and SMA options, this script bridges the gap between Pine Script and Python, ensuring that the data is comparable and consistent. While this particular issue arose from my work with Python, this solution is valuable for anyone dealing with cross-platform RSI comparisons in different coding languages or systems.
Benefits:
Cross-Platform Consistency: This script ensures that RSI values calculated in Pine Script are directly comparable to those from Python (or any other platform), which is crucial for accurate analysis, especially in automated trading systems.
Flexibility: The ability to choose between EMA and SMA provides flexibility in line with the specific needs of your strategy or data source.
Ease of Use: The RSI is plotted with overbought and oversold levels clearly marked, making it easy to visualize and use in decision-making processes.
Limitations:
Calculation Differences: While this script bridges the gap between Pine Script and Python, if you're working with a different platform or coding language that uses variations like RMA, small discrepancies may still arise.
Sensitivity Trade-Off: The choice between EMA and SMA impacts the sensitivity of the RSI. EMA responds quicker to recent price changes, which could lead to faster signals, while SMA provides a more stable but slower response.
Conclusion:
This Classic RSI script, with its customizable moving average type (EMA or SMA), not only solves the issue I faced with Python-based calculations but also provides a solution for anyone needing consistency across different programming languages and platforms. Whether you're working with Pine Script, Python, or other languages, this script ensures that your RSI values are aligned for more accurate cross-platform analysis. However, always be mindful of the small differences that can arise when different smoothing techniques (like RMA) are used in other systems.

Position resetThe "Position Reset" indicator
The Position Reset indicator is a sophisticated technical analysis tool designed to identify possible entry points into short positions based on an analysis of market volatility and the behavior of various groups of bidders. The main purpose of this indicator is to provide traders with information about the current state of the market and help them decide whether to open short positions depending on the level of volatility and the mood of the main players.
The main components of the indicator:
1. Parameters for the RSI (Relative Strength Index):
The indicator uses two sets of parameters to calculate the RSI: one for bankers ("Banker"), the other for hot money ("Hot Money").
RSI for Bankers:
RSIBaseBanker: The baseline for calculating bankers' RSI. The default value is 50.
RSIPeriodBanker: The period for calculating the RSI for bankers. The default period is 14.
RSI for hot money:
RSIBaseHotMoney: The baseline for calculating the RSI of hot money. The default value is 30.
RSIPeriodHotMoney: The period for calculating the RSI for hot money. The default period is 21.
These parameters allow you to adjust the sensitivity of the indicator to the actions of different groups of market participants.
2. Sensitivity:
Sensitivity determines how strongly changes in the RSI will affect the final result of calculations. It is configured separately for bankers and hot money:
SensitivityBanker: Sensitivity for bankers' RSI. It is set to 2.0 by default.
SensitivityHotMoney: Sensitivity for hot money RSI. It is set to 1.0 by default.
Changing these parameters allows you to adapt the indicator to different market conditions and trader preferences.
3. Volatility Analysis:
Volatility is measured based on the length of the period, which is set by the volLength parameter. The default length is 30 candles. The indicator calculates the difference between the highest and lowest value for the specified period and divides this difference by the lowest value, thus obtaining the volatility coefficient.
Based on this coefficient, four levels of volatility are distinguished.:
Extreme volatility: The coefficient is greater than or equal to 0.25.
High volatility: The coefficient ranges from 0.125 to 0.2499.
Normal volatility: The coefficient ranges from 0.05 to 0.1249.
Low volatility: The coefficient is less than 0.0499.
Each level of volatility has its own significance for making decisions about entering a position.
4. Calculation functions:
The indicator uses several functions to process the RSI and volatility data.:
rsi_function: This function applies to every type of RSI (bankers and hot money). It adjusts the RSI value according to the set sensitivity and baseline, limiting the range of values from 0 to 20.
Moving Averages: Simple moving averages (SMA), exponential moving averages (EMA), and weighted moving averages (RMA) are used to smooth fluctuations. They are applied to different time intervals to obtain the average values of the RSI.
Thus, the indicator creates a comprehensive picture of market behavior, taking into account both short-term and long-term dynamics.
5. Bearish signals:
Bearish signals are considered situations when the RSI crosses certain levels simultaneously with a drop in indicators for both types of market participants (bankers and hot money).:
The bankers' RSI crossing is below the level of 8.5.
The current hot money RSI is less than 18.
The moving averages for banks and hot money are below their signal lines.
The RSI values for bankers are less than 5.
These conditions indicate a possible beginning of a downtrend.
6. Signal generation:
Depending on the current level of volatility and the presence of bearish signals, the indicator generates three types of signals:
Orange circle: Extremely high volatility and the presence of a bearish signal.
Yellow circle: High volatility and the presence of a bearish signal.
Green circle: Low volatility and the presence of a bearish signal.
These visual markers help the trader to quickly understand what level of risk accompanies each specific signal.
7. Notifications:
The indicator supports the function of sending notifications when one of the three types of signals occurs. The notification contains a brief description of the conditions under which the signal was generated, which allows the trader to respond promptly to a change in the market situation.
Advantages of using the "Position Reset" indicator:
Multi-level analysis: The indicator combines technical analysis (RSI) and volatility assessment, providing a comprehensive view of the current market situation.
Flexibility of settings: The ability to adjust the sensitivity parameters and the RSI baselines allows you to adapt the indicator to any market conditions and personal preferences of the trader.
Clear visualization: The use of colored labels on the chart simplifies the perception of information and helps to quickly identify key points for entering a trade.
Notification support: The notification sending feature makes it much easier to monitor the market, allowing you to respond to important events in time.
