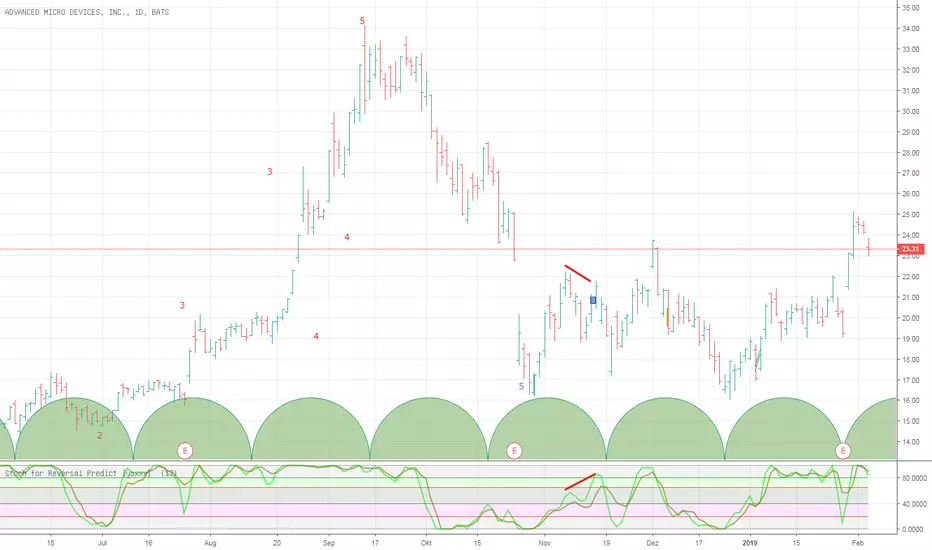
Stochastic for Reversal Predict [yoxxx] Usable for all markets, all time frames. (The bull bear sup/res lines are specific for stocks, but differ just a little to other instruments.)
This script is more likely a method support than a study - and your exit from the default stochastic club:
Most people use Stoch for ins and outs by 20 rsp 80 (a default behavior MM know well to deal with). C.G. Lane, the inventor of this indicator,
however used it to find divergences with quote (price / close) to predict reversals. Constance Brown refined this method by laying
a fix time cycle underneath the chart that is in rhythm with specific highs or lows of a stock or an index.
The length of one cycle divided by 2 equals the proper value for %D specified for that stock /index. The script offers an input for this specific value.
C. Brown stresses that good signals are only given within the bull or bear ranges (20-65 for bear markets, 40-80 for bull markets).
For your convenience, I laid these areas underneath the graphs. You can automate the divergence research (relative to quote)
by using my script "Bull Bear Divergence Indicator". Feedback welcome. Have fun and success.
Tìm kiếm tập lệnh với "信达股份40周年"
Multiple MACD RSI simple strategySimple strategy script I've had for a while but looks like I never published.
Although it is one of my most simple it seems to have the best profitability. It is pretty rough though. the Stoch RSI has only a little weight to the trade trigger. I'll refine it more over time or you can by all means. Basically the Stoch RSI current K line has to be OVER 40 to trigger a SELL. It has no effect on buy side.
The triggers are roughly as follows:
Year - since so many assets have gone 2x, 3x, 10x+ since 2013 having a strategy that earns a 500% return from 2013 to now isn't that good if buy-and-holding would have got you 800%. This eliminates some of that noise and makes it a little easier to quickly gauge success. So buy/sell trigger need a value of greater or equal to 2018 (default)
MACD 1 - First MACD (short) needs to indicate greater than 0 to buy or less than 0 to sell.
MACD 2 - Same as MACD1 but for second MACD set (long)
Uptrend - Latest close + high divided by last periods close + high needs to be grater than 1. So if latest is 34.30 close and 34.60 high and previous interval is 34.80 close and 34.82 high, that is 0.99 and will not trigger a buy trade.
Downtrend - Same thing but close + low and less than 1.
This script/strategy is pretty rough but if there is interest I'll polish it more since it is a pretty solid but simple strategy for most assets.

Trend Lines and MoreMulti-Indicator consisting of several useful indicators in a single package.
TREND LINES
-By default the 20 SMA and 50 SMA are shown.
-Use "MOVING AVERAGE TYPE" to select SMA, EMA, Double-EMA, Triple-EMA, or Hull.
-Use "50 MA TREND COLOR" to have the 50 turn green/red for uptrend/downtrend.
-Use "DAILY SOURCE ONLY" to always show daily averages regardless of timeframe.
-Use "SHOW LONG MA" to also include 100, 150, and 200 moving averages.
-Use "SHOW MARKERS" to show a small colored marker identifying which line is which.
OTHER INDICATORS
-You can show Bollinger Bands and Parabolic SAR.
-You can highlight key reversal times (9:50-10:10 and 14:40-15:00).
-You can show price offset markers, where was the price "n" periods ago.
That last one is useful to show the level of prices which are about to "fall off" the moving average
and be replaced with current price. So for example, if current price is significantly below the
200-days-ago price, you can gauge the difficulty for the 200 MA to start climbing again.

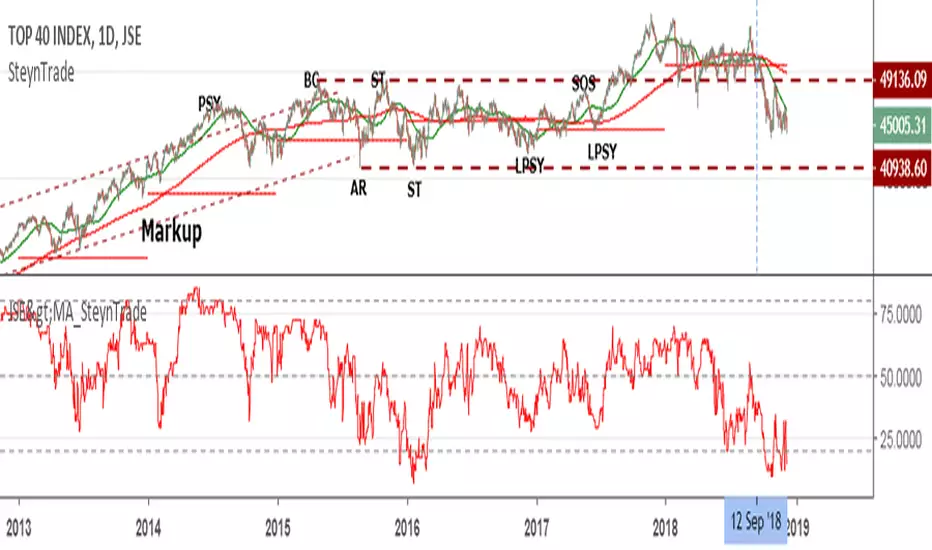
JSE Market Breadth Stocks>MAThis indicator is for the Johannesburg Stock Exchange (JSE) and indicates the number of stocks in the Top 40 Index above its selected Smooth Moving Average (SMA). Typically the 200SMA is used to see the longer term health of the market and the 50SMA for a short term view. Currently the market has reached a point that less than 2% of stocks were above their 200SMA which is the lowest since 2013.
Triple Cross of DeathExponential moving averages in red of 4 and 16, exponential moving average of 40 in orange and simple moving average of 200 in yellow to confirm the triple crossing of 4, 16 and 40.
Taken from Lions against gazelles by Jose Luis Carpatos.

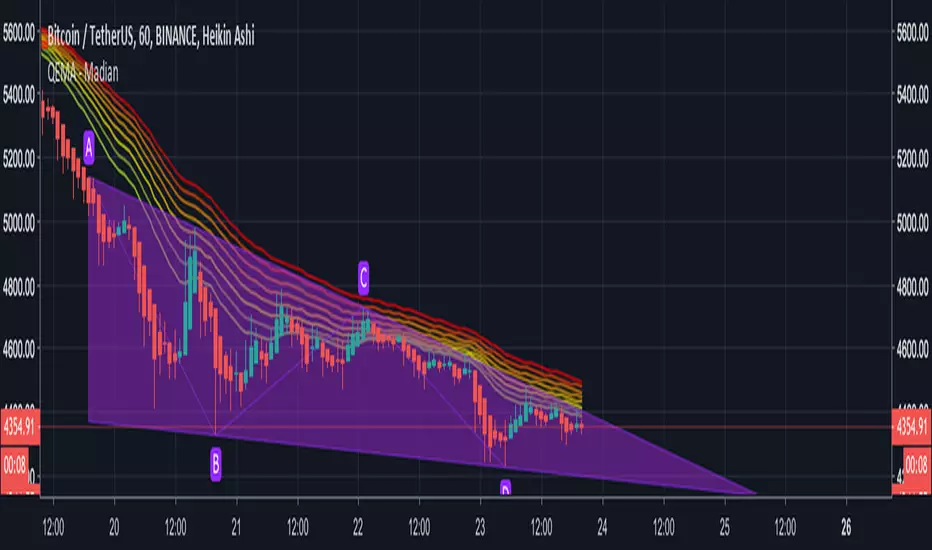
QEMA - 8 Exponential Moving Averages (20 - 55) / MadianQEMA - 8 Exponential Moving Averages (20, 25, 30, 35, 40, 45, 50, 55)
This QEMA act as support and resistance .
The Scale Of Sacred SoundsBased on the Sacred Sound Scale
How to use it:
This indicator is designed to capture the inferred behavior of traders and investors by using two groups of averages.
Meant for longer trades and trend indicator.
Used on any timescale as needed.
Can trade on long or short where the slow MA crosses fast Ma or where the Slow MA compresses and flips open again.
Follow the trend to the end - pot of gold at the end of the rainbow :-)
References:
Based on Daryl Guppy GMMA and
www.guppytraders.com
Read more at:
whatmusicreallyis.com
There is one tuning in which the frequencies 432, 528, 424 and 440 Hz can peacefully coexist. The scale has 32+1 pure harmonic tones and the reference frequency of 256 Hz. It comes from the Natural Ascending Series of Harmonics 32 to 64 of the 8 Hz Fundamental Tone, and represents its 6th double. I call this tuning The Scale of Sacred Sounds.
Representation using ancient Sumerian/Babylonian/Vedic math:
32; 33; 34; 35; 36; 37; 38; 39; 40; 41; 42; 43; 44; 45; 46; 47; 48; 49; 50; 51; 52; 53; 54; 55; 56; 57; 58; 59; 60; 61; 62; 63; 64
Representation using musical ratios:
1/1; 33/32; 17/16; 35/32; 9/8; 37/32; 19/16; 39/32; 5/4; 41/32; 21/16; 43/32; 11/8; 45/32; 23/16; 47/32; 3/2; 49/32; 25/16; 51/32; 13/8; 53/32; 27/16; 55/32; 7/4; 57/32; 29/16; 59/32; 15/8; 61/32; 31/16; 63/32; 2/1
The math for deriving one of the above series from the other is simple. Divide all numbers from the ancient series by the first, then simplify the fractions. Conversely, the series of ratios can be turned into the series of integers by calculating their least common denominator (the smallest whole number that is a multiple of all numbers under the fraction bar) and discarding it.
Logarithmic representation using musical constants (definition given further down):
0,000; 30,772; 60,625; 89,612; 117,783; 145,182; 171,850; 197,826; 223,144; 247,836; 271,934; 295,464; 318,454; 340,927; 362,905; 384,412; 405,465; 426,084; 446,287; 466,090; 485,508; 504,556; 523,248; 541,597; 559,616; 577,315; 594,707; 611,802; 628,609; 645,138; 661,398; 677,399; 693,147

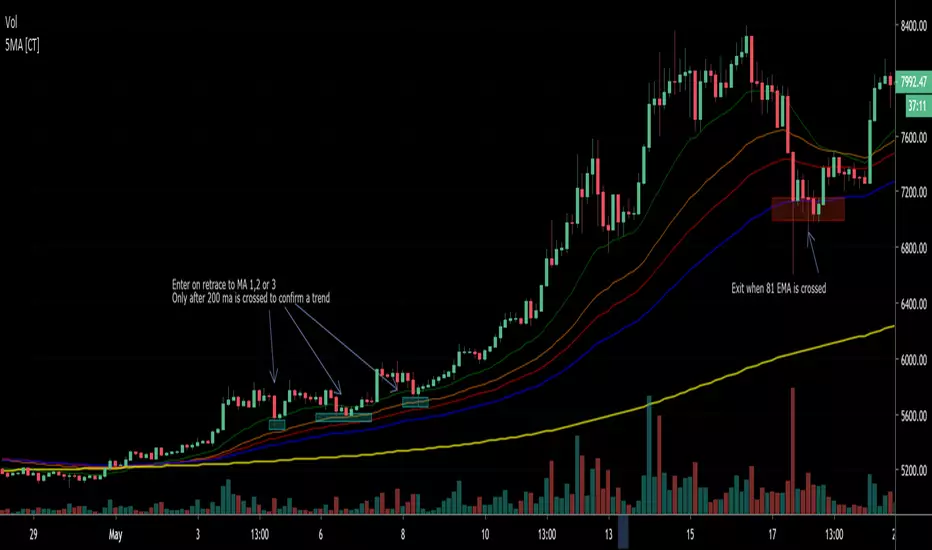
5 Moving Average (Simple / Exponential)Defaults to 1 SMA with 4 EMA bands. 200 SMA is intended to show the trend; 20,40 and 55 EMA show entries; 81 EMA is used as stop/take profit. Defaults are inspired by 'Eric Choe' but you can switch between EMA and SMA as per your own preference. Philakone uses all 5 as EMA 8, 13, 21, 55, 200
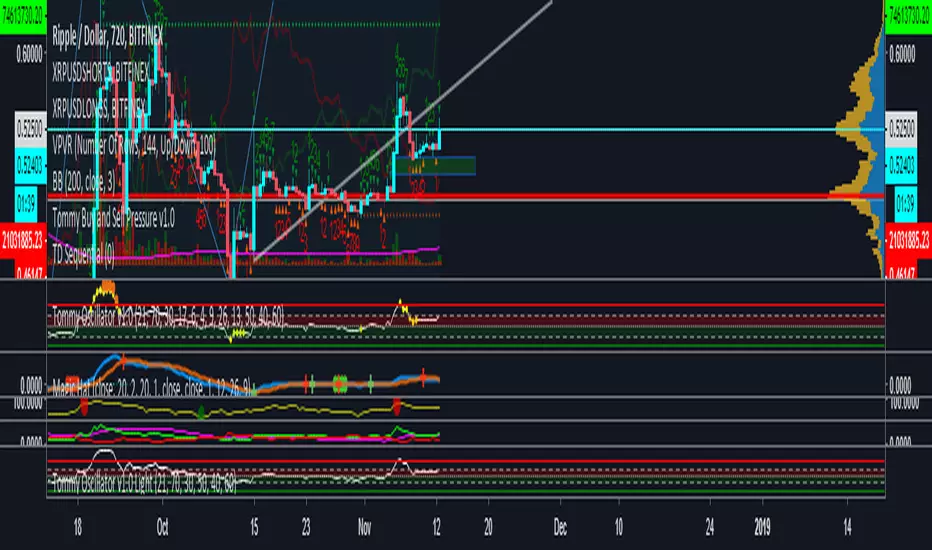
Tommy Oscillator v1.0 LightRSI rules: If we break above 70 RSI, 40-50 RSI acts as support,
If we break below 30 RSI, 50-60 RSI acts as resistance
I color coded the support/resistance areas to make visuals easier. This is part of my private indicator, but I removed the buy/sell part (which is the private part). I think this will help a lot with your guy's trading.
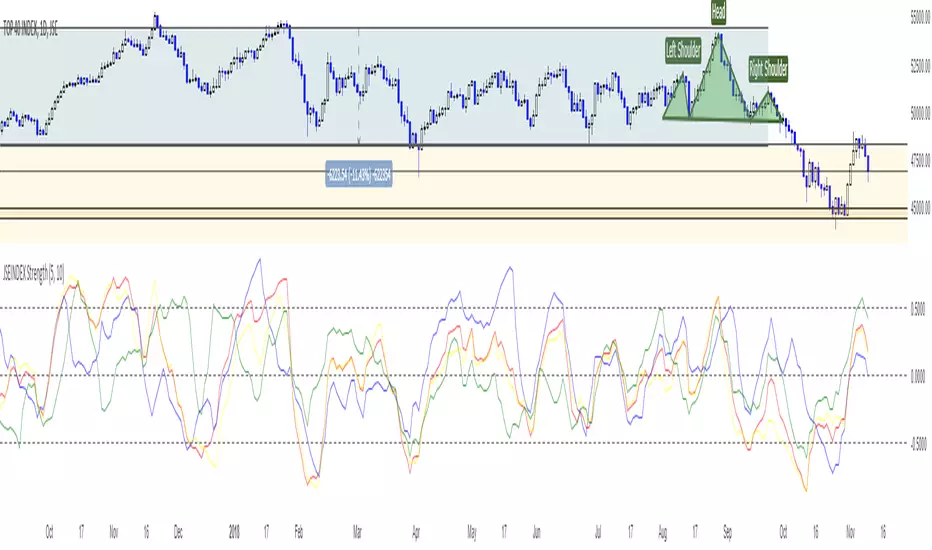
JSEINDEX StrengthJSE:J200
JSE:J210
JSE:J211
JSE:J212
This script shows all three major indecies on JSE and compare their strength.
RED = TOP 40
BLUE = RESI 10
YELLOW = INDI 25
GREEN = FIN 15
Current state of the indicator points that strongest index is FIN15 weakest is RESI10 and that INDI25 is closely following TOP40
Idea is to be short weakest index or member of the index currently RESI10
Bitfinex Longs/Shorts Ratio AlertableThis script contains Bitfinex longs/short ratio and generates alarms with a given input .default value is 60 which means alerts when either shorts/longs reach 60:40 ratio

Katana Gaps Bounty Hunter Pro (Show Gaps of All Types) by RRBKatana Gaps Bounty Hunter Pro (KGB Hunter Pro, Gap Exterminator) by RagingRocketBull 2018
Version 1.0
This indicator shows/counts/filters gaps on a chart.
There are several versions: Simple, Pro, Advanced and Zones. This is the Pro version. The Differences are listed below.
- Simple: shows/counts gaps, changes color based on gap dir (2 colors), filters out price gaps within session, large gaps, and high volume gaps
- Pro: +shows all types of gaps, multi color, pro filters (full/partial/overlapping time, price, large, candle, volume, doji, weekend gaps within delta ranges)
- Advanced: +session times mask, show/count gaps only for last N bars, +min/max/filled gaps stats, dark mode
- Zones: +shows gaps as dynamic horiz zones
KGB Hunter Pro Gap Exterminator focuses on showing you all possible types of gaps in multiple colors. Gap theory states that price tends to return and fill the gaps,
so you can use it to collect the bounty. You can apply any combination of complex filters to narrow down search results i.e., find only all:
- type 3 gaps up with allowed wick-candle overlapping of up to 10% and
- gap size larger than 200 and
- with at least one of the candles larger than 100 and
- volume change at least 40 and
- spanning less than 2 bar periods and
- excluding weekend gaps
Features:
- highlights gaps using barcolor and plotchar chars (8 colors x 2 dirs)
- supports all 3 types of gap overlapping: full gap (no overlapping), wick-wick and wick-body overlapping up to a specified % of candle body
- finds all types of gaps with pro filters for price, time, large, volume, timerange, candle size, doji gaps
- individual show/hide flags for each gap/char based on gap type
- can show/hide gaps/chars based on gap dir
- changes color of gaps/chars based on gap dir/type, multi color gap type combos
- displays chars above/below bar based on gap dir
- can show/hide weekend gaps
- counts all filtered gaps
Colors:
Basically There are 2 gap types (Price, Time) x 2 directions (Up, Down) x 2 modifiers (Large, Volume), Volume Gap is a separate class with its own modifiers, so more accurately:
- (Price, Time) x 2 directions (Up, Down) x Large modifier
- (Price Volume, Time Volume) x 2 directions (Up, Down) x Large modifier
using a total of 16+1 colors or 8+1 base colors + transparency modifier
depending on settings you can highlight gaps using any multi color combo from just 1 to all 16 colors (+1 gray color for weekends).
basic gap = 1 base color with normal transparency
price,time = 2 base colors (including basic gap) with normal transparency (+1 color)
* up,down dir = +2 new base colors with normal transparency (including 2 base colors), with a total of 2*2 = 4 price/time base colors (+2 colors)
* large = same 4 base colors with vivid transparency modifier (+4 colors)
* volume = +2 new base colors with normal transparency, a separate class (+2 colors)
* volume * up,down dir = +another 2 new base colors with normal transparency (including 2 volume base colors), with a total of 2*2 = 4 volume base colors (+2 colors)
* volume * large = 4 volume base colors with vivid transparency modifier (+4 colors)
weekend_gap = gray (+1 color)
doji gap, candle gap, timerange gap = no special color, inherits color from parent gap type
for more details, please see the Gap Color Hierarchy comments in code
_________________________________________________________________________
You can find the following gap related terminology in literature: full, partial, extreme, breakaway, runaway/continuation, common, exhaustion gaps.
There are no exact rules to distinguish between them, so this can't be implemented.
When defining a gap it all boils down to how do you plot a gap, which points between adjacent candles do you consider a gap. Different sources apply different methodology
but in practice only 3 types of gap overlapping can exist:
- full gap (no overlapping),
- partial (wick-wick overlapping) and
- extreme partial (wick-body overlapping up to a specified % of a candle body)
All these types are supported in this script. The only possible remaining option is candle-candle overlapping which is not a gap by definition.
Many other script specific subtypes are also supported. Please see description of each gap type below and comments in code.
General display modes
- gap has 3 possible overlapping modes: full gap (no overlapping), wick-wick overlapping, wick-candle overlapping up to a specified % of candle body size (for mode 3 only)
the remaining candle-candle overlapping implies not a gap by definition
full gap mode will find the least amount of gaps, wick-candle - the most
- gap can be either price or time, up or down, and shown above or below the candles (gap chars)
- by definition, a price gap is a smaller subset of a time gap, a gap within current session with a price gap and zero time lag between bars.
Therefore timerange filter is useless for price gaps, but can still be applied.
On the other hand, all price gap filters can be applied to time gaps without any distinction.
- gap can have multiple modifier subtypes: (price|time) * (up|down) * (large? + volume? + doji? + timerange? + weekend?)
i.e. price + large + volume + doji or time + large + volume + timerange + doji + weekend
- the gap is always counted only once no matter how many subtype modifiers it has
- if the gap does not satisfy any of the applied flags/filters it is not shown/counted (no gap bars/chars are shown)
- gap color can depend on a combo of gap type/dir and modifier subtypes or can be shown in a single base color
- char color can only depend on gap dir (not type/modifiers) or can be shown in a single base color
- char position can also depend on gap dir (above/below) the gap candle. Alternatively you can pin chars to the top/bottom of the screen in UI Styles.
- change_by_type = true - uses gap type base colors (2 colors + optional modifiers, up to 8 colors if volume and/or large filters are enabled)
- change_by_dir = true - uses gap dir base colors (2 colors + optional modifiers, up to 8 colors if volume and/or large filters are enabled)
- both change_by_type and change_by_dir = true - uses both gap type and dir base colors (4 colors + optional modifiers, up to 16 colors if volume and/or large filters are enabled)
- both change_by_type and change_by_dir = false - uses a single base gap color (1 color)
- don't need that much colors - disable filters
- highlight bars has priority over individual gap flags, when it is false all gaps are hidden regardless of their corresponding flag settings (does not affect dim weekend gaps)
- show chars has priority over individual gap char flags, when it is false all char flags are hidden regardless of their corresponding flag settings
- price gaps are only shown/counted when show_price_gaps flag is true. The large or volume filters can be used to narrow down results further.
- time gaps are only shown/counted when show_time_gaps flag is true. The large, volume, and timerange filters can be used to narrow down results further.
- doji gaps are only shown/counted when show_doji_gaps flag is true. The doji candle size and other filters can be used to narrow down results further.
- show weekend gaps = true and dim weekend gaps = false - shows/counts weekend gaps
- show weekend gaps = true and dim weekend gaps = true - dims weekend gaps, doesn't show/count weekwend gaps
- show/dim weekend gaps do just that - show the gap if it happens on a weekend, not all weekends
- large gaps are only shown/counted when the large filter is enabled != 0. positive values 5 (>= 5), negative -5 (<=5) are used to switch between <>
- volume gaps are only shown/counted when the volume filter is enabled != 0. positive values 5 (>= 5), negative -5 (<=5) are used to switch between <>
- timerange gaps are only shown/counted when the timerange filter is enabled != 0. positive values 5 (>= 5), negative -5 (<=5) are used to switch between <>
- candle size gaps are only shown/counted when the candle size filter is enabled != 0. positive values 5 (>= 5), negative -5 (<=5) are used to switch between <>
- candle size filter is the only filter with 2 arguments, use_and_for_delta to enable AND condition for the args (OR is the default)
Good Luck! Feel free to explore and learn from the code

TRI MA DominoBlue lines are first group (3,5,8,13,21) SMA and red lines are second group (35,40,45,50,55) SMA. When blue lines cross above red lines that signals bull market and vice versa. More lines we have above or bellow (creating domino effect) the stronger the signal for bull/bear.
This indicator should be used to determine where are we currently in the market and should we expect trend change/transition or continuation.
It should not be used as sole indicator for taking trades but as a tool to help you with TA and your trading plan.
Good hunting ;)

RSI / Stoch / SRSI / MFI / Aroon Overlay [SigmaDraconis]Combines 4 popular indicators (RSI, Stoch, SRSI, MFI) and 1 peculiar one (Aroon) in 1 for those who want to save indicators but not only.
This is an evolution of my (simpler) "RSI / Stoch / Stoch RSI (SRSI) Overlay " that you can find on my scripts.
Added bands for oversold/overbought areas (70/30 common for RSI and 80/20 for SRSI and MFI), as well as a middle 50 horizontal line.
Neutral bands around 55-45 added as well that can be hidden for less clutter. I also recommend a more transparent coloring for these since Pine script doesn't allow default transparency for horizontal lines.
By default only RSI and Stoch are activated, you can activate Aroon, MFI and SRSI on the inputs window.
Some extra notes:
* RSI, Stoch and MFI can help to strengthen one's decision as well as Aroon to predict a possible trend reversal, SRSI can show when RSI has high probability of being topped or bottomed when oversold/overbought but don't forget to look at volume and how the trend progresses that can keep SRSI above 80 or below 20 while RSI and price continues to trend, divergences are most helpful here to find possible reversal areas.
* This chart depicts some interesting divergences, as well as Stoch tops and bottoms and confluences between RSI/MFI and Stoch on some over-extended tops and bottoms that shown being good reversal zones.
RSI resistances are shown as well, failing to break above 60 or the neutral zone (this is a bearish BTC trend chart after all) or failing to gain support to break up certain levels (RSI notes a more bullish trend when consistently above 60 and more bearish below 40).
If you like it and use it to profit, please tip me below :)
Tip jars:
BTC: 15nMBiEGVrdGcu9C1h6QRcTNRvugHkqrMQ
ETH: 0xC33845946c48B61fBCbEA0367ec2238CaF2b73bc
BTS: sigma-draconis

Deviation Scaled Moving Average The" Deviation-Scaled Moving Average” developped by the author John Ehlers, introduces a new adaptive moving average that has the ability to rapidly adapt to volatility in price movement. The author explains that due to its design, it has minimal lag yet is able to provide considerable smoothing. He suggest to combine 2 dsma with different period (40 and 100) to buy/sell at the cross.

SHERRIFx (variation) IN TRENDI share this script where I made some modifications to the SHERRIF strategy to perform trend scalping.
I use:
- Bollinguer Bands (20)
- CCIs (14 and 40)
- EMAS (20, 57, 100, 200)
- Stochastics (13,3,3) in 70, 30.
I apply in low temporalities, especially M15 and M1, it can also be used to make binaries or in higher temporalities by modifying the constants.
If you improve this program, share it.
Greetings.


Reverse Engineered RSI - Key Levels + MTFThis indicator overlays 5 Reverse Engineered RSI (RERSI) levels on your main chart window.
The RERSI was first developed by Giorgos Siligardos in the June 2003 issue of Stocks and Commodities Magazine. HPotter provided the initial implementation - from which this script is derived - so all credit to them (see: ).
In simple terms, RERSI plots lines on the price chart that reflect levels of the RSI . E.g. if you set up a RERSI line at a level of 50, then price will touch that line when the standard RSI indicator reads 50. Hopefully that makes sense, but compare the two if it doesn't.
Why is the RERSI useful if it's just plotting RSI values? Well, it simplifies things, and enables you to get a clearer picture of trend direction, RSI support and resistance levels, RSI trading signals, and it keeps your chart window uncluttered.
I've set up 5 RERSI lines to be plotted: Overbought and Oversold Levels, a Middle Level (generally leave this at 50), and then Down/Up Trend Lines. The latter two are loosely based on the work of Constance Brown (and they in turn were influenced by Andrew Brown), who posited that RSI doesn't breach certain levels during trends (e.g. 40-50 is often a support level during an uptrend).
Play around with the levels, and the RSI Length, to see how your particular market reacts, and where key levels may lie. Remember, this isn't meant as a stand-alone system (although I think there's potential to use it as such, especially with price action trading - which I guess wouldn't make it stand-alone then!!), and works best with confirmation from other sources.
Oh, and there's MTF capability, because I think that's useful for all indicators.
Any queries, please let me know.
Cheers,
RJR

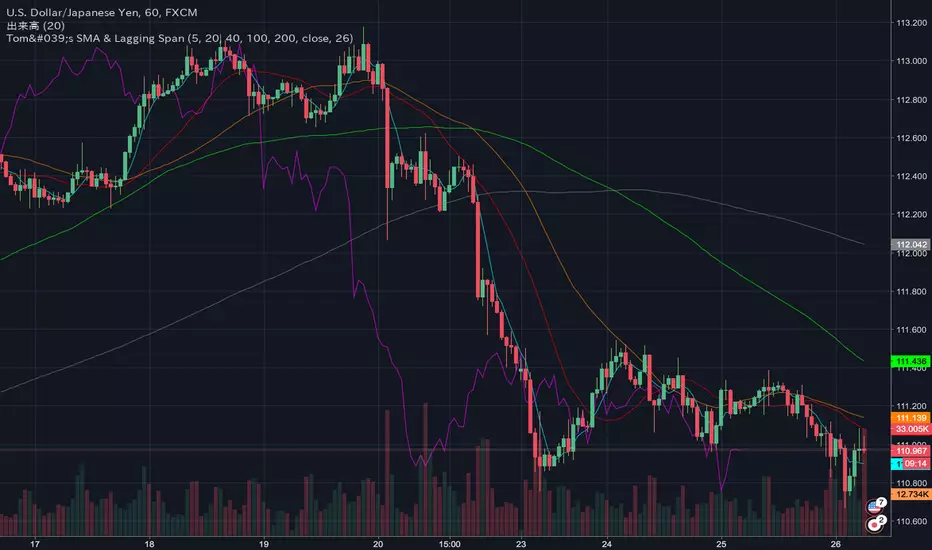
Tom's Moving Average & Lagging SpanSinple Moving Average 5 / 20 / 40 / 100 / 200
Ichimoku Lagging Span
tom_btcfx_fx setting
Inverted Yield Curve with VIX Fear IndexUS 2 year and US 10 year comparison, inverted yield curve with VIX. I use this on a weekly chart with 2 moving averages, the 40 week (ma200 daily) and the 520 week (10 year median).
The bottom histogram is the VIX and the plot is the yield curve. When the VIX is above a certain level (you can set it in settings) and the ýield curve is close to or at inversion the background goes red.
The last seven recessions were preceded by an inverted yield curve. Here I combined the two main fear indexes, the VIX and the run for safe US treasuries (Inverted Yield Curve).
This is preset to the 2 year and 10 year US bond, weekly, and the normal VIX ticker but you can set it to whatever you like.
Published with source code for anyone to modify. Please comment below if you do so! This is the second in a series of indicators I intend to publish as a package of economic recoverty/recession symptom indicators.
Follow me for updates, next one up is commodities with dr Copper and oil!

tvial/rsiSimple RSI indicator including:
- 40 & 60 support/resistance
- visual marker (orange bgcolor) on RSI length limit to spot actual RSI divergences
- simple layout

Donchian Mean Reversion AlertsDonchian Channels mean reversion signals/alerts with RSI filtering with signals applied to the mean, for strong trend situations.
Original Author: ChrisMoody
Modified Donchonian Channel with separate adjustments for upper and lower levels
Purpose is if you expect big move up, Use lower input example 3 or 4, and longer lower input, 40 - 100 and use lower input line as a stop out
Opposite if you expect big move down
Mid Line Rule in Long Example. If lower line is below entry take partial profits at Mid Line and move stop to Break even.
If Lower line moves above entry price before price retraces to midline use Lower line as Stop...Opposite if Shorting
Created by user ChrisMoody 1-30-2014
Updated 7-11-2018 by Dysrupt
Revamped for mean reversion strategy
Created midline alerts for strong trending upside buy signals/downside sell signals.
Added RSI Filtering
Added Alerts
Removed bar color change
Fib,Guppy Multiple MA(FGMMA)(A/D & Volume Weight,SMA,EMA)[cI8DH]Features:
- 3 + 12 MAs (12 is chosen because Guppy has 12 MAs)
- MA types can be set to Simple, Exponential, Weighted, and Smoothed
- Volume weight can be applied to all available MAs (the built-in VWMA uses Simple MA)
- It is possible to count in only effective portions of the volume in the equation by using Accum/Dist Volume Weight
- Secondary smoothing (useful when volume weight is enabled)
- Predefined MA sets based on Fibonacci sequence (2,3,5,8,.., 377), Guppy (3,5,8,10,12,15 &30,35,40,45,50,60), and cI8DH (2,3,5,8,12,17 & 30,34,39,45,52,60)
Recommended settings:
- hlc3 as input source captures all the essential information encapsulated in a candle. I'd use hlc3 as the default option. In uptrend, "low" and in downtrend, "high" might give more relevant results when using MAs for structural analysis of a market. For commonly used MAs (EMA20, SMA50,100,200), "close" should be used due to their self-fulfilling prophecy effect.
- When you have volume weight above 0, you may want to use secondary smoothing.
- Try not to use Simple MA for smaller lengths (below 20). Sharp changes in the past (right before the period specified by the length) will affect the current value of MA dramatically leading to confusion.
- I am using the first 3 MAs for SMA 50,100,200. You can disable them from the MA type selector all at once when using Fib or Guppy ribbons.
MA-based analysis:
There are different ways of structuring a market. Geometrical (trend lines, channels, fans, patterns, etc) and Fib retracement-based structuring is very common among traders. MAs give an alternative way of analyzing markets. MA ribbons such as Guppy (6 slow and 6 fast-moving MAs) are popular for analyzing market flow. IMO default Guppy sets are a bit random as the numbers do not have an elegant sequence. So I proposed my sets based on increasing sequene spacing (+1). These two MA ribbons are good for market flow analysis but the spacing of the MAs are not ideal for structuring a market. Ribbons based on the Fib sequence is a better choice for structuring a market. This is the equivalent of Fib channels but in a more dynamic form. Among other things, MA Fib ribbon can be used to assess market momentum and to compare different stages of a market. Here are two "educational-only" examples:
Notes:
- Smoothed MA with length L = Exponential MA with length 2*L-1
- Read the background section in my ADP indicator to understand how A/D Volume is calculated
