Bollinger Bands with RSI Buy/Sell Signals (15 min) Bollinger Bands with RSI Buy/Sell Signals (15 Min)
Description:
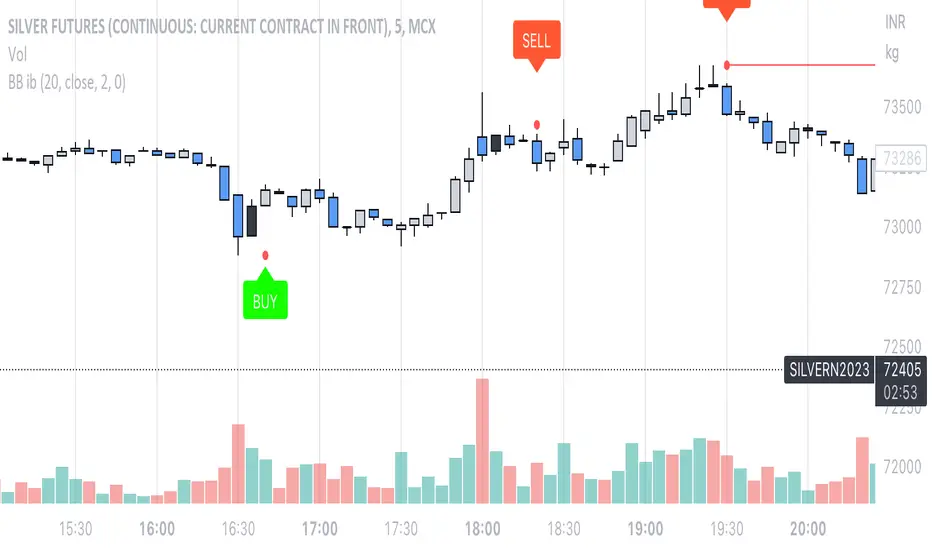
The Bollinger Bands with RSI Buy/Sell Signals (15 Min) indicator is designed to help traders identify potential reversal points in the market using two popular technical indicators: Bollinger Bands and the Relative Strength Index (RSI).
How It Works:
Bollinger Bands:
Bollinger Bands consist of an upper band, lower band, and a middle line (Simple Moving Average). These bands adapt to market volatility, expanding during high volatility and contracting during low volatility.
This indicator monitors the 15-minute Bollinger Bands. If the price moves completely outside the bands, it signals that the market is potentially overextended.
Relative Strength Index (RSI):
RSI is a momentum indicator that measures the strength of price movements. RSI readings above 70 indicate an overbought condition, while readings below 30 suggest an oversold condition.
This indicator uses the RSI on the 15-minute time frame to further confirm overbought and oversold conditions.
Buy/Sell Signal Generation:
Buy Signal:
A buy signal is triggered when the market price crosses above the lower Bollinger Band on the 15-minute time frame, indicating that the market may be oversold.
Additionally, the RSI must be below 30, confirming an oversold condition.
A "Buy" label appears below the price when this condition is met.
Sell Signal:
A sell signal is triggered when the market price crosses below the upper Bollinger Band on the 15-minute time frame, indicating that the market may be overbought.
The RSI must be above 70, confirming an overbought condition.
A "Sell" label appears above the price when this condition is met.
Tìm kiếm tập lệnh với "弘历投教boll指标代码分析"

Bollinger Bands & SuperTrend Strategy by Tradinggg HubThis TradingView Pinescript combines Bollinger Bands and a custom SuperTrend indicator to generate trading signals.
Bollinger Bands:
Bollinger Bands are a popular volatility indicator that consists of three lines:
* Basis: A simple moving average (SMA) of the price (default length is 20 periods).
* Upper Band: The basis plus a standard deviation multiplier (default is 2).
* Lower Band: The basis minus a standard deviation multiplier (default is 2).
These bands expand and contract as volatility increases or decreases, helping traders identify potential overbought and oversold conditions.
SuperTrend:
The SuperTrend indicator is a trend-following tool that aims to identify the direction of the price trend. It uses the Average True Range (ATR) to determine the volatility of the market and sets levels above and below the price to indicate potential trend reversals.
How the Strategy Works:
1. Bollinger Bands: The script plots Bollinger Bands around the price, providing insight into the current volatility and potential overbought or oversold conditions.
2. SuperTrend: The script calculates and plots a custom SuperTrend indicator based on user-defined ATR period and factor. It helps visualize the current trend direction and potential trend reversals.
3. Buy Signals: A buy signal is generated when the following conditions are met:
- The price crosses above the SuperTrend line.
- The price is above the Bollinger Bands basis line.
4. Sell Signals: A sell signal is generated when one of the following conditions is met:
- The price crosses below the SuperTrend line.
- The price is below the Bollinger Bands basis line.
Key Parameters:
* Bollinger Bands Length: The number of periods used to calculate the basis (SMA) of the Bollinger Bands.
* Bollinger Bands Multiplier: The factor used to calculate the standard deviation for the upper and lower bands.
* SuperTrend ATR Period: The number of periods used to calculate the Average True Range (ATR) for the SuperTrend.
* SuperTrend Factor: The factor used to determine the distance of the SuperTrend levels from the price.
Customization:
Feel free to experiment with different parameter values to optimize the strategy for your preferred asset and time frame.
Disclaimer:
This script is intended for educational and informational purposes only. It should not be considered as financial advice. Always conduct thorough research and consider your own risk tolerance before making any trading decisions.
Bollinger Bands with Squeeze and SMA Indicator Description: BB+SMA
Overview:
Bollinger Bands (BB): Computes and plots three bands based on a selected moving average type (SMA, EMA, SMMA (RMA), WMA, VWMA) and standard deviation multiplier. The bands indicate potential support and resistance levels relative to price volatility.
Squeeze Condition: Detects periods of low volatility (squeeze) when the distance between the upper and lower Bollinger Bands narrows significantly. This condition can signal potential price breakouts.
Simple Moving Average (SMA): Calculates and plots a simple moving average based on user-defined length. It smooths price data to highlight trends and potential reversals.
Smoothing Line: Further enhances the SMA by applying different smoothing methods (SMA, EMA, SMMA (RMA), WMA, VWMA) over a specified smoothing length. It helps in identifying smoother trends and changes in direction.
Key Components:
Inputs: Users can adjust parameters such as Bollinger Bands length, type of moving average, standard deviation multiplier, squeeze condition length, squeeze threshold percentage, SMA length, smoothing method, and smoothing length.
Plotting: Displays the Bollinger Bands (basis, upper, lower), SMA, squeeze condition bands (basis, upper, lower), and a smoothing line on the chart.
Visualization: Utilizes different colors and line styles for clarity in visualizing each component's plot on the chart.
Purpose:
Helps traders identify potential price volatility, trend reversals, and breakout opportunities using Bollinger Bands, SMA, squeeze conditions, and smoothed moving averages.
Enhances technical analysis by providing clear visual cues for trend strength and potential entry/exit points based on the specified parameters.
Conclusion:
The "BB+SMA" indicator integrates multiple technical analysis tools into a single script, offering traders a comprehensive approach to analyzing price movements and making informed trading decisions directly on TradingView charts.

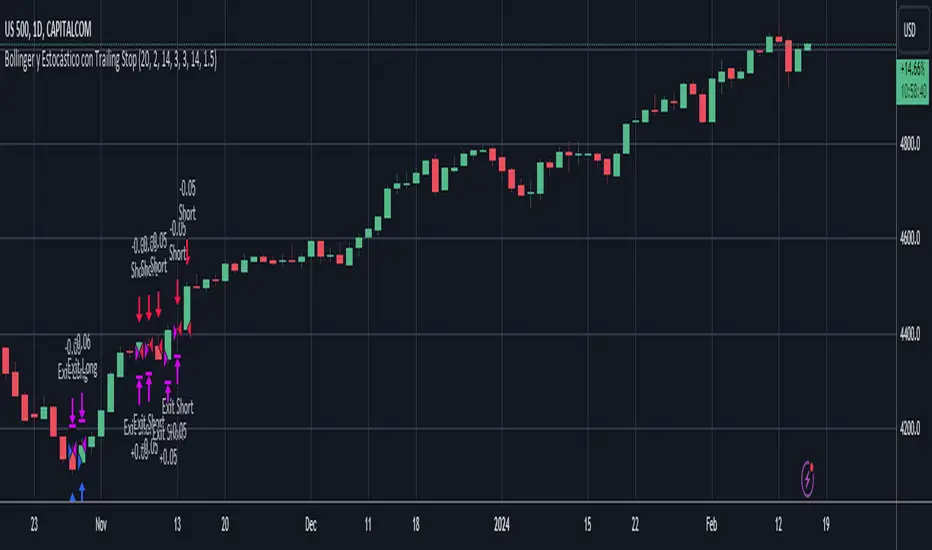
Bollinger and Stochastic with Trailing Stop - D.M.P.This trading strategy combines Bollinger Bands and the Stochastic indicator to identify entry opportunities in oversold and overbought conditions in the market. The aim is to capitalize on price rebounds from the extremes defined by the Bollinger Bands, with the confirmation of the Stochastic to maximize the probability of success of the operations.
Indicators Used
- Bollinger Bands Used to measure volatility and define oversold and overbought levels. When the price touches or breaks through the lower band, it indicates a possible oversold condition. Similarly, when it touches or breaks through the upper band, it indicates a possible overbought condition.
- Stochastic: A momentum oscillator that compares the closing price of an asset with its price range over a certain period. Values below 20 indicate oversold, while values above 80 indicate overbought.
Strategy Logic
- Long Entry (Buy): A purchase operation is executed when the price closes below the lower Bollinger band (indicating oversold) and the Stochastic is also in the oversold zone.
- Short Entry (Sell): A sell operation is executed when the price closes above the upper Bollinger band (indicating overbought) and the Stochastic is in the overbought zone.
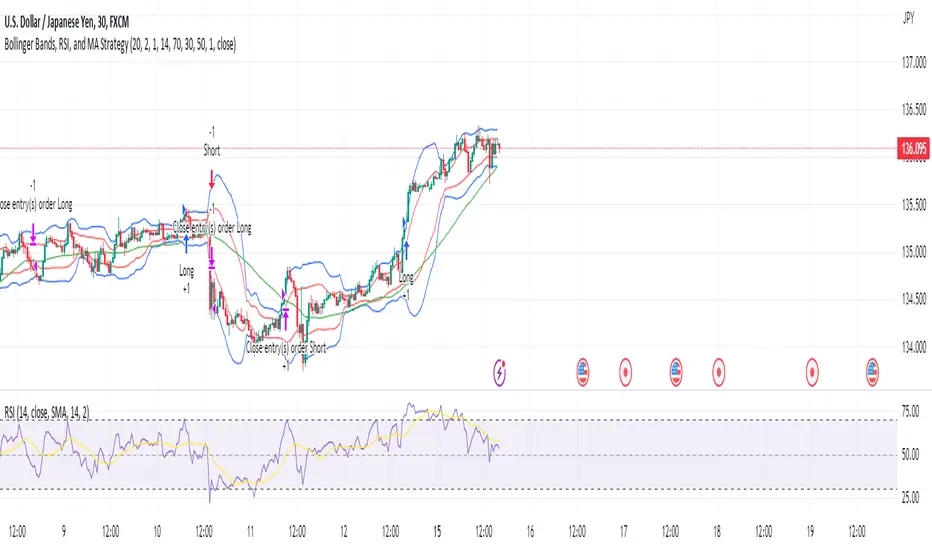
Bollinger Bands, RSI, and MA StrategyThe "Bollinger Bands, RSI and MA Strategy" is a trend-following strategy that combines the Bollinger Bands indicator, the Relative Strength Index (RSI), and a moving average (MA). It aims to identify potential entry and exit points in the market based on price volatility, momentum, and trend.
The strategy uses two Bollinger Bands with different standard deviations to create price channels. The default settings for the Bollinger Bands are a length of 20 periods and a standard deviation of 2.0. The upper and lower bands of the Bollinger Bands serve as dynamic resistance and support levels, respectively.
The RSI indicator is employed to gauge the strength of price momentum.
The strategy also incorporates a 50-period moving average (MA) to help identify the overall trend direction. When the price is above the MA, it suggests an uptrend, and when the price is below the MA, it suggests a downtrend.
The entry conditions for long trades are when the RSI is above the overbought level and there is no contraction in the Bollinger Bands. For short trades, the entry conditions are when the RSI is below the oversold level and there is no contraction in the Bollinger Bands.
The exit conditions for long trades are when the RSI drops below the overbought level or when the price closes below the 50-period MA.
For short trades, the exit conditions are when the RSI goes above the oversold level or when the price closes above the 50-period MA.
The strategy generates alerts for potential long and short entry signals, as well as for exit signals when the specified conditions are met. These alerts can be used to receive notifications or take further actions, such as placing trades manually or using automated trading systems.
It is important to note that this strategy serves as a starting point and should be thoroughly backtested and validated with historical data before applying it to live trading. Additionally, it is recommended to consider risk management techniques, including setting appropriate stop-loss and take-profit levels, to effectively manage trades.
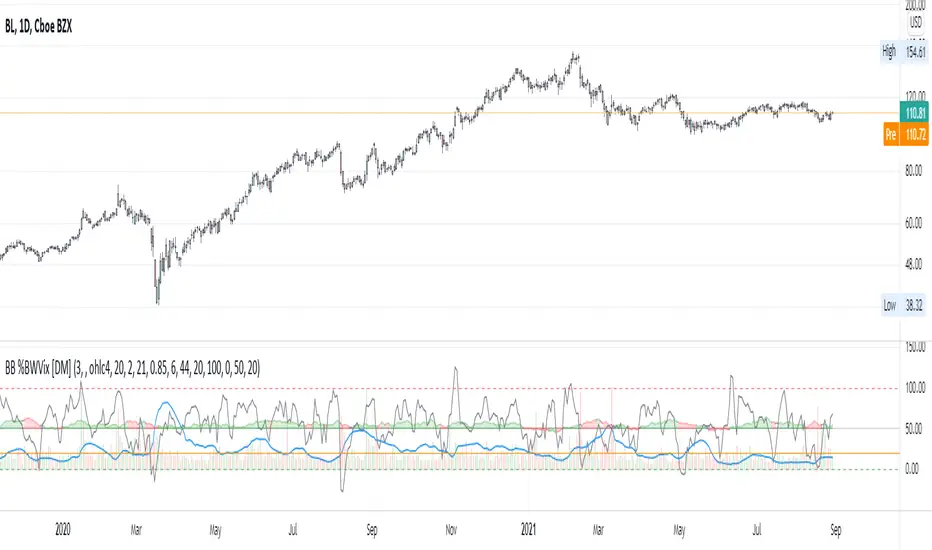
Bollinger Bands Width + %B + Vol. + Intraday Idx Alma var [DM]Greetings Colleagues here I published another script of the series "Alma Variant"
This script incorporates four different standard signals from Bollinger Band Book.
Signals:
Bollinger Band Width. Line blue
Bollinger Band %B. Line gray
Intraday intensity Index “normalized using log(volume)”. Oscillator line in the middle of the indicator with decision color green = buy, red=sell, purple=na
Bollinger Band Volume “normalized, decreased to 20% and limited to 100”
Alerts:
Bollinger Band (%B) Alert Level with your switch
Bollinger Band (Width) Alert Level with your switch
BB (Volume) Alert with your switch
Setting.
Individual ma settings
All alerts can be adjusted
The color of the Intraday intensity index background and lines help you decide on your volatility breakout direction
The background color has been conditioned to smoothed X periods for the accumulated volume above the alert level, Intraday Intensity Index direction and %B direction.
I recommend for the use of this indicator to first read John Bollinger's book to understand the usefulness of each of the signals and their configuration to execute the orders.
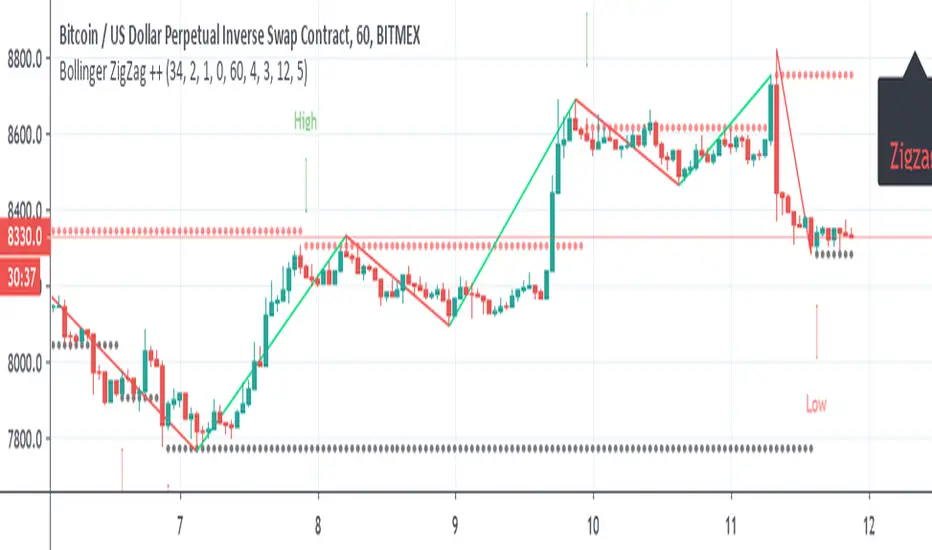
Bollinger ZigZag ++so I cross the Bollinger with the zigzag by request of someone who ask it
it seems nice as they fit quite well
best buy option is when zigzag change direction bellow Bollinger low =dark line
and sell above Bollinger high and change direction
the high and low are point of Bollinger high and low
you can make the Bollinger as MTF
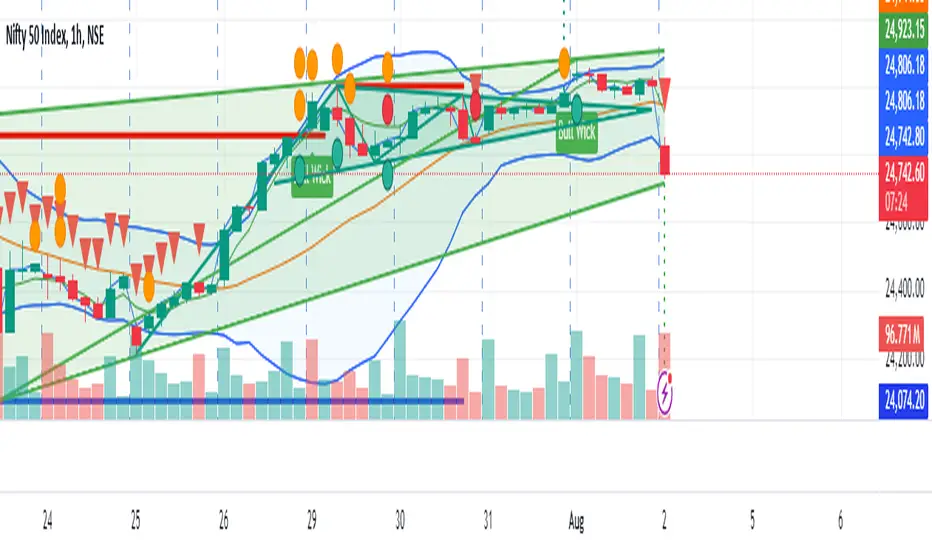
Bollinger Bands + MA 50/100/200📊 Bollinger Bands + MA 50 / 100 / 200 Indicator
This indicator combines Bollinger Bands with key Moving Averages (50, 100, 200) to help you spot trend direction, volatility, and potential reversal zones in one clean view.
🔹 Bollinger Bands
* Customizable length & MA type (SMA, EMA, RMA, WMA, VWMA)
* Visualizes market volatility
* Upper & lower bands help identify overbought / oversold conditions
🔹 Moving Averages
* MA 50 → Short-term trend
* MA 100 → Medium-term trend
* MA 200 → Long-term trend & major support/resistance
* Easy toggle on/off for clean charting
💡 How to use
* Price near upper band + strong MA trend → possible continuation
* Price near lower band → watch for bounce or breakdown
* MA alignment (50 > 100 > 200) → bullish trend
* MA cross & BB squeeze → potential breakout incoming
⚠️ Best used with price action & risk management
📌 Works on stocks, crypto, forex, indices

Bollinger Bands (Log Scale)📈 Bollinger Bands on log scale are broken.
Many traders use log charts for better price symmetry—but still apply Bollinger Bands calculated on linear price. That mismatch creates distorted signals.
Here’s what I found:
- Standard deviation becomes misleading on log scale
- Band width no longer reflects true volatility
- Breakout signals lose behavioral clarity
🛠 So I rewrote the logic.
My version calculates Bollinger Bands using log(price) for both mean and deviation, then maps the result back to price. It behaves correctly on log charts and aligns better with behavioral scoring.

KhoiHV - Bollinger Bands Buy/Sell Area ProBollinger Bands Buy/Sell Area Pro is a professional-grade indicator designed to identify potential trading opportunities based on Bollinger Bands. It highlights dynamic buy and sell areas by combining price action with volatility, helping traders quickly visualize market conditions.
✨ Key Features
Automatically plots upper, middle, and lower Bollinger Bands.
Marks Buy Areas when price enters oversold zones near the lower band.
Marks Sell Areas when price enters overbought zones near the upper band.
Configurable inputs for length, source, and multiplier to fit any trading style.
Easy-to-read chart visuals with colored zones for instant recognition.
💡 How to Use
Look for Buy Areas near the lower band in trending markets to catch potential rebounds.
Watch for Sell Areas near the upper band to anticipate possible pullbacks.
Combine with volume, momentum, or trend indicators for stronger confirmation.
This tool is especially useful for traders who want a clear, visual edge in spotting volatility-based entries and exits without constantly recalculating signals.
Bollinger Bands SMA 20_2 StrategyMean reversion strategy using Bollinger Bands (20-period SMA with 2.0 standard deviation bands).
Trade Triggers:
🟢 BUY SIGNAL:
When: Price crosses above the lower Bollinger Band
Logic: Price has hit oversold territory and is bouncing back
Action: Places a long position with stop at the lower band
🔴 SELL SIGNAL:
When: Price crosses below the upper Bollinger Band
Logic: Price has hit overbought territory and is pulling back
Action: Places a short position with stop at the upper band
Bollinger + EMA Strategy with StatsThis strategy is a mean-reversion trading model that combines Bollinger Band deviation entries with EMA-based exits. It enters a long position when the price drops significantly below the lower Bollinger Band by a user-defined multiple of standard deviation (x), and a short position when the price exceeds the upper band by the same logic. To manage risk, it uses a wider Bollinger Band threshold (y standard deviations) as a stop loss, while take profit occurs when the price reverts to the n-period EMA, indicating mean reversion. The strategy maintains only one active position at a time—either long or short—and allocates a fixed percentage of capital per trade. Performance metrics such as equity curve, drawdown, win rate, and total trades are tracked and displayed for backtesting evaluation.

Bollinger Free BarsIdentify Extreme Price Actions with Non-Overlay Visualization
Core Functionality
This indicator detects two types of Bollinger Band breakout patterns without cluttering your chart:
1 ️⃣ Half Breakout Bar (Blue Triangles)
- Triggers when both open & close prices are outside the Bollinger Bands
- Suggests strong directional momentum continuation
2 ️⃣ Complete Breakout Bar (Red Flags)
- Activates when entire price action (including wicks) stays outside the bands
- Signals extreme volatility exhaustion points
Feature Highlights
◾ Smart Band Display
Translucent bands (#2196F3 & #FF9800 with 70% transparency) maintain chart clarity while showing dynamic volatility ranges
◾ Parameter Customization
- Adjustable period (default 20) & deviation multiplier (default 2.0)
- Selectable price source (close/open/high/low)
◾ Statistical Validation
Based on Bollinger Band's 95.4% price containment principle, signals filter out 4.6% extreme market conditions for high-probability scenarios.
Recommended Usage
1. Combine with volume analysis (significant breakout with high volume increases signal reliability)
2. Confirm with trend lines or RSI divergence
3. Adjust transparency via "Style" tab for multi-indicator layouts
Code Safety
- No repainting: All calculations use historical price data only
- No external network requests
- Open-source logic compliant with Pine Script v6 standards
Disclaimer
This tool is for technical analysis education only. Past performance doesn't guarantee future results. Always validate signals with fundamental analysis and proper risk management.

Bollinger Bands color candlesThis Pine Script indicator applies Bollinger Bands to the price chart and visually highlights candles based on their proximity to the upper and lower bands. The script plots colored candles as follows:
Bullish Close Above Upper Band: Candles are colored green when the closing price is above the upper Bollinger Band, indicating strong bullish momentum.
Bearish Close Below Lower Band: Candles are colored red when the closing price is below the lower Bollinger Band, signaling strong bearish momentum.
Neutral Candles: Candles that close within the bands remain their default color.
This visual aid helps traders quickly identify potential breakout or breakdown points based on Bollinger Band dynamics.

Bollinger Bubble BreakoutOverview:
This script leverages the principles of Bollinger Bands (BB), a popular tool for measuring volatility and identifying extreme price levels of overbought or oversold conditions. When the price closes outside the upper or lower bands, there is a strong probability that it will revert back inside the bands, typically in two steps:
First, towards the EMA 7 (fast exponential moving average).
Then, towards the SMA 20 (the middle line of the BB).
How It Works:
Outer BB Closes: When a candle closes beyond the upper or lower Bollinger Bands, it typically signals an extreme price extension (high volatility or impulsive movement).
Mean Reversion: Generally, the price tends to revert quickly inside the bands, with the first target being the EMA 7 and the second being the SMA 20. This behavior is based on the mean-reverting nature of Bollinger Bands, which act as dynamic price boundaries.
Alert Signal: The script highlights these closes and visually marks areas where potential reversals or technical corrections might occur.
Usage:
Ideal for traders aiming to exploit extreme moves for counter-trend trades or profit-taking opportunities.
Works best in volatile markets, but caution is advised during strong trends where prices can stay extended outside the bands.
Combine this tool with other indicators (such as RSI or MACD) to confirm signals.
Precautions:
The signals generated do not guarantee an immediate reversion. In strong trending markets, the price can "ride" the outer bands for several candles.
Strict risk management is advised: always use appropriate stop-loss levels based on your risk tolerance.
Practical Example:
When the price closes above the upper band:
Expect a correction towards the EMA 7 and then the SMA 20.
When the price closes below the lower band:
Look for a potential bounce towards the same targets.
Conclusion:
This script is designed to help traders identify opportunities in overbought or oversold conditions. However, it is not financial advice but rather an analytical tool to incorporate into your trading strategy.

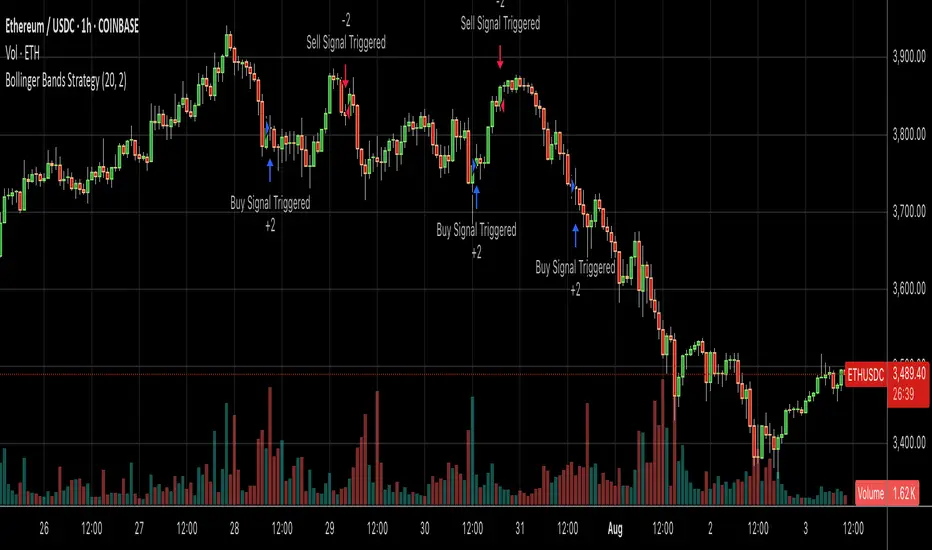
Bollinger Bands + RSI StrategyThe Bollinger Bands + RSI strategy combines volatility and momentum indicators to spot trading opportunities in intraday settings. Here’s a concise summary:
Components:
Bollinger Bands: Measures market volatility. The lower band signals potential buying opportunities when the price is considered oversold.
Relative Strength Index (RSI): Evaluates momentum to identify overbought or oversold conditions. An RSI below 30 indicates oversold, suggesting a buy, and above 70 indicates overbought, suggesting a sell.
Strategy Execution:
Buy Signal : Triggered when the price falls below the lower Bollinger Band while the RSI is also below 30.
Sell Signal : Activated when the price exceeds the upper Bollinger Band with an RSI above 70.
Exit Strategy : Exiting a buy position is considered when the RSI crosses back above 50, capturing potential rebounds.
Advantages:
Combines price levels with momentum for more reliable signals.
Clearly defined entry and exit points help minimize emotional trading.
Considerations:
Can produce false signals in very volatile or strongly trending markets.
Best used in markets without a strong prevailing trend.
This strategy aids traders in making decisions based on technical indicators, enhancing their ability to profit from short-term price movements.

Bollinger Bands Inside barthe indicator name is Bollinger Band inside bar because it uses Bollinger Band and inside bar to take counter-trend positions in the market. whenever this pattern is formed then it can be used to take an entry into the market. the candlestick pattern recognizes 3 candle candlestick. first the mother bar i.e. the medium to the big size candle that intersects with the upper and the lower levels of the Bollinger band. the second candle should be an inside bar i.e. the high and low of the current bar should be less than the previous bar. finally, the last bar who's low should be less than the mother bar in case of the mother bar is at upper levels and if the mother bar is at lower levels then the candle's high should be more than the mother bar. the stop-loss should be high and low of the mother bar respectively. entry should be taken as soon as the low and high of the mother bar is taken out respectively. target should be 1:1 or 20 sma or lower Bollinger band in case the entry is taken from the top. works best if there is a trend and the market takes a pullback and this pattern is formed.
Bollinger Stop StrategyClassic trading strategy using the Bollinger Bands indicator.
Strategy
Only stop orders are used to enter and exit the market.
If the price crossed the upper boundary of the Bollinger Bands, then enter into a long position (and close a short position).
If the price crosses the bottom of the Bollinger Bands, then enter short (and close a long position).
Short positions can be disabled (optional).
For
Crypto-currency market
Preferably coin/fiat (BTC/USD, ETH/USDT, etc)
Timeframe 1 day only
Settings
The original settings for the Bollinger Bands indicator are set by default.
Perhaps a better result will be if you use non-original price source.
Works well with OHLC4 and HLCC4.

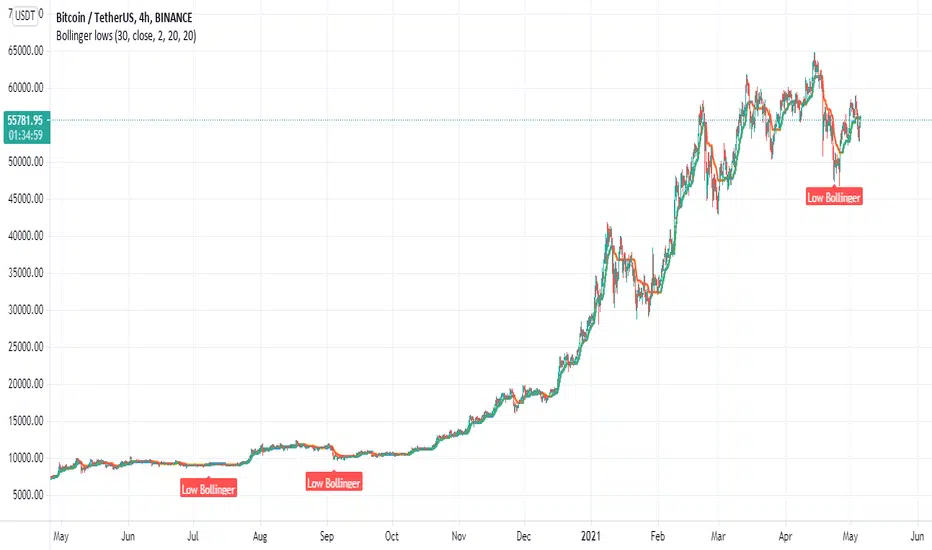
Bollinger lowsThe aim of this indicator is to find lows using a modified bollinger system
very simple system
first we have to bollinger levels with its modification
next is a trend line (green is up,orange is down)
once it cross the low bollinger levels it show signal of low bollinger which is our entry signal
try to play with settings to see best results
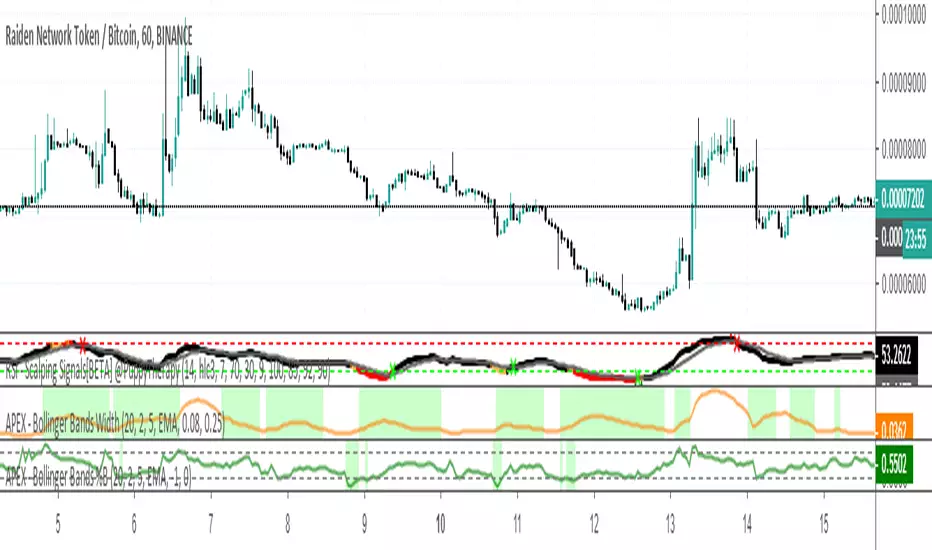
APEX - Bollinger Bands %BBollinger Bands %B is essentially BB Range it is an indicator derived from the standard Bollinger Bands. Bollinger Bands are a volatility indicator that creates a band of three lines which are plotted on the screen.
Bollinger Bands %B works the same as other momentum oscillators, it is best to look for short-term oversold in this case a volatility imbalance between upper and lower volatility. You are looking for values that are near 0 or negative.
Compared to other momentum Oscillators the %B is slightly less responsive than CCI but it does provide more signals than RSI / STOCH and STOCHRSI.
Bollinger Bands MTFMultiple Time Frame version of Bollinger Bands volatility indicator.
Developed by John Bollinger @bbands on Twitter
Here's the link to a complete list of all my indicators:
tr.tradingview.com
İndikatörü geliştiren: John Bollinger @bbands

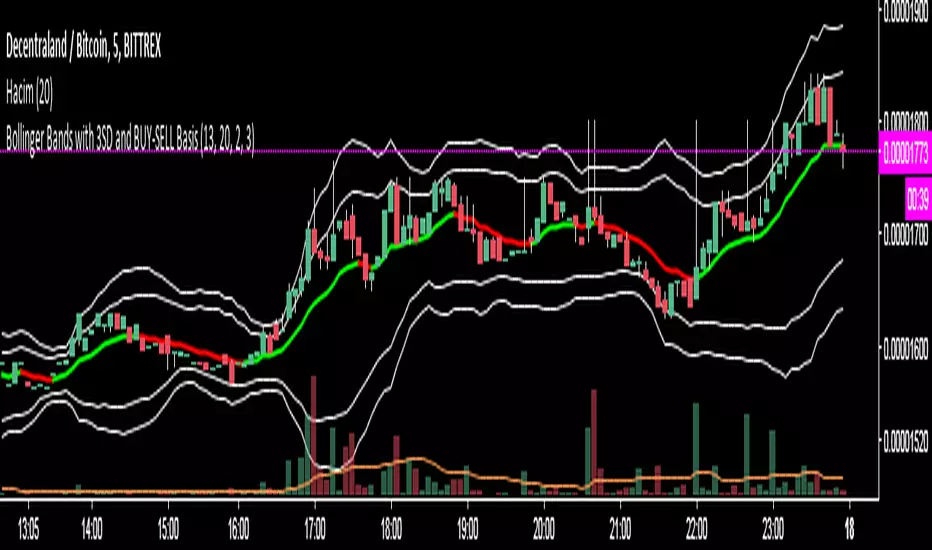
Bollinger Bands with 3SD and BUY-SELL Basis*The white lines(both inner and outer ones) are from original Bollinger Bands (calculated as SMA20+SD and SMA20-SD).
*Inner lines are calculated with 2 Standard Deviation ( as classical Bollinger Bands ) and outer ones are with 3 Standard Deviation.
*3 SD calculation is important because, it is useful to investigate further the volatility.
*Classical Bollinger Bands Basis is included in calculations to obtain the bands, but the basis isn't plotted (SMA20).
*For Basis, a-13 bar EMA line is added which tells "BUY" when GREEN, and which tells "SELL" when RED.
*Generally, this code is good to further investigate the volatility especially by the help of 3SD lines. It is particularly important for crypto currencies which are generally highly volatile. On the other hand, the basis will tell BUY-SELL points and BUY-SELL points can be confirmed further, by investigating classical Bollinger Bands rules and anticipate about the volatility.
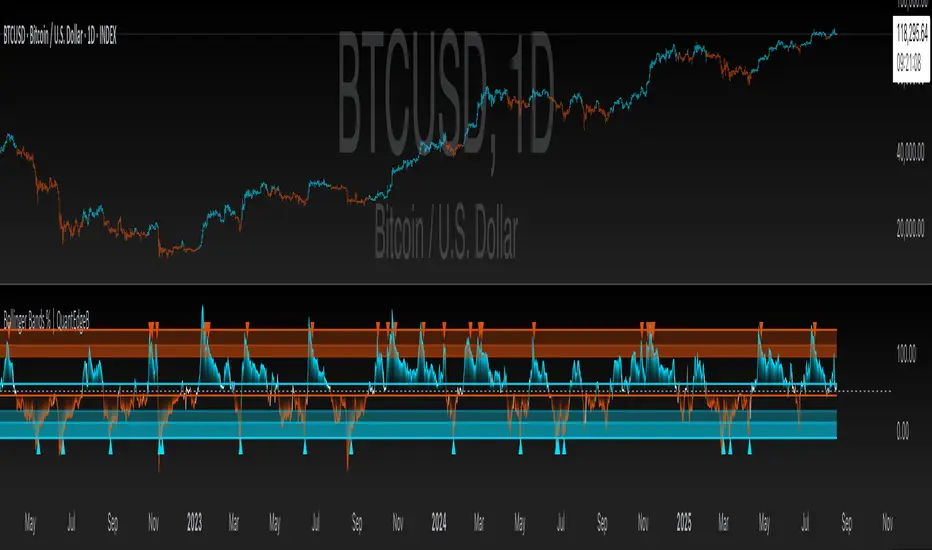
Bollinger Bands % | QuantEdgeB📊 Introducing Bollinger Bands % (BB%) by QuantEdgeB
🛠️ Overview
BB% | QuantEdgeB is a volatility-aware momentum tool that maps price within a Bollinger envelope onto a normalized scale. By letting you choose the base moving average (SMA, EMA, DEMA, TEMA, HMA, ALMA, EHMA, THMA, RMA, WMA, VWMA, T3, LSMA) and even Heikin-Ashi sources, it adapts to your style while keeping readings consistent across symbols and timeframes. Clear thresholds and color-coded visuals make it easy to spot emerging strength, fading moves, and potential mean-reversions.
✨ Key Features
• 🔹 Flexible Baseline
Pick from 12 MA types (plus Heikin-Ashi source option) to tailor responsiveness and smoothness.
• 🔹 Normalized Positioning
Price is expressed as a percentage of the band range, yielding an intuitive 0–100 style read (can exceed in extreme trends).
• 🔹 Actionable Thresholds
Default Long 55 / Short 45 levels provide simple, objective triggers.
• 🔹 Visual Clarity
Color-coded candles, shaded OB/OS zones, and adaptive color themes speed up decision-making.
• 🔹 Ready-to-Alert
Built-in alerts for long/short transitions.
📐 How It Works
1️⃣ Band Construction
A moving average (your choice) defines the midline; volatility (standard deviation) builds upper/lower bands.
2️⃣ Normalization
The indicator measures where price sits between the lower and upper band, scaling that into a bounded oscillator (BB%).
3️⃣ Signal Logic
• ✅ Long when BB% rises above 55 (strength toward the top of the envelope).
• ❌ Short when BB% falls below 45 (weakness toward the bottom).
4️⃣ OB/OS Context
Shaded regions above/below typical ranges highlight exhaustion and potential snap-backs.
⚙️ Custom Settings
• Base MA Type: SMA, EMA, DEMA, TEMA, HMA, ALMA, EHMA, THMA, RMA, WMA, VWMA, T3, LSMA
• Source Mode: Classic price or Heikin-Ashi (close/open/high/hlc3)
• Base Length: default 40
• Band Width: standard deviation-based (2× SD by default)
• Long / Short Thresholds: defaults 55 / 45
• Color Mode: Alpha, MultiEdge, TradingSuite, Premium, Fundamental, Classic, Warm, Cold, Strategy
• Candles & Labels: optional candle coloring and signal markers
👥 Ideal For
✅ Trend Followers — Ride strength as price compresses near the upper band.
✅ Swing/Mean-Reversion Traders — Fade extremes when BB% stretches into OB/OS zones.
✅ Multi-Timeframe Analysts — Compare band position consistently across periods.
✅ System Builders — Use BB% as a normalized feature for strategies and filters.
📌 Conclusion
BB% | QuantEdgeB delivers a clean, normalized read of price versus its volatility envelope—adaptable via rich MA/source options and easy to automate with thresholds and alerts.
🔹 Key Takeaways:
1️⃣ Normalized view of price inside the volatility bands
2️⃣ Flexible baseline (12+ MA choices) and Heikin-Ashi support
3️⃣ Straightforward 55/45 triggers with clear visual context
📌 Disclaimer: Past performance is not indicative of future results. No strategy guarantees success.
📌 Strategic Advice: Always backtest, tune parameters, and align with your risk profile before live trading.