AK TREND ID v1.00Hello,
"Are we at the top yet ? "........ " Is it a good time to invest ? " ......." Should I buy or sell ? " These are the many questions I hear and get on the daily basis. 1000's of investors do not know when to go in and out of the market. Most of them rely on the opinion of "experts" on television to make their investment decisions. Bad idea.Taking a systematic approach when investing, could save you a lot of time and headache. If there was only a way to know when to get in and out of the market !! hmmmm. The good news is that there many ways to do that. The bad news is , are you disciplined enough to follow it ?
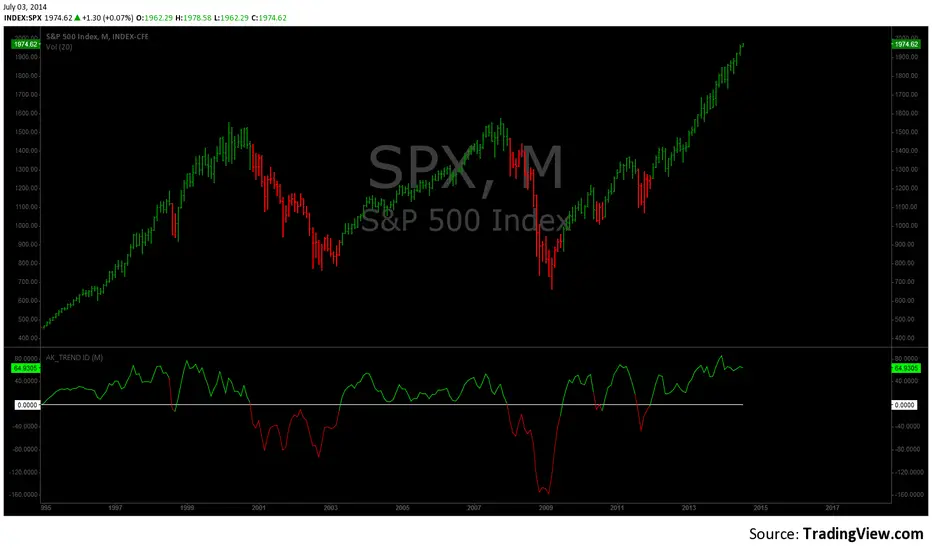
I coded the AK_TREND ID specifically to identified trends in the SPX or SPY only . How does it work ? very simply , I simply plot the spread between the 3 month and 8 month moving average on the chart.
If the spread > 0 @ month end = BUY
if the spread < 0 @ month end = SELL
The AK TREND ID is a LAGGING Indicator , so it will not get you in at the very bottom or get you out at the very top. I did a backtest on the SPX from 1984 to 7/2/2014 (yesterday), The rule was to buy only when the AK TREND ID was green. let's look at the result:
14 trades : 11 W 3 L , 78.75 % winning %
Biggest winner (%) = 108 %
Biggest loser (%) = -10.7 %
Average Return = 27 %
Total Return since 1984 = 351.3 %
You can see the result in detail here : docs.google.com
Although the backtesting results are good, the AK TREND ID is not to be used as a trading system. It is simply design to let you know when to invest and when to get out. I'm working a more accurate version of this Indicator , that will use both technical and fundamental data. In the mean time , I hope this will give some of you piece of mind, and eliminate emotions from your trading decision. Feel free to modify the code as you wish, but please share your finding with the rest of Trading View community.
All the best
Algo
Tìm kiếm tập lệnh với "涨幅大于1000的股票"
Confluence script This is modified version of Dale Legan's "Confluence" indicator written by Gary Fritz.
================================================================
Here is Gary`s commentary:
* I moved the core Confluence computations into a Confluence function.
Since the Confluence indicator returned several "states" (bull, bear, grey, and zero),
he modified the return value a bit:
-9 to -1 = Bearish
-0.9 to 0.9 = "grey" (and zero)
1 to 9 = Bullish
The "grey" range corresponds to the "grey" values plotted by Dale's indicator, but
they're divided by 10.
So -0.4 is equivalent to "grey -4" in Dale's indicator.
* I got rid of a bit of extra computation in the function. I didn't try to do a hard-core
Pierre-style optimization :-), but I noticed several significant chunks of calculation were
being done several times each bar, and I commented them out and replaced them with an intermediate
variable. It still calls sine/cosine a dozen times on each bar, which accounts for the bulk of the
processing time, but I think it's a bit easier to understand what the code is doing this way. (It also
seems to work better -- see below.) For the most part I didn't try to use mnemonic names for these
intermediate variables, because I don't understand exactly what the values represent!!
* I'm appending a simplified Confluence indicator using the function.
* I've also appended a simple Confluence system. This system sets an entry stop above/below the current
bar if Confluence goes into bull/bear mode, and similarly sets an exit stop below/above the bar where it
exits bull/bear mode. There's also an optional "aggressive" stop mode that tightens the stops if the market
moves in your direction; for example, if the high is 1000 and your "Trigger" offset is 2, the initial stop
is set at 1002. If the next bar has a high of 997, the stop is tightened to 997+2=999.
Interestingly, when I first wrote this system, I ran into a strange MaxBarsBack problem. The Confluence
indicator worked just fine with a MaxBarsBack setting of "Auto-Detect." But systems don't have a setting
like that -- you have to specify a fixed value. But NO fixed value (up to the maximum of 999) worked for
either the system OR the indicator! And I couldn't see anywhere that it was looking back that many bars.
Then, when I did the optimization on the Confluence code, the MaxBarsBack problem mysteriously disappeared.
Sometimes TradeStation is just spooky... Any ideas what happened?
I've appended a sample system report for the system on SPX, using the default parameters. The system actually
does pretty well. It probably won't make anyone rich, but I thought some folks might enjoy playing with it.
There are some other things you could do with it -- e.g. it might be interesting to change it to look for
long opportunities when Confluence hits -9, and short when it hits 9.
