Mara JPY Strength (USDJPY+EURJPY+GBPJPY)/3 + DXYJPY, USDJPY, EURJPY, GBPJPY, smart money, bias, index, forex indicator, DXY, strength meter, professional, trading tool, price action
Tìm kiếm tập lệnh với "纳斯达克指数期货cfd"

Mara JPY Bias ProMara JPY Bias Pro™ is a precision tool built for serious traders who focus on JPY and USD pairs.
This synthetic index combines USDJPY + EURJPY + GBPJPY, generating a smooth and dynamic representation of JPY strength or weakness. When the line turns green, JPY is weakening — time to look for LONG setups on XXX/JPY pairs. When red, JPY is strengthening — ideal moment for SHORT trades.
Built-in bias logic with adjustable MA-based trend detection or slope/momentum view lets you customize signals based on your strategy.
Plus, we’ve included a normalized DXY overlay, so you can track USD strength in parallel — perfect for traders working with EUR/USD, GBP/USD, USD/JPY and JPY crosses.
💡 Designed for day traders, scalpers, and smart money traders looking for clean confluence.
✅ Features:
Visual color-coded JPY bias (Green = Long / Red = Short)
Optional USD (DXY) strength overlay
Customizable MA length and bias logic
Built-in alerts for bias shifts & momentum flips
🔔 Alert-ready – never miss a reversal.
Trade smarter. Cut the noise. Stay on the right side of the move.


Step 3: Multi-Timeframe Trading SessionsFor editing purposes,
This is for editing purposes for developer to edit it before publishing.

ICT OTE Market MakerICT OTE Market Maker
Implementing ICT and automatically identifies OTE zones to minimize drawdowns.
XAUUSD & BTCUSD Buy/Sell Signals (80% Accuracy)this script gives approx 80% real and correct indicators depending on market

Buy/Sell Demand Pressure SMAThis indicator shows when competing buying and selling pressure has changed.
When bullish buying offsets bearish transaction volume, the indicator turns green. When bearish selling pressure offsets bullish buying volume the indicator is red.
Can be used as a normal SMA or to confirm buy/sell signals of other indicators.
Works best at the start of trades...and not exits but if set properly, it is a good indicator of when a trend has reversed.
~ jb tuttle

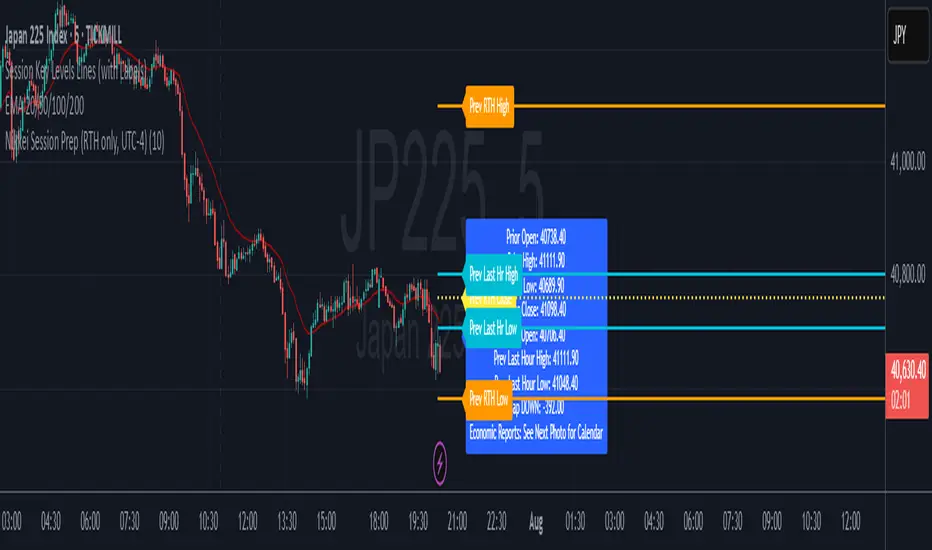
Nikkei Premarket High/Low LabelThis is Nikkei Premarket High/Low Label. shows you the premarket high and low. hope it helps :)
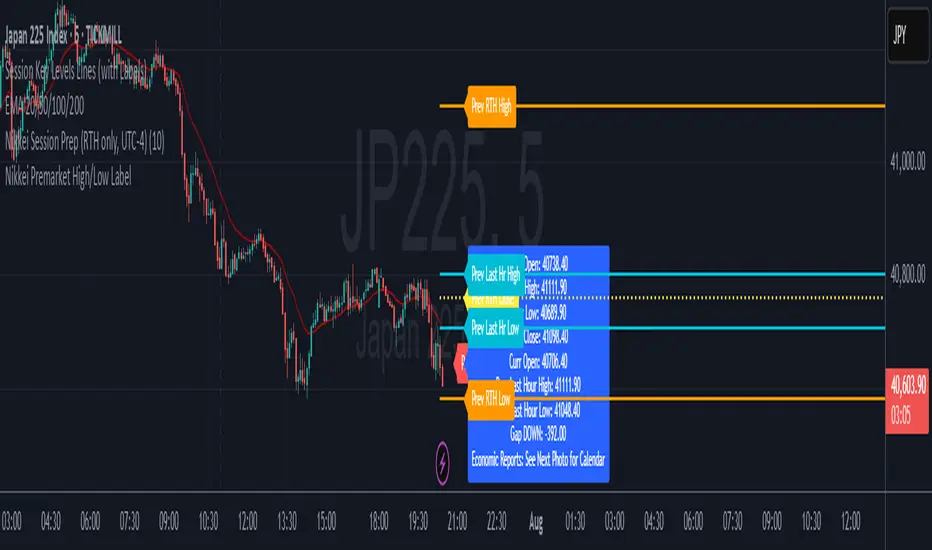
Nikkei Session Prep (RTH only, UTC-4)This is Nikkei Session Prep (RTH only, UTC-4). hope it helps :)
Donchian + Keltner Channel Strategy with Stops & Alerts BY GOUNIThis script combines Donchian Channels and Keltner Channels to identify potential buy and sell opportunities on the chart. It provides clear visual cues and includes volume labels and dynamic stop loss levels for better trading insights.

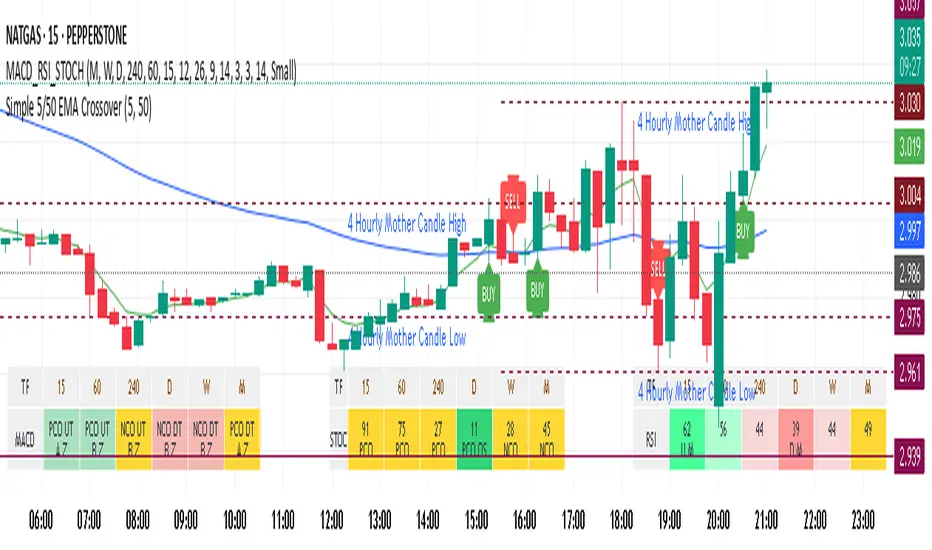
MTF Clean Panelsit is bigger model of a earlier model then i have made earlier it helps you see multiple timeframes together and includes more daily timeframe and have also been introduced a new 4 hours candle structure

Volume Peak BoxTH Description
Volume Peak Box
อินดิเคเตอร์นี้ใช้ตรวจจับช่วงที่มี Volume สูงผิดปกติ โดยใช้ Bollinger Band กับข้อมูล Volume ที่ดึงจาก Timeframe ที่ล็อกไว้ (เช่น 1 ชั่วโมง) และจะแสดงผลในรูปแบบ กล่องครอบช่วงราคาสูง–ต่ำ ของช่วง Volume Peak นั้น
🔧 วิธีทำงาน:
คำนวณ Bollinger Band จาก Volume ของ Timeframe ที่กำหนด
ถ้า Volume สูงกว่า Upper Band → ถือว่าเป็น Volume Peak
วาดกล่องครอบ High–Low ของแท่งที่อยู่ในช่วง Volume Peak
กล่องจะแสดงบนทุก Timeframe แต่ใช้ข้อมูลจาก Timeframe ที่ล็อกไว้เท่านั้น
🧠 เหมาะสำหรับการดู:
โซน Breakout
การเคลื่อนไหวของสถาบัน
ความไม่สมดุลของอุปสงค์/อุปทาน
เหมาะมากหากใช้ร่วมกับการอ่านพฤติกรรมราคาใน Timeframe ย่อย เพื่อดูปฏิกิริยาราคาต่อแรง Volume จาก Timeframe ใหญ่
________________
ENG Description
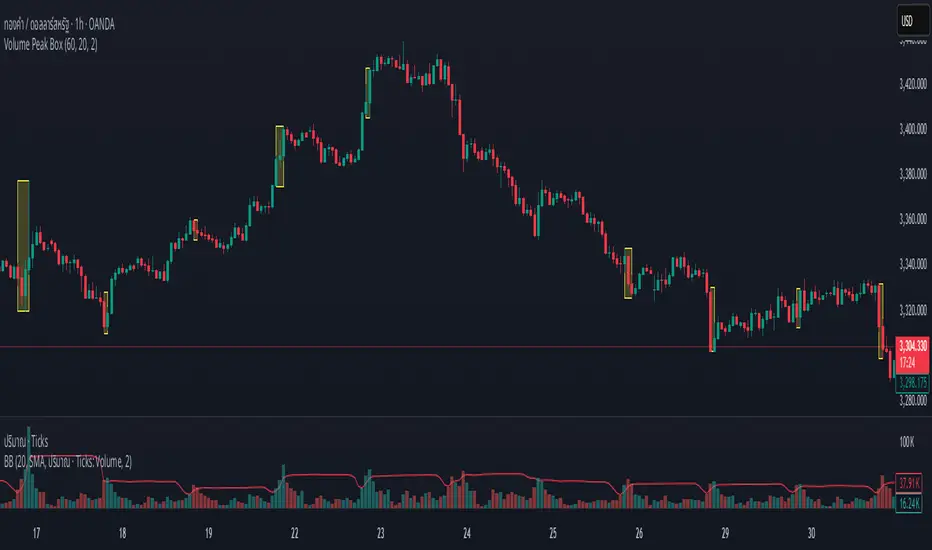
Volume Peak Box
This indicator detects volume spikes based on Bollinger Bands applied to volume from a locked timeframe (e.g. 1H), and draws a box around the price range during those peak periods.
🔧 How it works:
Calculates Bollinger Bands on volume from the selected timeframe.
If volume exceeds the upper band, it is marked as a volume peak.
When a volume peak starts and ends, the indicator draws a box covering the high–low price range during that period.
These boxes remain visible on all timeframes, but always reflect data from the locked timeframe.
🧠 Great for identifying:
Breakout zones
Institutional activity
Supply/demand imbalances
Tip: Use with lower timeframe price action to see how the market reacts near volume peaks from higher timeframes.
EMA 20/50/200 - M3EDGE Clean Mode™The M3EDGE Clean Mode™ indicator is designed to spot the cleanest, most aligned market phases.
It filters out market noise and highlights only the high-probability trending zones where the odds are in your favor.
How it works:
• Tracks 3 key EMAs (20, 50, 200)
• Confirms directional alignment across short, medium, and long-term trends
• Colors optimal market phases to identify high-probability setups
• Optional display of the dynamic EMA50/EMA200 zone to visualize the trend’s core
Purpose:
🎯 Avoid choppy, sideways market conditions
🎯 Focus only on smooth, directional price moves
🎯 Reduce false signals and improve chart clarity
Best use cases:
• Ideal for scalping, day trading, and swing trading
• Works on all markets: indices, commodities, forex, crypto
• Perfect when combined with macro analysis and other M3EDGE™ setups
💡 Pro tip: The M3EDGE Clean Mode™ isn’t just another indicator — it’s a quality filter that keeps you out of messy conditions. When it lights up, you know the road ahead is clear.

High Probability Buy/Sell with SL & TP High-accuracy Buy/Sell signals with dynamic SL & Target—perfect for scalpers and swing traders,Smart trading signals with built-in risk management. Never miss a move.Auto Buy/Sell entries with real-time SL & TP levels—trade with confidence.Turn signals into strategy. Precision entries, clear exits.Your all-in-one trading assistant: entry, stop loss, and take profit—automated.Built for serious traders: Clean signals, sharp exits, and solid risk-reward.

GTrader-ICT All In One-Comumnity VersionMeet the **GTrader-ICT All In One **, a comprehensive toolkit designed to integrate key Inner Circle Trader (ICT) concepts directly onto your chart. This powerful overlay indicator consolidates multiple essential tools, streamlining your technical analysis and helping you identify key temporal and price-based events.
📚 References & Inspiration
This indicator stands on the shoulders of giants. With the help of **tradeforopp** and **LuxAlgo**. The concepts and some implementation details were referenced from the following excellent, publicly available scripts:
ICT Killzones: The session drawing and pivot logic is adapted from tradeforopp
ICT Macros: The macro detection and plotting functionality is inspired by the work of Lux Algo , particularly their widely-used indicators covering ICT concepts.
🎯 Core Features
* **ICT Killzones:** Visualize critical trading sessions with customizable boxes. You can easily toggle and style the **Asia**, **London**, and **New York (AM, Lunch, PM)** sessions to focus on the liquidity and volatility that matter most to your strategy.
* Fully customizable session times and colors.
* Timezone support to align sessions with your local or preferred trading time (defaults to `America/New_York`).
* **ICT Macros:** Automatically identify and plot specific, short-duration time windows where institutional algorithms are known to be active (e.g., `09:50-10:10`, `14:50-15:10`, etc.).
* Plots the high/low range of the macro, providing clear levels of interest.
* Utilizes 1-minute data for precision, even when viewing on 3-minute or 5-minute charts.
📚 Optimization over the other original indicators
We add the custom input for macros session, users just need to input the from/to hour: minute format, and they will be converted into session objects in pinescript
The macro draws function is optimized, removing redundant draws, leading to better performance
Add "Distance from Macro Line to Chart" option
Add "Session Drawings Limit" for better performance
⚠️ Notes on TradingView Warnings
You may encounter some warnings from TradingView when using this script. These are generally expected due to the script's advanced, event-driven nature:
1. **Function Call Consistency:** The function 'box.new' should be called on each calculation for consistency, which may appear. This happens because drawing elements (like session boxes) are intentionally created only on the *first bar* of a new session, not on every single bar. This is a necessary design choice for performance and to prevent duplicate drawings.
2. **Potential for Repainting/Slow Load:** The **Macro** feature uses the `request.security_lower_tf()` function to get accurate 1-minute data. This can trigger warnings about performance or slow loading times. This is a known trade-off for achieving the precision required for the feature.

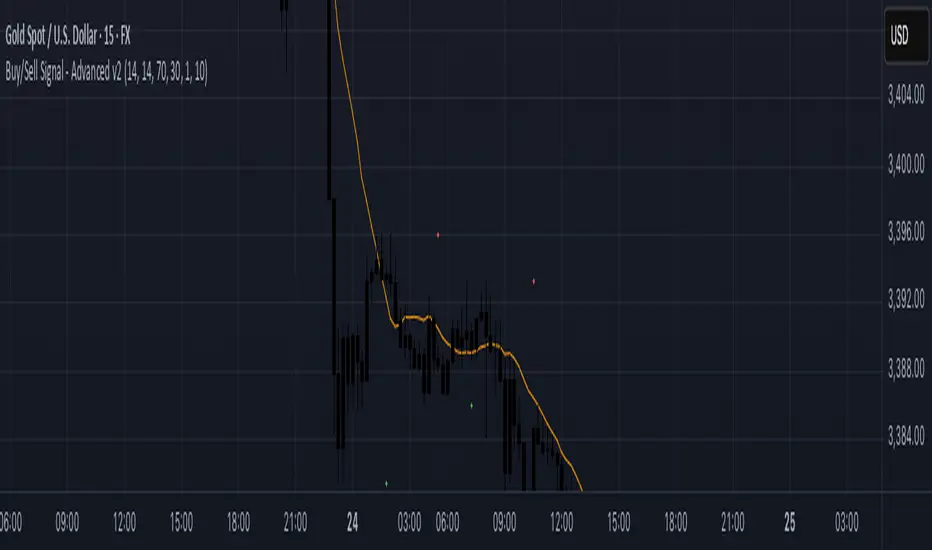
Buy/Sell Signal - Advanced v2The Buy/Sell Signal – Advanced v2 indicator is a powerful tool designed for traders who seek more reliable and filtered entries. This indicator combines classic technical analysis with modern enhancements to reduce noise and false signals. It generates Buy signals when a bullish candle closes above the 14-period Simple Moving Average (SMA), the RSI is below the oversold threshold (default: 30), and trading volume is higher than the 20-period average—indicating strong momentum and potential reversal from a discounted price zone. Conversely, a Sell signal appears when a bearish candle closes below the SMA, RSI is above the overbought level (default: 70), and volume exceeds its average—signaling potential weakness after a price rally.
In addition to entry signals, the indicator automatically plots dynamic support and resistance levels using pivot highs and lows. These levels help traders identify key zones for confirmation, breakout, or rejection. The SMA provides trend direction context, while the volume and RSI filters act as safeguards to avoid trading in low-quality conditions.
Ideal for scalpers and intraday traders on 5-minute to 1-hour timeframes, this indicator helps capture trend continuations and early reversals with confidence. For best results, use the signals in conjunction with multi-timeframe analysis and price action confirmation. This tool is especially effective on assets like XAUUSD, forex pairs, and indices.
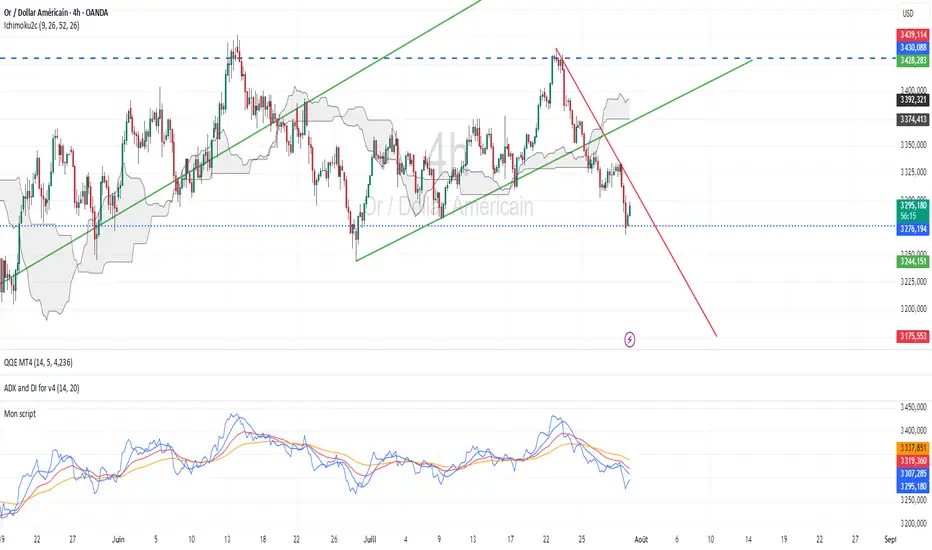
MultiMa FxGMulti Moving Average v1
SMA 8 + EMA 21 + EMA 50
Cet indicateur permet de condenser 3 indicateurs en 1 seul.
C'est un test permettant de voir comment cela se comporte dans la réalité de TradingView
================================================================================
Multi Moving Average v1
This indicator is designed for draw 3 moving average with this custom indicator.
This is my first try on TradingView Pine Script.
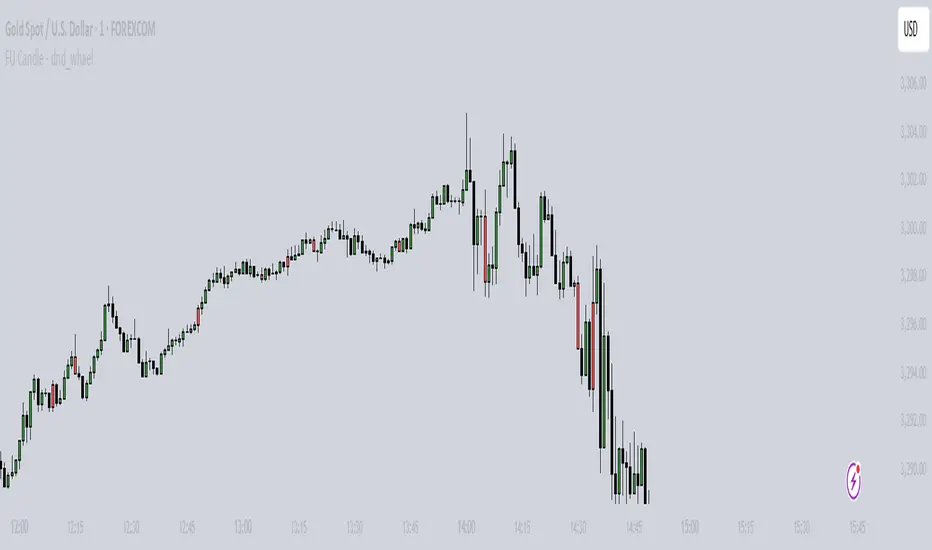
FU Candle - dnd_whael What the FU Candle Indicator does:
First we need to understand what FU candles are. There's bullish and bearish FU candles.
Bullish FU candles are candles that have a long wick that takes out the previous candles low, then turns around and closes above the high of the previous candle.
TPC Strategy XAUUSD - M5 with Fixed SL/TPThis script implements a trend-following strategy for XAUUSD on the 5-minute chart, using 200 EMA and 21 EMA to filter direction. Entries are triggered based on RSI, MACD crossovers, and price action alignment. It includes fixed Stop Loss (15 pips) and Take Profit (22.5 pips) with visual SL/TP lines, BUY/SELL labels, and alert conditions for automated notifications. Designed for intraday scalping and low-risk entries during trending conditions.
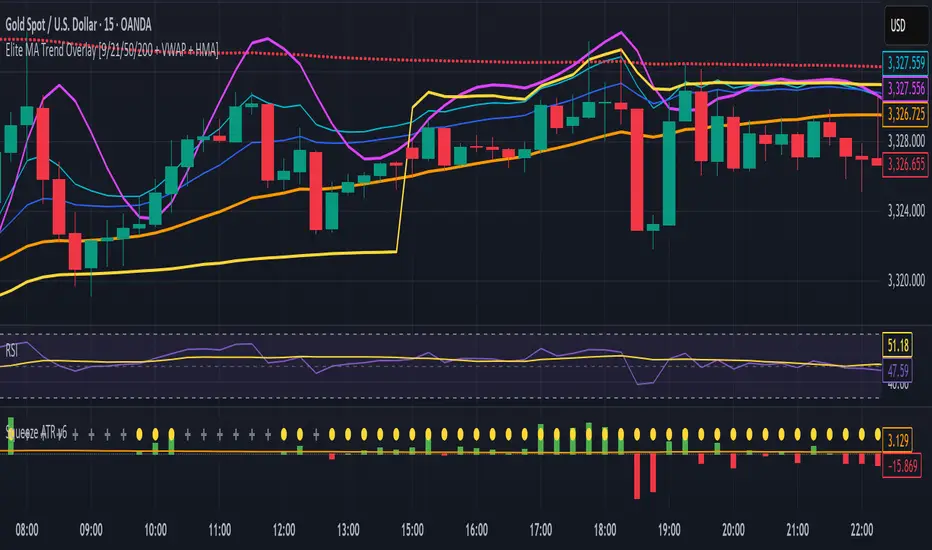
Elite MA Trend Overlay [9/21/50/200 + VWAP + HMA]🔍 What It Is:
The Elite MA Trend Overlay is a professional-grade moving average system built for day traders, scalpers, and swing traders who need clear, visual trend confirmation and precise entry zones across all timeframes.
This overlay combines 5 industry-proven tools into one compact indicator for sniper-level decision making:
EMA 9 – Entry momentum
EMA 21 – Microstructure guide
EMA 50 – Trend bias filter
EMA 200 – Institutional macro direction
VWAP – Intraday fair value (used by pros)
Hull MA (HMA) – Early shift detector
It also features auto-detected trend zones using color-coded background shading to help you instantly know if the market is in a bullish or bearish regime.
🧠 How It Works:
The script dynamically plots the short-term to long-term moving averages to reflect real-time market structure. When all EMAs are aligned in one direction, a colored background highlights the dominant trend:
✅ Green background = Bullish trend (9 > 21 > 50 > 200)
🔻 Red background = Bearish trend (9 < 21 < 50 < 200)
The VWAP line acts as a magnet and decision zone—traders use it for intraday entries or exits. The Hull Moving Average adapts quickly to price shifts, making it perfect for spotting early reversals before the EMAs cross.
🎯 Why It Helps Traders Succeed:
This indicator:
Removes guesswork: Know instantly if you’re in a strong trend or chop zone.
Filters bad trades: Avoid entering against structure or into volatility traps.
Improves timing: Use pullbacks to EMAs or Hull MA flips for sniper entries.
Works across timeframes: From scalping 1-minute to swing trading daily charts.
Whether you're trading gold, forex, stocks, or crypto — this overlay gives you clean, professional structure that keeps you disciplined and sharp.
⚙️ Features:
On/off toggles for VWAP & Hull MA
Minimalist, clutter-free plotting
Auto background color zones
Supports Pine Script v6 (latest version)
👑 Recommended Use:
Confirm trend with background + EMA alignment
Enter on pullbacks to EMA 21 or 50
Use Hull MA or RSI for early reversal detection
Exit at VWAP reversion or trend exhaustion
💬 “Structure is everything. Trade with the flow, not against it.”