AutoPivot Levels with Alerts [ChartWhizzperer] – Dynamic EditionAuto-Pivot Levels 4 methods with alerts – Dynamic Edition
Now with
- Live Mode
- 4 Pivot Methods
- 7 Session Types (5m, 15m, 30m, Hourly, Daily, Weekly, Monthly)
- PineConnector-Ready Alerts!
Free, Open Source, Pine Script v6-compliant.
NEW: Live Mode (Ultra-Dynamic, Repainting) – Switchable in UI!
Instantly switch between Classic (session-based, repaint-free) and Live (rolling window, real-time, repainting) using the simple checkbox in the settings!
Live Mode recalculates all pivots on every tick/bar, using the current high/low/close for the chosen session (5m, 15m, 30m, hourly, daily, weekly, monthly).
Perfect for:
- Scalping and high-frequency trading
- Real-time bot/automation setups (PineConnector-ready)
- Fast-moving or breakout markets
Classic Mode: For traditional, stable levels based on confirmed session data – ideal for backtesting and trading history.
Four Calculation Methods (Choose What Fits YOU)
1. Classic
Standard pivot calculation.
Based on previous session’s High, Low, Close.
Simple, proven, and suitable for any asset.
2. Fibonacci
Projects levels using Fibonacci ratios of the prior session’s range.
Great for traders who want to align pivots with fib retracements and extensions.
3. Camarilla
Uses unique multipliers for support/resistance, focusing on mean reversion and volatility.
Popular among futures and forex day traders.
4. Woodie
Puts extra weight on previous Close for more responsive pivots.
Often used in trending or choppy conditions.
Switch methods anytime in the UI – the script recalculates instantly and keeps your chart clean!
Level-Specific Alerts – PineConnector Ready!
Dedicated alert for EVERY level and direction (Up/Down):
Pivot (P), R1, R2, R3, S1, S2, S3
No configuration hassle:
All alerts are pre-defined in the TradingView Alert Panel and work across all session types (5m → monthly).
Machine-readable message format:
PIVOT=R1 DIR=UP SYMBOL={{ticker}} PRICE={{close}}
Direct plug-and-play with PineConnector, webhooks, Discord, Telegram, bots, and other automation tools.
Never miss a breakout, reversal, or key support/resistance touch!
Powerful Customization & Performance
- Session selection: 5m, 15m, 30m, Hourly, Daily, Weekly, Monthly (choose what suits your trading style).
- Show/hide any level (Pivot, R1–R3, S1–S3) for minimal chart clutter.
- Color selection for each level to match your theme or highlight key pivots.
- Auto-cleanup: Old lines and labels are cleared on every recalculation or session change for maximum performance and visual clarity.
- Zero runtime errors: Strict Pine Script v6 practices for stability.
How To Use – Quick Start
1) Add the indicator to your TradingView chart.
2) Pick your calculation method (Classic, Fibonacci, Camarilla, Woodie).
3) Set session type (5m, 15m, 30m, Hourly, Daily, Weekly, Monthly).
4) Switch between Classic and Live Mode with a single click in settings.
5) Customize your levels (on/off, colors).
6) Open the Alert Panel, select any pre-configured alert (e.g. "R2 Cross Down"), and go live!
7) Connect with PineConnector or any webhook system instantly using the pre-formatted alert messages.
Who Is It For?
- Active scalpers & bot traders: Live Mode + PineConnector-ready alerts = instant, automated reactions.
- Swing and position traders: Use Classic Mode for stable, repaint-free levels.
- Strategy developers: Seamless integration into automated and manual trading workflows.
License & Community
Open Source, Non-Commercial:
Free for personal & educational use under CC BY-NC-SA 4.0.
Feedback, bug reports & ideas:
Drop a comment, or contact me for feature requests.
Trade smart. Trade dynamic. Unlock the true power of pivots – with ChartWhizzperer!
Tìm kiếm tập lệnh với "纳斯达克期货cfd"

PARTH Gold Profit IndicatorWhat's Inside:
✅ What is gold trading (XAU/USD explained)
✅ Why trade gold (5 major reasons)
✅ How to make money (buy/sell mechanics)
✅ Complete trading setup using your indicator
✅ Entry rules (when to buy/sell with examples)
✅ Risk management (THE MOST IMPORTANT)
✅ Best trading times (London-NY overlap)
✅ 3 trading styles (scalping, swing, position)
✅ 6 common mistakes to avoid
✅ Realistic profit expectations
✅ Pre-trade checklist
✅ Step-by-step getting started guide
✅ Everything a beginner need

Gold 15m: Trend + S/R + Liquidity Sweep (RR 1:2)This strategy is designed for short-term trading on XAUUSD (Gold) using the 15-minute timeframe. It combines trend direction, support/resistance pivots, liquidity sweep detection, and momentum confirmation to identify high-probability reversal setups in line with the dominant market trend.
⚙️ Core Logic:
Trend Filter (EMA 200):
The strategy only takes long positions when price is above the 200 EMA and short positions when price is below it.
Support/Resistance via Pivots:
Dynamic swing highs and lows are identified using pivot points. These act as local supply and demand levels where liquidity is likely to accumulate.
Liquidity Sweep Detection:
A bullish liquidity sweep occurs when price briefly breaks below the last pivot low (grabbing liquidity) and then closes back above it.
A bearish sweep occurs when price breaks above the last pivot high and then closes back below.
Momentum & Candle Strength:
The strategy filters signals based on candle range and body size to ensure entries occur during strong price reactions, not weak retracements.
Risk Management (1:2 RR):
Stop-loss is placed slightly beyond the last pivot level using ATR-based buffers, and take-profit is set at 2× the risk distance, maintaining a reward-to-risk ratio of 1:2.
💼 Trade Logic Summary:
Long Entry:
After a bullish liquidity sweep & reclaim, momentum confirmation, and trend alignment (above EMA 200).
Short Entry:
After a bearish sweep & reclaim, momentum confirmation, and trend alignment (below EMA 200).
Exit:
Automated via ATR-based Stop Loss and Take Profit targets.
📊 Customization Options:
Adjustable EMA length, pivot settings, ATR multipliers, and RR ratio.
Option to enable/disable trend filter.
Toggle display of S/R zones on chart.
🧠 Best Use:
Works best during London and New York sessions when Gold shows strong momentum.
Can be adapted for forex pairs and indices by tuning ATR and pivot parameters.

Session Highs and LowsShows the current and previous session highs and lows for the New York, London and Asian sessions

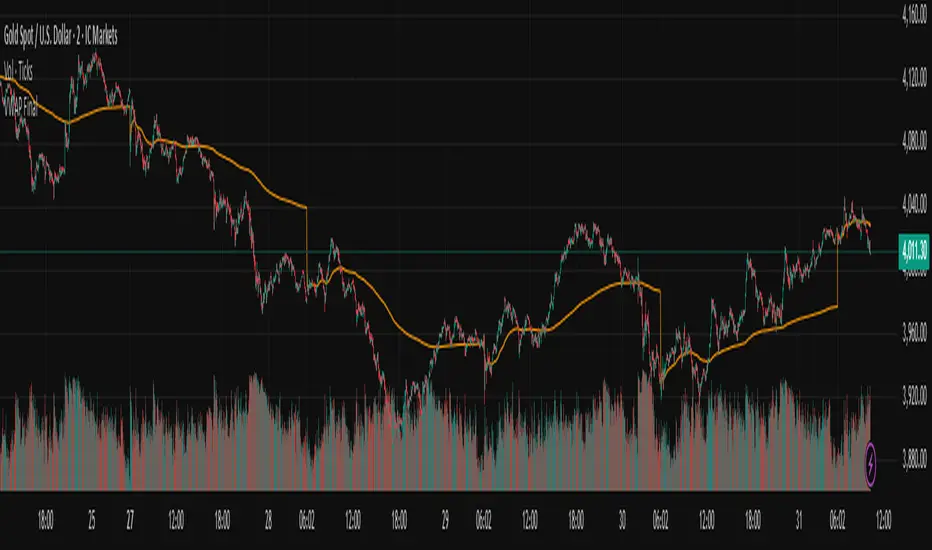
Vwap Daily By SamsungTitle
Daily VWAP with Historical Lookback (Logic Fix)
Description
This script calculates and plots the daily Volume-Weighted Average Price (VWAP), an essential tool for intraday traders.
What makes this indicator special is its robust plotting logic. Unlike many simple VWAP scripts that struggle to show data for previous days, this version includes a crucial fix that allows you to reliably display historical VWAP lines for as many days back as you need. This allows for more comprehensive backtesting and analysis of how price has interacted with the VWAP on previous trading days.
This is an indispensable tool for traders who use VWAP as a dynamic level of support/resistance, a benchmark for trade execution quality, or a gauge of the day's trend.
Key Features
Historical VWAP Display: Easily plot VWAP for multiple past days on your chart. Simply set the number of lookback days in the settings.
Accurate Daily Calculation: The VWAP calculation correctly resets at the beginning of each new trading session (00:00 server time).
Fully Customizable: You have full control over the appearance of the VWAP line, including its color, width, and style (Solid or Stepped).
Robust Plotting Engine: This script solves the common Pine Script issue where conditionally plotted historical lines fail to render. It works reliably on all intraday timeframes.
Built-in Debug Mode: For advanced users or those curious about the inner workings, a comprehensive debug mode can be enabled to display raw VWAP values, cumulative volume, and timeframe warnings.
How to Use
Add the "Daily VWAP with Historical Lookback" indicator to your chart.
IMPORTANT: Make sure you are on an intraday timeframe (e.g., 1H, 30M, 15M, 5M, 1M). This indicator is designed for intraday analysis and will display a warning if used on a daily or higher timeframe.
Open the indicator's settings.
In the "VWAP Settings" tab, adjust the "Lookback Days to Display" to set how many previous days of VWAP you want to see. (e.g., 0 for today only, 1 for today and yesterday, 10 for the last 10 days).
Customize the line's appearance in the "Line Style" tab.
The "Logic Fix" Explained (For Developers)
A common challenge in Pine Script is conditionally plotting data for historical bars. Many scripts attempt this by dynamically changing the plot color to na (transparent) for bars that shouldn't be displayed. This method is often unreliable and can result in the entire plot failing to render.
This script employs a more robust and standard approach: manipulating the data series itself.
The Problem: plot(vwap, color = shouldPlot ? color.red : na) can be buggy.
The Solution: plot(shouldPlot ? vwap : na, color = color.red) is reliable.
Instead of changing the color, we create a new data series (plotVwap). This series contains the vwapValue only on the bars that meet our date criteria. On all other bars, its value is na (Not a Number). The plot() function is designed to handle na values by simply "lifting the pen," creating a clean break in the line. This ensures that the VWAP is drawn only for the selected days, with 100% reliability across all historical data.
Settings Explained
Lookback Days to Display: Sets the number of past days (from the last visible bar) for which to display the VWAP.
Line Color, Width, and Style: Standard cosmetic settings for the VWAP line.
Enable Debug Mode (Master Switch): Toggles all debugging features on or off. It is enabled by default to help new users.
Display Debug: Cumulative Volume: When enabled, it shows the daily cumulative volume in a gray area on a separate pane.
Display Debug: Raw VWAP Value: When enabled, it plots the raw, unfiltered VWAP calculation for all days on the chart, helping to verify the core logic.
This script is provided for educational and informational purposes. Trading involves significant risk. Always conduct your own research and analysis before making any trading decisions.
If you find this script useful, a 'Like' is always appreciated! Happy trading

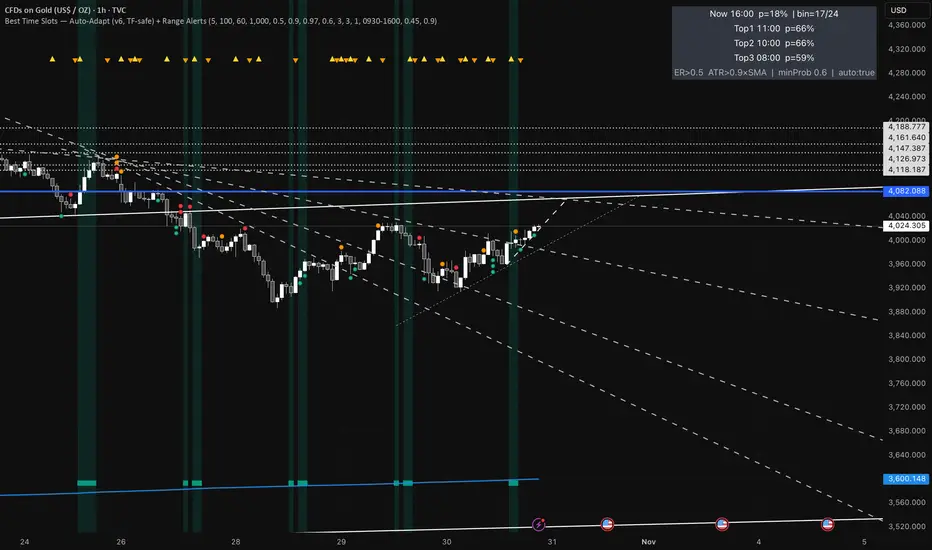
Best Time Slots — Auto-Adapt (v6, TF-safe) + Range AlertsTime & binning
Auto-adapt to timeframe
Makes all time windows scale to your chart’s bar size (so it “just works” on 1m, 15m, 4H, Daily).
• On = recommended. • Off = fixed default lengths.
Minimum Bin (minutes)
The size of each daily time slot we track (e.g., 5-min bins). The script uses the larger of this and your bar size.
• Higher = fewer, broader slots; smoother stats. • Lower = more, narrower slots; needs more history.
• Try: 5–15 on intraday, 60–240 on higher TFs.
Lookback windows (used when Auto-adapt = ON)
Target ER Window (minutes)
How far back we look to judge Efficiency Ratio (how “straight” the move was).
• Higher = stricter/smoother; fewer bars qualify as “movement”. • Lower = more sensitive.
• Try: 60–120 min intraday; 240–600 min for higher TFs.
Target ATR Window (minutes)
How far back we compute ATR (typical range).
• Higher = steadier ATR baseline. • Lower = reacts faster.
• Try: 30–120 min intraday; 240–600 min higher TFs.
Target Normalization Window (minutes)
How far back for the average ATR (the baseline we compare to).
• Higher = stricter “above average range” check. • Lower = easier to pass.
• Try: ~500–1500 min.
What counts as “movement”
ER Threshold (0–1)
Minimum efficiency a bar must have to count as movement.
• Higher = only very “clean, one-direction” bars count. • Lower = more bars count.
• Try: 0.55–0.65. (0.60 = balanced.)
ATR Floor vs SMA(ATR)
Requires range to be at least this many × average ATR.
• Higher (e.g., 1.2) = demand bigger-than-usual ranges. • Lower (e.g., 0.9) = allow smaller ranges.
• Try: 1.0 (above average).
How history is averaged
Recent Days Weight (per-day decay)
Gives more weight to recent days. Example: 0.97 ≈ each day old counts ~3% less.
• Higher (0.99) = slower fade (older days matter more). • Lower (0.95) = faster fade.
• Try: 0.97–0.99.
Laplace Prior Seen / Laplace Prior Hit
“Starter counts” so early stats aren’t crazy when you have little data.
• Higher priors = probabilities start closer to average; need more real data to move.
• Try: Seen=3, Hit=1 (defaults).
Min Samples (effective)
Don’t highlight a slot unless it has at least this many effective samples (after decay + priors).
• Higher = safer, but fewer highlights early.
• Try: 3–10.
When to highlight on the chart
Min Probability to Highlight
We shade/mark bars only if their slot’s historical movement probability is ≥ this.
• Higher = pickier, fewer highlights. • Lower = more highlights.
• Try: 0.45–0.60.
Show Markers on Good Bins
Draws a small square on bars that fall in a “good” slot (in addition to the soft background).
Limit to market hours (optional)
Restrict to Session + Session
Only learn/score inside this time window (e.g., “0930-1600”). Uses the chart/exchange timezone.
• Turn on if you only care about RTH.
Range (chop) alerts
Range START if ER ≤
Triggers range when efficiency drops below this level (price starts zig-zagging).
• Higher = easier to call “range”. • Lower = stricter.
Range START if ATR ≤ this × SMA(ATR)
Also triggers range when ATR shrinks below this fraction of its average (volatility contraction).
• Higher (e.g., 1.0) = stricter (must be at/under average). • Lower (e.g., 0.9) = easier to call range.
Alerts on bar close
If ON, alerts fire once per bar close (cleaner). If OFF, they can trigger intrabar (faster, noisier).
Quick “what happens if I change X?”
Want more highlighted times? ↓ Min Probability, ↓ ER Threshold, or ↓ ATR Floor (e.g., 0.9).
Want stricter highlights? ↑ Min Probability, ↑ ER Threshold, or ↑ ATR Floor (e.g., 1.2).
Want recent days to matter more? ↑ Recent Days Weight toward 0.99.
On 4H/Daily, widen Minimum Bin (e.g., 60–240) and maybe lower Min Probability a bit.

Opening Range Breakout with Multi-Timeframe Liquidity]═══════════════════════════════════════
OPENING RANGE BREAKOUT WITH MULTI-TIMEFRAME LIQUIDITY
═══════════════════════════════════════
A professional Opening Range Breakout (ORB) indicator enhanced with multi-timeframe liquidity detection, trading session visualization, volume analysis, and trend confirmation tools. Designed for intraday trading with comprehensive alert system.
───────────────────────────────────────
WHAT THIS INDICATOR DOES
───────────────────────────────────────
This indicator combines multiple trading concepts:
- Opening Range Breakout (ORB) - Customizable time period detection with automatic high/low identification
- Multi-Timeframe Liquidity - HTF (Higher Timeframe) and LTF (Lower Timeframe) key level detection
- Trading Sessions - Tokyo, London, New York, and Sydney session visualization
- Volume Analysis - Volume spike detection and strength measurement
- Multi-Timeframe Confirmation - Trend bias from higher timeframes
- EMA Integration - Trend filter and dynamic support/resistance
- Smart Alerts - Quality-filtered breakout notifications
───────────────────────────────────────
HOW IT WORKS
───────────────────────────────────────
OPENING RANGE BREAKOUT (ORB):
Concept:
The Opening Range is a period at the start of a trading session where price establishes an initial high and low. Breakouts beyond this range often indicate the direction of the day's trend.
Detection Method:
- Default: 15-minute opening range (configurable)
- Custom Range: Set specific session times with timezone support
- Automatically identifies ORH (Opening Range High) and ORL (Opening Range Low)
- Tracks ORB mid-point for reference
Range Establishment:
1. Session starts (or custom time begins)
2. Tracks highest high and lowest low during the period
3. Range confirmed at end of opening period
4. Levels extend throughout the session
Breakout Detection:
- Bullish Breakout: Close above ORH
- Bearish Breakout: Close below ORL
- Mid-point acts as bias indicator
Visual Display:
- Shaded box during range formation
- Horizontal lines for ORH, ORL, and mid-point
- Labels showing level values
- Color-coded fills based on selected method
Fill Color Methods:
1. Session Comparison:
- Green: Current OR mid > Previous OR mid
- Red: Current OR mid < Previous OR mid
- Gray: Equal or first session
- Shows day-over-day momentum
2. Breakout Direction (Recommended):
- Green: Price currently above ORH (bullish breakout)
- Red: Price currently below ORL (bearish breakout)
- Gray: Price inside range (no breakout)
- Real-time breakout status
MULTI-TIMEFRAME LIQUIDITY:
Two-Tier System for comprehensive level identification:
HTF (Higher Timeframe) Key Liquidity:
- Default: 4H timeframe (configurable to Daily, Weekly)
- Identifies major institutional levels
- Uses pivot detection with adjustable parameters
- Suitable for swing highs/lows where large orders rest
LTF (Lower Timeframe) Key Liquidity:
- Default: 1H timeframe (configurable)
- Provides precision entry/exit levels
- Finer granularity for intraday trading
- Captures minor swing points
Calculation Method:
- Pivot high/low detection algorithm
- Configurable left bars (lookback) and right bars (confirmation)
- Timeframe multiplier for accurate multi-timeframe detection
- Automatic level extension
Mitigation System:
- Tracks when levels are swept (broken)
- Configurable mitigation type: Wick or Close-based
- Option to remove or show mitigated levels
- Display limit prevents chart clutter
Asset-Specific Optimization:
The indicator includes quick reference settings for different assets:
- Major Forex (EUR/USD, GBP/USD): Default settings optimal
- Crypto (BTC/ETH): Left=12, Right=4, Display=7
- Gold: HTF=1D, Left=20
TRADING SESSIONS:
Four Major Sessions with Full Customization:
Tokyo Session:
- Default: 04:00-13:00 UTC+4
- Asian trading hours
- Often sets daily range
London Session:
- Default: 11:00-20:00 UTC+4
- Highest liquidity period
- Major institutional activity
New York Session:
- Default: 16:00-01:00 UTC+4
- US market hours
- High-impact news events
Sydney Session:
- Default: 01:00-10:00 UTC+4
- Earliest Asian activity
- Lower volatility
Session Features:
- Shaded background boxes
- Session name labels
- Optional open/close lines
- Session high/low tracking with colored lines
- Each session has independent color settings
- Fully customizable times and timezones
VOLUME ANALYSIS:
Volume-Based Trade Confirmation:
Volume MA:
- Configurable period (default: 20)
- Establishes average volume baseline
- Used for spike detection
Volume Spike Detection:
- Identifies when volume exceeds MA * multiplier
- Default: 1.5x average volume
- Confirms breakout strength
Volume Strength Measurement:
- Calculates current volume as percentage of average
- Shows relative volume intensity
- Used in alert quality filtering
High Volume Bars:
- Identifies bars above 50th percentile
- Additional confirmation layer
- Indicates institutional participation
MULTI-TIMEFRAME CONFIRMATION:
Trend Bias from Higher Timeframes:
HTF 1 (Trend):
- Default: 1H timeframe
- Uses EMA to determine intermediate trend
- Compares current timeframe EMA to HTF EMA
HTF 2 (Bias):
- Default: 4H timeframe
- Uses 50 EMA for longer-term bias
- Confirms overall market direction
Bias Classifications:
- Bullish Bias: HTF close > HTF 50 EMA AND Current EMA > HTF1 EMA
- Bearish Bias: HTF close < HTF 50 EMA AND Current EMA < HTF1 EMA
- Neutral Bias: Mixed signals between timeframes
EMA Stack Analysis:
- Compares EMA alignment across timeframes
- +1: Bullish stack (lower TF EMA > higher TF EMA)
- -1: Bearish stack (lower TF EMA < higher TF EMA)
- 0: Neutral/crossed
Usage:
- Filters false breakouts
- Confirms trend direction
- Improves trade quality
EMA INTEGRATION:
Dynamic EMA for Trend Reference:
Features:
- Configurable period (default: 20)
- Customizable color and width
- Acts as dynamic support/resistance
- Trend filter for ORB trades
Application:
- Above EMA: Favor long breakouts
- Below EMA: Favor short breakouts
- EMA cross: Potential trend change
- Distance from EMA: Momentum gauge
SMART ALERT SYSTEM:
Quality-Filtered Breakout Notifications:
Alert Types:
1. Standard ORB Breakout
2. High Quality ORB Breakout
Quality Criteria:
- Volume Confirmation: Volume > 1.2x average
- MTF Confirmation: Bias aligned with breakout direction
Standard Alert:
- Basic breakout detection
- Price crosses ORH or ORL
- Icon: 🚀 (bullish) or 🔻 (bearish)
High Quality Alert:
- Both volume AND MTF confirmed
- Stronger probability setup
- Icon: 🚀⭐ (bullish) or 🔻⭐ (bearish)
Alert Information Includes:
- Alert quality rating
- Breakout level and current price
- Volume strength percentage (if enabled)
- MTF bias status (if enabled)
- Recommended action
One Alert Per Bar:
- Prevents alert spam
- Uses flag system to track sent alerts
- Resets on new ORB session
───────────────────────────────────────
HOW TO USE
───────────────────────────────────────
OPENING RANGE SETUP:
Basic Configuration:
1. Select time period for opening range (default: 15 minutes)
2. Choose fill color method (Breakout Direction recommended)
3. Enable historical data display if needed
Custom Range (Advanced):
1. Enable Custom Range toggle
2. Set specific session time (e.g., 0930-0945)
3. Select appropriate timezone
4. Useful for specific market opens (NYSE, LSE, etc.)
LIQUIDITY LEVELS SETUP:
Quick Configuration by Asset:
- Forex: Use default settings (Left=15, Right=5)
- Crypto: Set Left=12, Right=4, Display=7
- Gold: Set HTF=1D, Left=20
HTF Liquidity:
- Purpose: Major support/resistance levels
- Recommended: 4H for day trading, 1D for swing trading
- Use as profit targets or reversal zones
LTF Liquidity:
- Purpose: Entry/exit refinement
- Recommended: 1H for day trading, 4H for swing trading
- Use for position management
Mitigation Settings:
- Wick-based: More sensitive (default)
- Close-based: More conservative
- Remove or Show mitigated levels based on preference
TRADING SESSIONS SETUP:
Enable/Disable Sessions:
- Master toggle for all sessions
- Individual session controls
- Show/hide session names
Session High/Low Lines:
- Enable to see session extremes
- Each session has custom colors
- Useful for range trading
Customization:
- Adjust session times for your broker
- Set timezone to match your location
- Customize colors for visibility
VOLUME ANALYSIS SETUP:
Enable Volume Analysis:
1. Toggle on Volume Analysis
2. Set MA length (20 recommended)
3. Adjust spike multiplier (1.5 typical)
Usage:
- Confirm breakouts with volume
- Identify climactic moves
- Filter false signals
MULTI-TIMEFRAME SETUP:
HTF Selection:
- HTF 1 (Trend): 1H for day trading, 4H for swing
- HTF 2 (Bias): 4H for day trading, 1D for swing
Interpretation:
- Trade only with bias alignment
- Neutral bias: Be cautious
- Bias changes: Potential reversals
EMA SETUP:
Configuration:
- Period: 20 for responsive, 50 for smoother
- Color: Choose contrasting color
- Width: 1-2 for visibility
Usage:
- Filter trades: Long above, Short below
- Dynamic support/resistance reference
- Trend confirmation
ALERT SETUP:
TradingView Alert Creation:
1. Enable alerts in indicator settings
2. Enable ORB Breakout Alerts
3. Right-click chart → Add Alert
4. Select this indicator
5. Choose "Any alert() function call"
6. Configure delivery method (mobile, email, webhook)
Alert Filtering:
- All alerts include quality rating
- High Quality alerts = Volume + MTF confirmed
- Standard alerts = Basic breakout only
───────────────────────────────────────
TRADING STRATEGIES
───────────────────────────────────────
CLASSIC ORB STRATEGY:
Setup:
1. Wait for opening range to complete
2. Price breaks and closes above ORH or below ORL
3. Volume > average (if enabled)
4. MTF bias aligned (if enabled)
Entry:
- Bullish: Buy on break above ORH
- Bearish: Sell on break below ORL
- Consider retest entries for better risk/reward
Stop Loss:
- Bullish: Below ORL or range mid-point
- Bearish: Above ORH or range mid-point
- Adjust based on volatility
Targets:
- Initial: Range width extension (ORH + range width)
- Secondary: HTF liquidity levels
- Final: Session high/low or major support/resistance
ORB + LIQUIDITY CONFLUENCE:
Enhanced Setup:
1. Opening range established
2. HTF liquidity level near or beyond ORH/ORL
3. Breakout occurs with volume
4. Price targets the liquidity level
Entry:
- Enter on ORB breakout
- Target the HTF liquidity level
- Use LTF liquidity for position management
Management:
- Partial profits at ORB + range width
- Move stop to breakeven at LTF liquidity
- Final exit at HTF liquidity sweep
ORB REJECTION STRATEGY (Counter-Trend):
Setup:
1. Price breaks above ORH or below ORL
2. Weak volume (below average)
3. MTF bias opposite to breakout
4. Price closes back inside range
Entry:
- Failed bullish break: Short below ORH
- Failed bearish break: Long above ORL
Stop Loss:
- Beyond the failed breakout level
- Or beyond session extreme
Target:
- Opposite end of opening range
- Range mid-point for partial profit
SESSION-BASED ORB TRADING:
Tokyo Session:
- Typically narrower ranges
- Good for range trading
- Wait for London open breakout
London Session:
- Highest volume and volatility
- Strong ORB setups
- Major liquidity sweeps common
New York Session:
- Strong trending moves
- News-driven volatility
- Good for momentum trades
Sydney Session:
- Quieter conditions
- Suitable for range strategies
- Sets up Tokyo session
EMA-FILTERED ORB:
Rules:
- Only take bullish breaks if price > EMA
- Only take bearish breaks if price < EMA
- Ignore counter-trend breaks
Benefits:
- Reduces false signals
- Aligns with larger trend
- Improves win rate
───────────────────────────────────────
CONFIGURATION GUIDE
───────────────────────────────────────
OPENING RANGE SETTINGS:
Time Period:
- 15 min: Standard for most markets
- 30 min: Wider range, fewer breakouts
- 60 min: For slower markets or swing trades
Custom Range:
- Use for specific market opens
- NYSE: 0930-1000 EST
- LSE: 0800-0830 GMT
- Set timezone to match exchange
Historical Display:
- Enable: See all previous session data
- Disable: Cleaner chart, current session only
LIQUIDITY SETTINGS:
Left Bars (5-30):
- Lower: More frequent, sensitive levels
- Higher: Fewer, more significant levels
- Recommended: 15 for most markets
Right Bars (1-25):
- Confirmation period
- Higher: More reliable, less frequent
- Recommended: 5 for balance
Display Limit (1-20):
- Number of active levels shown
- Higher: More context, busier chart
- Recommended: 7 for clarity
Extension Options:
- Short: Levels visible near formation
- Current: Extended to current bar (recommended)
- Max: Extended indefinitely
VOLUME SETTINGS:
MA Length (5-50):
- Shorter: More responsive to spikes
- Longer: Smoother baseline
- Recommended: 20 for balance
Spike Multiplier (1.0-3.0):
- Lower: More sensitive spike detection
- Higher: Only extreme spikes
- Recommended: 1.5 for day trading
MULTI-TIMEFRAME SETTINGS:
HTF 1 (Trend):
- 5m chart: Use 15m or 1H
- 15m chart: Use 1H or 4H
- 1H chart: Use 4H or 1D
HTF 2 (Bias):
- One level higher than HTF 1
- Provides longer-term context
- Don't use same as HTF 1
EMA SETTINGS:
Length:
- 20: Responsive, more signals
- 50: Smoother, stronger filter
- 200: Long-term trend only
Style:
- Choose contrasting color
- Width 1-2 for visibility
- Match your trading style
───────────────────────────────────────
BEST PRACTICES
───────────────────────────────────────
Chart Timeframe Selection:
- ORB Trading: Use 5m or 15m charts
- Session Review: Use 1H or 4H charts
- Swing Trading: Use 1H or 4H charts
Quality Over Quantity:
- Wait for high-quality alerts (volume + MTF)
- Avoid trading every breakout
- Focus on confluence setups
Risk Management:
- Position size based on range width
- Wider ranges = smaller positions
- Use stop losses always
- Take partial profits at targets
Market Conditions:
- Best results in trending markets
- Reduce position size in choppy conditions
- Consider session overlaps for volatility
- Avoid trading near major news if inexperienced
Continuous Improvement:
- Track win rate by session
- Note which confluence factors work best
- Adjust settings based on market volatility
- Review performance weekly
───────────────────────────────────────
PERFORMANCE OPTIMIZATION
───────────────────────────────────────
This indicator is optimized with:
- max_bars_back declarations for efficient processing
- Conditional calculations based on enabled features
- Proper memory management for drawing objects
- Minimal recalculation on each bar
Best Practices:
- Disable unused features (sessions, MTF, volume)
- Limit historical display to reduce rendering
- Use appropriate timeframe for your strategy
- Clear old drawing objects periodically
───────────────────────────────────────
EDUCATIONAL DISCLAIMER
───────────────────────────────────────
This indicator combines established trading concepts:
- Opening Range Breakout theory (price action)
- Liquidity level detection (pivot analysis)
- Session-based trading (time-of-day patterns)
- Volume analysis (confirmation technique)
- Multi-timeframe analysis (trend alignment)
All calculations use standard technical analysis methods:
- Pivot high/low detection algorithms
- Moving averages for trend and volume
- Session time filtering
- Timeframe security functions
The indicator identifies potential trading setups but does not predict future price movements. Success requires proper application within a complete trading strategy including risk management, position sizing, and market context.
───────────────────────────────────────
USAGE DISCLAIMER
───────────────────────────────────────
This tool is for educational and analytical purposes. Opening Range Breakout trading involves substantial risk. The alert system and quality filters are designed to identify potential setups but do not guarantee profitability. Always conduct independent analysis, use proper risk management, and never risk capital you cannot afford to lose. Past performance does not indicate future results. Trading intraday breakouts requires experience and discipline.
───────────────────────────────────────
CREDITS & ATTRIBUTION
───────────────────────────────────────
ORIGINAL SOURCE:
This indicator builds upon concepts from LuxAlgo's-ORB

Structure Labels ( HH / HL / LH / LL )Here’s a clean and efficient Pine Script (v5) code that automatically detects and labels Higher Highs ( HH ), Lower Highs ( LH ), Higher Lows ( HL ), and Lower Lows ( LL ) on your TradingView chart .

Trend scalping ROVTradingOnly trading with bullish or bearish trend. Working fine at m5 and m15 time frame

Gold H1 Breakout Failure (V11.0)This strategy is designed for trading XAU/USD (Gold) on the 1-hour timeframe. It identifies and trades fake breakouts of the Asian session range.
The logic is simple yet effective:
The script first marks the Asian session high and low.
Once price breaks out of this range and closes outside, it waits for confirmation by watching for price to close back inside the range.
When this re-entry occurs, the strategy takes a position in the opposite direction of the initial breakout, anticipating a false breakout or liquidity trap setup.
By focusing on these fakeouts, the strategy aims to capture reversal momentum after liquidity sweeps, making it especially effective during sessions when volatility transitions from Asia to London or New York.

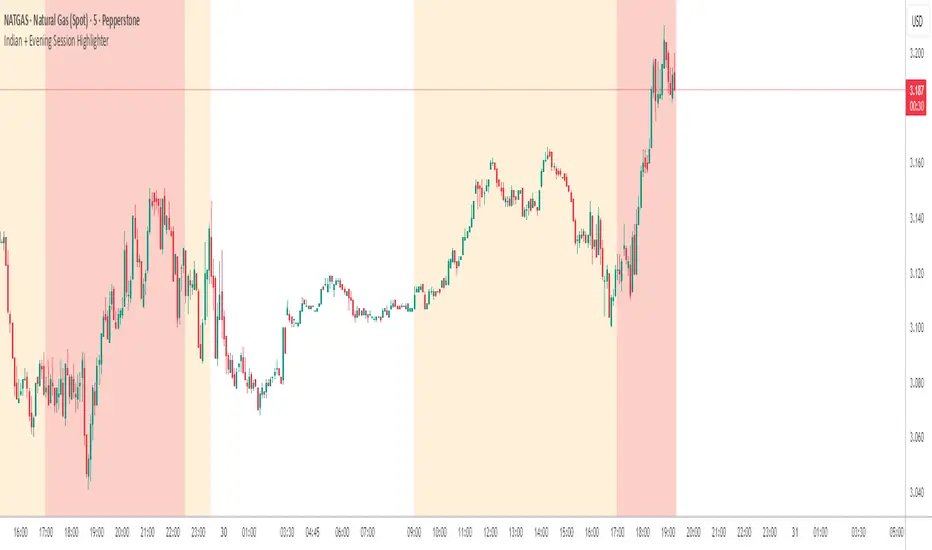
Indian + Evening Session HighlighterThis indicator visually highlights two key trading windows for Indian instruments according to IST:
Indian Session: 9:00 AM to 11:30 PM IST is shaded light orange on the chart, representing the main domestic trading hours for stocks, indices, commodities, or derivatives.
Evening Session: 5:00 PM to 10:30 PM IST is shaded light red, marking the commonly followed evening window, which often captures the impact of US and European market movements.
The indicator automatically overlays these session backgrounds on your chart, helping you quickly identify when price action occurs during India’s core and evening trade windows. This allows traders to focus on strategies specific to these time intervals, identify session-based volatility, and avoid trading during less active periods. If the evening session overlaps with the Indian session, the colors are layered for visual clarity.
It is ideal for intraday traders, option strategists, and anyone monitoring Indian market rhythms or US-linked volatility impacts on Indian assets. No inputs are required; simply apply the script and view distinct session highlights for improved timing and decision making.

ma+ko Arrowsma+ko ARROWS is a clean Supertrend-based indicator that generates precise BUY and SELL arrows without repainting after candle close.

Nqaba Goldminer StrategyThis indicator plots the New York session key timing levels used in institutional intraday models.
It automatically marks the 03:00 AM, 10:00 AM, and 2:00 PM (14:00) New York times each day:
Vertical lines show exactly when those time windows open — allowing traders to identify major global liquidity shifts between London, New York, and U.S. session overlaps.
Horizontal lines mark the opening price of the 5-minute candle that begins at each of those key times, providing precision reference levels for potential reversals, continuation setups, and intraday bias shifts.
Users can customize each line’s color, style (solid/dashed/dotted), width, and horizontal-line length.
A history toggle lets you display all past occurrences or just today’s key levels for a cleaner chart.
These reference levels form the foundation for strategies such as:
London Breakout to New York Reversal models
Opening Range / Session Open bias confirmation
Institutional volume transfer windows (London → NY → Asia)
The tool provides a simple visual structure for traders to frame intraday decision-making around recurring institutional time events.

XAUUSD Multi-Timeframe Supertrend Alert v2**Indicator Overview: XAUUSD Multi-Timeframe Supertrend Alert v2**
**Core Components:**
1. **Multi-Timeframe Supertrend System**
- Two Supertrend indicators (ST1 & ST2) with customizable timeframes
- ST1 typically set to Daily, ST2 to Weekly as main trend
- Visualized with distinct colors and background fills
2. **Customizable SMA**
- Adjustable period and timeframe
- Plotted as blue line for additional trend reference
3. **Neutral Zone System**
- Creates a neutral line offset from ST1 by customizable tick distance
- Yellow dashed line that adjusts based on ST1 trend direction
- **Alert Conditions:**
- **Test Buy Zone**: Both ST1 & ST2 in uptrend AND price enters neutral zone above ST1
- **Test Sell Zone**: Both ST1 & ST2 in downtrend AND price enters neutral zone below ST1
4. **Distance Lines from ST2**
- Upper/lower lines at customizable tick distance from ST2
- Purple dashed lines with touch alerts
**Trading Signals:**
- **Bullish Signal**: Price above ST2 but below ST1 (potential buy)
- **Bearish Signal**: Price below ST2 but above ST1 (potential sell)
- **Neutral Zone Alerts**: Price enters defined zone when both trends align
- **Line Touch Alerts**: Price touches distance lines from ST2
**Alert System:**
- Limited to 3 consecutive alerts per signal type
- Visual markers (triangles, diamonds, circles)
- Background coloring for signal zones
- Separate alert conditions for each signal type
**Visual Features:**
- Candles colored green/red based on signals
- Clear trend visualization with colored backgrounds
- Real-time alert markers without information table clutter
This indicator provides multi-timeframe trend analysis with precise entry zone detection and comprehensive alert system for XAUUSD trading. SAM89 M15, ST1 (5:10) M5, ST2 ( 1,5:20) H1, Test Buy Sell 7000, Line 15000

Goldencrossover - ema 5 over 13&26Goldencrossover - ema 5 over ema13& ema26 over the same candle.
Both up and down. If there is any such crossover during the same candle, then the indicator will highlight.

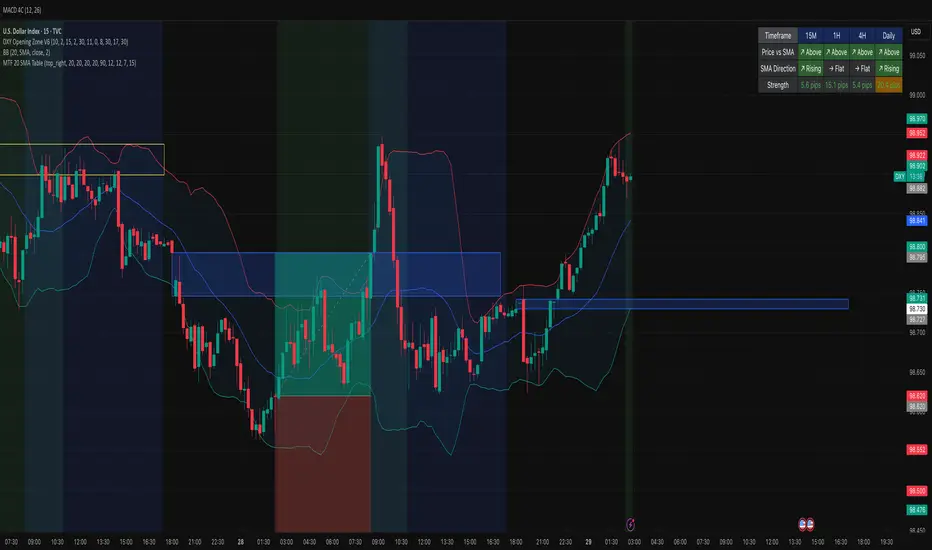
MTF 20 SMA Table - DXY**MTF 20 SMA Table - Multi-Timeframe Trend Analysis Dashboard**
**Overview:**
This indicator provides a comprehensive multi-timeframe analysis dashboard that displays the relationship between price and the 20-period Simple Moving Average (SMA) across four key timeframes: 15-minute, 1-hour, 4-hour, and Daily. It's designed to help traders quickly identify trend alignment and potential trading opportunities across multiple timeframes at a glance. It's definitely not perfect but has helped me speed up my backtesting efforts as it's worked well for me eliminating flipping back and forth between timeframes excpet when I have confluence on the table, then I check the HTF.
**How It Works:**
The indicator creates a table overlay on your chart showing three critical metrics for each timeframe:
1. **Price vs SMA (Row 1):** Shows whether price is currently above (bullish) or below (bearish) the 20 SMA
- Green = Price Above SMA
- Red = Price Below SMA
2. **SMA Direction (Row 2):** Indicates the trend direction of the SMA itself over a lookback period
- Green (↗ Rising) = Uptrend
- Red (↘ Falling) = Downtrend
- Gray (→ Flat) = Ranging/Consolidation
3. **Strength (Row 3):** Displays the distance between current price and the SMA in pips
- Purple background = Strong move (>50 pips away)
- Orange background = Moderate move (20-50 pips)
- Gray background = Weak/consolidating (<20 pips)
- Text color: Green for positive distance, Red for negative
**Key Features:**
- **Customizable Table Position:** Place the table anywhere on your chart (9 position options)
- **Adjustable SMA Lengths:** Modify the SMA period for each timeframe independently (default: 20)
- **Direction Lookback Settings:** Fine-tune how far back the indicator looks to determine SMA direction for each timeframe
- **Flat Threshold:** Set the pip threshold for determining when an SMA is "flat" vs trending (default: 5 pips)
- **DXY Optimized:** Calculations are calibrated for the US Dollar Index (1 pip = 0.01)
**Best Use Cases:**
1. **Trend Alignment:** Identify when multiple timeframes align in the same direction for higher probability trades
2. **Divergence Spotting:** Detect when lower timeframes diverge from higher timeframes (potential reversals)
3. **Entry Timing:** Use lower timeframe signals while higher timeframes confirm overall trend
4. **Strength Assessment:** Gauge how extended price is from the mean (SMA) to avoid overextended entries
**Settings Guide:**
- **SMA Settings Group:** Adjust the SMA period for each timeframe (15M, 1H, 4H, Daily)
- **SMA Direction Group:** Control lookback periods to determine trend direction
- 15M: Default 5 candles
- 1H: Default 10 candles
- 4H: Default 15 candles
- Daily: Default 20 candles
- **Flat Threshold:** Set sensitivity for "flat" detection (lower = more sensitive to ranging markets)
**Trading Strategy Examples:**
1. **Trend Following:** Look for all timeframes showing the same direction (all green or all red)
2. **Pullback Trading:** When Daily/4H are green but 15M/1H show red, wait for lower timeframes to flip green for entry
3. **Ranging Markets:** When multiple SMAs show "flat", consider range-bound strategies
**Important Notes:**
- This is a reference tool only, not a standalone trading system
- Always use proper risk management and combine with other analysis methods
- Best suited for trending instruments like indices and major forex pairs
- Calculations are optimized for DXY but can be used on other instruments (pip calculations may need adjustment)
**Credits:**
Feel free to modify and improve this code! Suggestions for enhancements are welcome in the comments.
---
**Installation Instructions:**
1. Add the indicator to your TradingView chart
2. Adjust the table position via settings to avoid overlap with price action
3. Customize SMA lengths and lookback periods to match your trading style
4. Monitor the table for timeframe alignment and trend confirmation
---
This indicator is published as open source for the community to learn from and improve upon. Happy trading! 📈
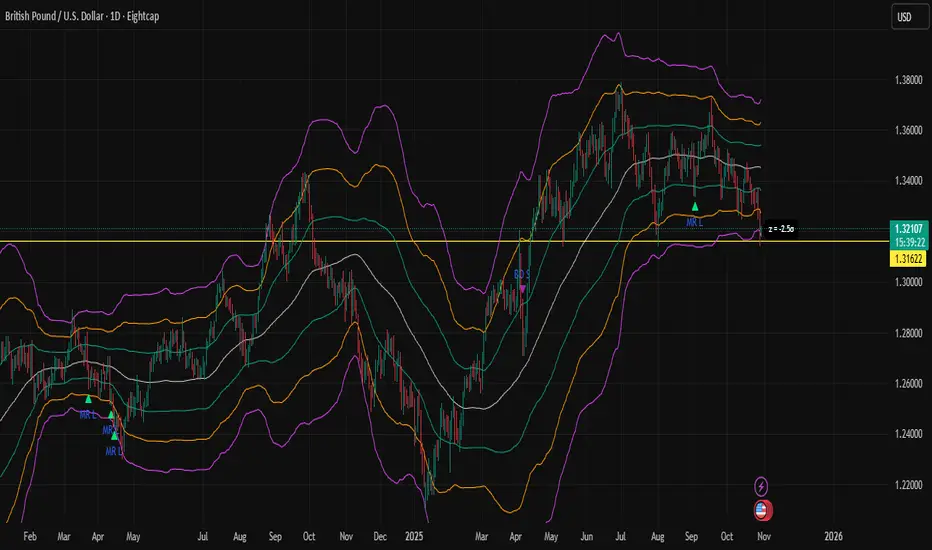
Z-Score Bands + SignalsZ-Score Statistical Market Analyzer
A multi-dimensional market structure indicator based on standardized deviation & regime logic
English Description
Concept
This indicator builds a statistical model of price behaviour by converting every candle’s movement into a Z-score — how many standard deviations each close is away from its moving average.
It visualizes the normal distribution structure of returns and provides adaptive entry signals for both Mean Reversion and Breakout regimes.
Rather than predicting price direction, it measures statistical displacement from equilibrium and dynamically adjusts the decision logic according to the market’s volatility regime.
⚙️ Main Components
Z-Score Bands (±1σ, ±2σ, ±3σ)
– The core structure visualizes volatility boundaries based on rolling mean and standard deviation.
– Price outside ±2σ often indicates statistical extremes.
Dual Signal Systems
Mean Reversion (MRL / MRS): when price (or return z-score) crosses back inside ±2σ bands.
Breakout (BOL / BOS): when price continues to expand beyond ±2σ.
Volatility Regime Classification
The indicator detects whether the market is currently in a low-vol or high-vol regime using percentile statistics of σ.
Low vol → Mean Reversion preferred
High vol → Breakout preferred
🧠 Adaptive Switches
A. Freeze MA/σ - Use previous-bar stats to avoid repainting and lag.
B. Confirm on Close - Only generate signals once the base-timeframe bar closes (eliminates look-ahead bias).
C. Return-based Signal - Use log-return Z-score instead of price deviation — normalizes volatility across assets.
D. Outlier Filter - Exclude bars with abnormal single-bar returns (e.g., >20%). Reduces false spikes.
E. Regime Gating - Automatically switch between Mean Reversion and Breakout logic depending on volatility percentile.
Each module can be toggled individually to test different statistical behaviours or tailor to a specific market condition.
📊 Interpretation
When the histogram of returns approximates a normal distribution, mean-reversion logic is often more effective.
When price persistently drifts beyond ±2σ or ±3σ, the distribution becomes leptokurtic (fat-tailed) — a breakout structure dominates.
Hence, this tool can help you:
Identify whether an asset behaves more “Gaussian” or “fat-tailed”;
Select the correct trading regime (MR or BO);
Quantitatively measure market tension and volatility clusters.
🧩 Recommended Use
Works on any timeframe and any asset.
Best used on liquid instruments (e.g., XAU/USD, indices, major FX pairs).
Combine with volume, sentiment or structural filters to confirm signals.
For strategy automation, pair with the companion script:
🧠 “Z-Score Strategy • Multi-Source Confirm (MRL/MRS/BOL/BOS)”.
⚠️ Disclaimer
This script is designed for educational and research purposes.
Statistical deviation ≠ directional prediction — use with sound risk management.
Past distribution patterns may shift under new volatility regimes.
==================================================================================
中文说明(简体)
概念简介
该指标基于价格的统计分布原理,将每根 K 线的波动转化为标准化的 Z-Score(标准差偏离值),用于刻画市场处于均衡或偏离状态。
它同时支持 均值回归(Mean Reversion) 与 突破延展(Breakout) 两种逻辑,并可根据市场波动结构自动切换策略模式。
⚙️ 主要功能模块
Z-Score 通道(±1σ / ±2σ / ±3σ)
用滚动均值与标准差动态绘制的统计波动带,价格超出 ±2σ 区域通常意味着极端偏离。
双信号系统
MRL / MRS(均值回归多空):价格重新回到 ±2σ 以内时触发。
BOL / BOS(突破延展多空):价格持续运行在 ±2σ 之外时触发。
波动率分层
自动识别市场处于高波动还是低波动区间:
低波动期 → 适合均值回归逻辑;
高波动期 → 适合突破趋势逻辑。
🧠 A–E 模块说明
A. 固定统计参数:使用上一根 K 线的均值和标准差,防止重绘。
B. 收盘确认信号:仅在当前时间框架收盘后生成信号,避免前视偏差。
C. 收益率信号模式:采用对数收益率的 Z-Score,更具普适性。
D. 异常波过滤:忽略单根极端波动(如 >20%)的噪声信号。
E. 波动率调节逻辑:根据市场处于高/低波动区间,自动切换 MRL/MRS 或 BOL/BOS。
📊 应用解读
如果收益率分布接近正态分布 → 市场倾向震荡,MRL/MRS 效果较佳;
若价格频繁偏离 ±2σ 或 ±3σ → 市场呈现“肥尾”分布,趋势延展占主导。
因此,该指标的核心目标是:
识别当前市场的统计结构类型;
根据波动特征自动切换交易逻辑;
提供结构化、可量化的市场状态刻画。
💡 使用建议
适用于所有时间框架与金融品种。
建议结合成交量或结构性指标过滤。
若用于策略回测,可搭配同名 “Z-Score Strategy • Multi-Source Confirm” 策略脚本。
⚠️ 免责声明
本指标仅用于研究与教学,不构成任何投资建议。
统计偏离 ≠ 趋势预测,实际市场行为可能在不同波动结构下改变。
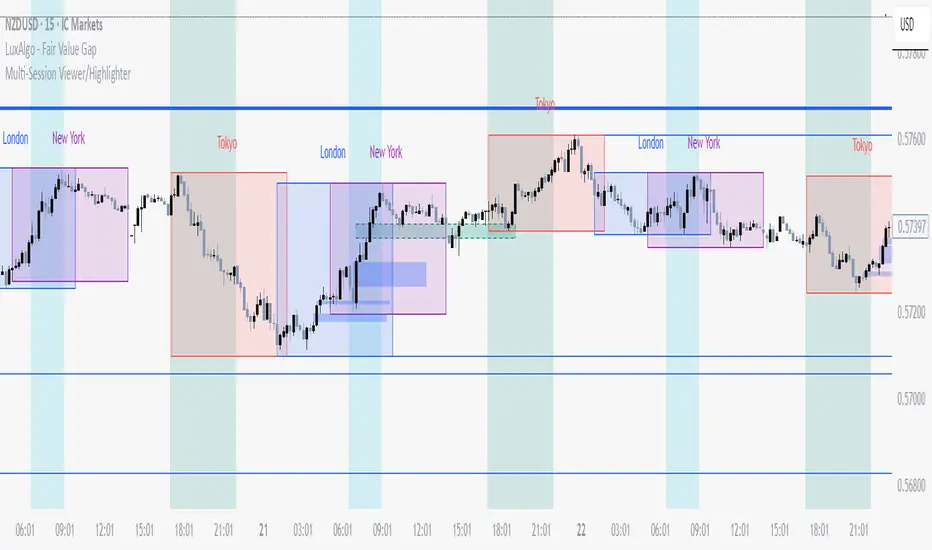
Multi-Session Viewer and AnalyzerFully customizable multi-session viewer that takes session analysis to the next level. It allows you to fully customize each session to your liking. Includes a feature that highlights certain periods of time on the chart and a Time Range Marker.
It helps you analyze the instrument that you trade and pinpoint which times are more volatile than others. It also helps you choose the best time to trade your instrument and align your life schedule with the market.
NZDUSD Example:
- 3 major sessions displayed.
- Although this is NZDUSD, Sydney is not the best time to trade this pair. Volatility picks up at Tokyo open.
- I have time to trade in the evening from 18:00 to 22:00 PST. I live in a different time zone, whereas market is based on EST. How does the pair behave during the time I am available to trade based on my time zone? Time Range Marker feature allows you to see this clearly on the chart (black lines).
- I have some time in the morning to trade during New York session, but there is no way I am waking up at 05:00 PST. 06:30 PST seems doable. Blue highlighted area is good time to trade during New York session based on what Bob said. It seem like this aligns with when I am available and when I am able to trade. Volatility is also at its peak.
- I am also available to trade between London close and Tokyo open on some days of the week, but... based on what I see, green highlighted area is clearly showing that I probably don't want to waste my time trading this pair from London close and until Tokyo open. I will use this time for something else rather than be stuck in a range.
Spooky Time (10/31/25) [VTB]Get ready to add some eerie fun to your charts this Halloween! "Spooky Time" is a lighthearted indicator that draws a festive, animated Halloween scene right on your TradingView chart. Perfect for traders who want to celebrate the spooky season without missing a beat on the markets. Whether you're analyzing stocks, crypto, or forex, this overlay brings a touch of holiday spirit to your setup.
#### Key Features:
- **Jack-o'-Lantern Pumpkin**: A detailed, glowing pumpkin with carved eyes, nose, and a jagged mouth. The eyes and mouth cycle through black (off), yellow, and red glows for a subtle animation effect, giving it that classic haunted vibe.
- **Flickering Candle**: A wax candle with a wick and an animated flame that shifts positions slightly across three frames, mimicking a real flickering light. The flame color changes between yellow, red, and orange for added dynamism.
- **Spider Web and Spider**: A spiral web with radial lines, complete with a creepy-crawly spider. The spider's legs animate with small movements, as if it's ready to pounce—perfect for that extra spooky touch!
- **Customization Options**: Toggle the "Desiringmachine" label on/off, choose its position on the chart (e.g., Bottom Center), and select the text color. The entire scene is positioned relative to the chart's open price and ATR for better scaling.
- **Animation Cycle**: The whole setup uses a simple 3-frame animation based on bar_index, making it feel alive without overwhelming your chart.
This indicator is purely visual and non-intrusive—it doesn't plot any trading signals or data, so it won't interfere with your strategies. Just add it to your chart for some Halloween cheer during your trading sessions!
**Date Note**: Timed for Halloween 2025 (10/31/25)—feel the spooky energy!
**Happy Halloween!!!** 🎃👻🕸️

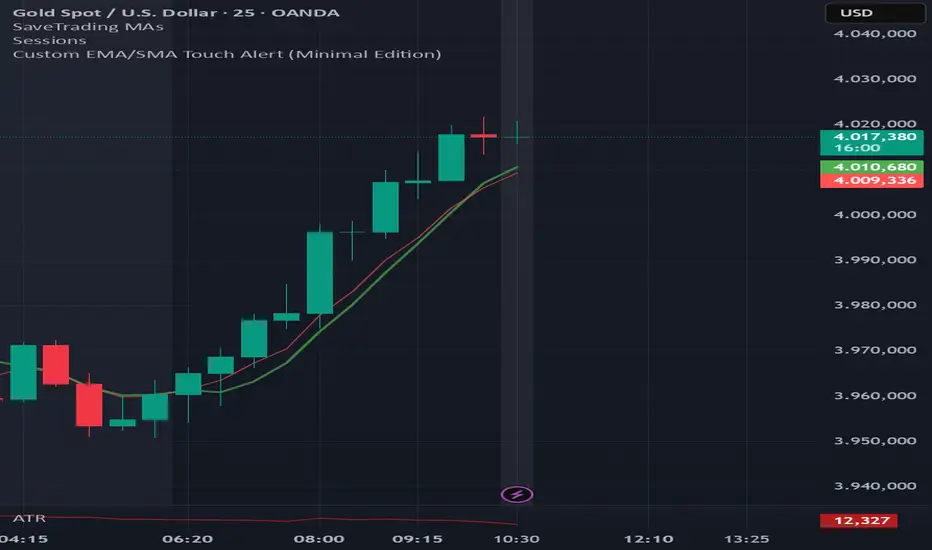
EMA6 or SMA6 Touch AlertThis script monitors the market and notifies you whenever the price touches either the 6-period EMA or the 6-period SMA.
It helps identify potential pullbacks, reaction points, or entry zones, as price interaction with these moving averages often signals short-term market shifts.
What the script does:
Calculates the EMA 6 and SMA 6
Detects if price touches either moving average within the candle
Plots both lines on the chart for visibility
Allows you to set alerts to receive automatic notifications
Best suited for:
Scalping
Day Trading
Pullback Entries
Short-term trend reactions