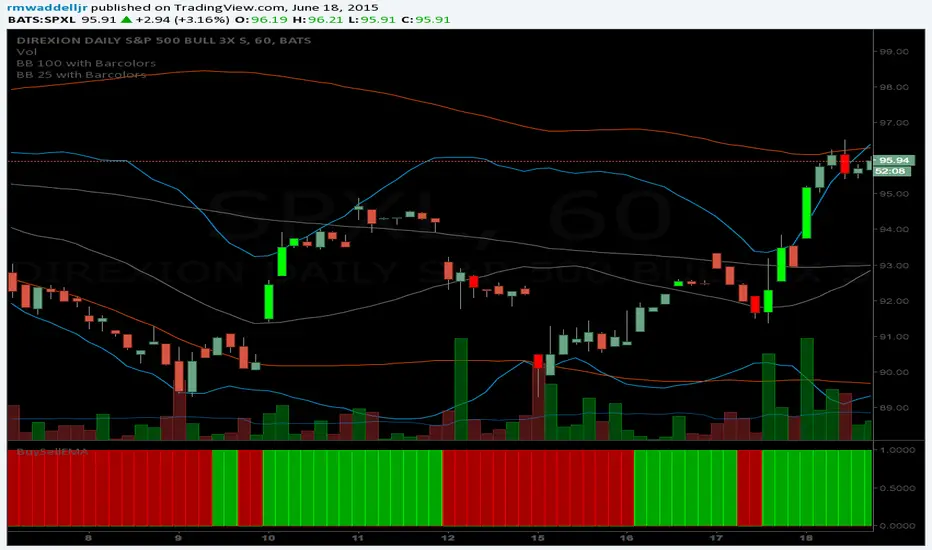
BB 25 with Barcolors6/19/15 I added confirmation highlight bars to the code. In other words, if a candle bounced off the lower Bollinger band, it needed one more close above the previous candle to confirm a higher probability that a change in investor sentiment has reversed. Same is true for upper Bollinger band bounces. I also added confirmation highlight bars to the 25 sma (the basis). The idea is that lower and upper bands are potential points of support and resistance. The same is true of the basis if a trend is to continue. Nothing moves in a straight line. As with any indicator, it is a tool to be used in conjunction with the art AND science of trading. As always, try the indicator for a time so that you are comfortable enough to use real money. This is designed to be used with "BB 100 with Barcolors"
Tìm kiếm tập lệnh với "英国央行降息25个基点"
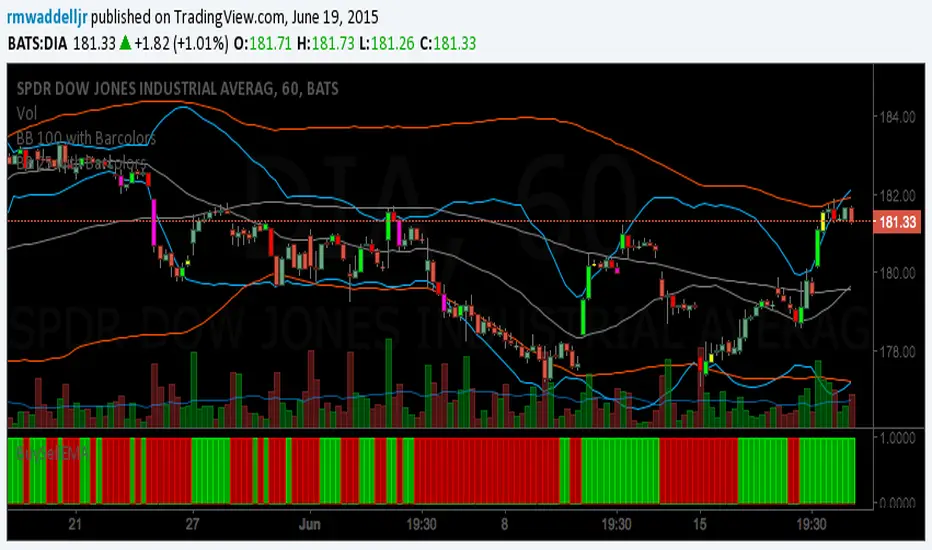
BB 25 with BarcolorsI cleaned up the highlight bar colors to reflect a red or lime bar depending on if it closed > or < its open.
The description is in the code. you want to catch bounces off the 25 (upper or lower) and 100 (upper or lower).
Works well on the hourly and 30 min charts. Haven't tested it beyond that. Haven't tested Forex, just equities.
25 Percent LevelsThis script materialises an observation from one of my mentors whereby if you take an all-time high and all-time low and mark off the 25th, 50th and 75th percentile levels you will see some levels of supply and demand being respected.

Trend Gazer v2English Follows;
---
# Trend Gazer v2 - マルチタイムフレーム トレーディング インジケータ
## 📊 概要
**Trend Gazer v2** は、**ボリューメトリックウェイテッドクラウド(VWC)**、**リバースRSIシグナル**、**ICTドンチアンスマートマネーストラクチャー**、**マルチタイムフレームボリンジャーバンド**、**EMA分析**を組み合わせた高度なトレーディングインジケータです。
**7種類のシグナルタイプ**と**4つの設定可能なフィルター**を搭載し、特にEMA塗りつぶし色遷移期間中のフィルタリング機能(**フィルター4**)により、トレンド変化時の偽シグナルを削減します。
---
## ✨ 主要機能
### v2の新機能: フィルター4 - EMA塗りつぶし遷移期間フィルター(デフォルト有効)
**フィルター4**は、EMA塗りつぶし色の遷移期間中に方向性バイアスを作成し、偽シグナルを削減します:
**動作ロジック:**
1. **すべて青 → 遷移開始(一部が赤に)→ BUYのみ表示 → すべて赤 OR 青に戻る(期間終了)**
- 遷移期間中はSELLシグナルをすべてブロック
2. **すべて赤 → 遷移開始(一部が青に)→ SELLのみ表示 → すべて青 OR 赤に戻る(期間終了)**
- 遷移期間中はBUYシグナルをすべてブロック
**終了条件:**
- 遷移が完了(すべて目標色になる)
- 元の色に戻る(遷移失敗)
**⭐ 特徴:** 他のフィルター(1,2,3)はシグナル1-5のみに適用されますが、**フィルター4はすべてのシグナル(S1-7)に適用**されます。これにより、トレンド変化時の一貫したフィルタリングを実現し、勝率向上に貢献します。
---
### 1. **複数シグナルタイプ(7種類)**
**シグナル1:** マーケットストラクチャーが強気(Bullish Structure) かつ リバースRSIが強気にシフト
**シグナル2:** (マーケットストラクチャーが強気 または リバースRSIが強気) かつ VWC UPシグナル検知
**シグナル3:** リバースRSIが強気 かつ マーケットストラクチャーが弱気から強気に変化(ストラクチャースイッチ)
**シグナル4:** マーケットストラクチャーが強気 かつ VWCシグナルがUP状態(初回のみ)
**シグナル5:** 15分足下部ボリンジャーバンドを上抜けた後、リバースRSI強気シグナル検知
**シグナル6:** 15分足下部BB または EMA50を上抜けた後、初回のリバースRSI強気シグナル(フィルター1,2,3をバイパス、フィルター4のみ適用)
**シグナル7:** マーケットストラクチャーが強気 かつ EMA20またはEMA50から上に反発後、最初のBUY検知(フィルター1,2,3をバイパス、フィルター4のみ適用)
*(SELLシグナルは逆ロジックに従う)*
---
### 2. **高度なフィルタリングシステム**
**フィルター1: RSI方向フィルター(デフォルト:ON) - シグナル1-5のみ**
- リバースRSIが強気 または マーケットストラクチャーが強気の時のみBUYを表示
- リバースRSIが弱気 または マーケットストラクチャーが弱気の時のみSELLを表示
- 強い方向性のある動きでの逆張りシグナルを防止
**フィルター2: EMA配列フィルター(デフォルト:ON) - シグナル1-5のみ**
- SELLシグナルはEMA配列が確認された時のみ表示:
- `ema20 > ema50 > ema100 > ema200`(強い下降トレンド)、または
- `ema20 < ema50 < ema100 < ema200`(強い上昇トレンド)
- レンジ相場での偽シグナルを削減
**フィルター3: ボリンジャーバンド方向フィルター(デフォルト:ON) - シグナル1-5のみ**
- 15分足上部BB かつ 60分足上部BBを下抜け後 → 15分足下部BBにタッチするまでSELLのみ表示
- 15分足下部BB かつ 60分足下部BBを上抜け後 → 15分足上部BBにタッチするまでBUYのみ表示
- 高確率エントリーのための方向バイアスゾーンを作成
**⭐ フィルター4: EMA塗りつぶし遷移期間フィルター(デフォルト:ON) - 全シグナル1-7に適用**
- すべてのEMA塗りつぶしが青から赤に遷移中 → BUYのみ表示(SELLブロック)
- すべてのEMA塗りつぶしが赤から青に遷移中 → SELLのみ表示(BUYブロック)
- 遷移が完了または元の色に戻ると期間終了
- トレンド変化時の偽シグナルを削減し、勝率向上に貢献
**注意:** シグナル6, 7はフィルター1,2,3をバイパスしますが、フィルター4は適用されます。
---
### 3. **マルチタイムフレームボリンジャーバンド**
- **15分足ボリンジャーバンド**(黒い点線): 短期ボラティリティゾーン
- **60分足ボリンジャーバンド**(黒/カスタマイズ可能): 長期サポート/レジスタンス
これらのバンドは以下を識別:
- **買われ過ぎ/売られ過ぎの状態**
- **ブレイクアウト確認**(シグナル5,6)
- **平均回帰の機会**
---
### 4. **7本の指数移動平均(EMA)**
- **EMA 7, 20, 50, 100, 200, 400, 800**
- EMA20-50間とEMA50-200間の動的**EMA塗りつぶし**でトレンドバイアスを色分け:
- **赤色塗りつぶし:** 弱気配列(ema20 > ema50 > ema200)
- **青色塗りつぶし:** 強気配列(ema20 < ema50 < ema200)
- EMAはシグナル7の反発検知のための動的サポート/レジスタンスとして機能
- **フィルター4はEMA塗りつぶし**の遷移を監視して方向性バイアスを作成
---
### 5. **ICTドンチアンスマートマネーストラクチャー**
- ローソク足の枠に色を付けてマーケットストラクチャーを可視化:
- **赤枠(Bullish Structure):** 強気ストラクチャー(買い手が優勢)
- **緑枠(Bearish Structure):** 弱気ストラクチャー(売り手が優勢)
- ドンチアンチャネルとピボットベースのストラクチャーブレイクに基づく
- シグナル1, 3, 4, 7の検知に不可欠
---
### 6. **リバースRSIシグナル**
- RSI計算を反転させてオシレーター値ではなく価格レベルを導出
- **RSIミッドラインのスーパートレンド**がトレンドシフトを判定:
- **強気シフト:** 上昇モメンタムの可能性
- **弱気シフト:** 下降モメンタムの可能性
- 半透明ラベル("Bullish"/"Bearish")として価格の上下に表示
---
### 7. **VWC(ボリューメトリックウェイテッドクラウド)トレンド検知器**
- 市場状況に応じて拡大/縮小する適応型ボラティリティベースバンド
- 価格がバンド内に入ると**UP/DOWNシグナル**を提供
- VWCステータステーブルには以下を表示:
- 現在のトレンド方向(BULLISH/BEARISH)
- EMA配列ステータス
- 最後に表示したシグナル(BUY/SELL)とシグナル以降のバー数
---
## 🎯 トレード戦略
### 推奨アプローチ
**1. トレンドフォロー(シグナル1, 2, 4)**
- 明確なマーケットストラクチャー(強気または弱気ストラクチャー)を待つ
- VWCトレンド + RSI方向 + ストラクチャー配列の合致でエントリー
- EMA塗りつぶしを動的ストップロスゾーンとして使用
**2. 反転トレード(シグナル5, 6, 7, 8)**
- **シグナル5,6**: ボリンジャーバンドブレイクアウトと反転を特定
- **シグナル7**: ストラクチャー確認を伴うEMA反発を探す
- **シグナル8**: **早期トレンド反転** - トレンド変化の最初期でエントリー
- これらのシグナルは特定フィルターをバイパスし早期エントリー機会を提供
**3. シグナル8 - 早期トレンド反転戦略 (v2新機能)**
**最適な使用ケース:**
- **上位時間軸(15分足〜1時間足)**: 主要なトレンド反転の捕捉に最も信頼性が高い
- **スイングトレード**: 数日間のポジションエントリーに最適
- **確認トレード**: 他のシグナルと組み合わせて高信頼度エントリー
**シグナル8のトレード方法:**
- **BUY(青→赤遷移)**:
- すべてのEMA塗りつぶしが青から赤に変化するのを監視
- エントリー: シグナル8 BUYラベルが出現した時
- ストップロス: 直近スイング安値またはEMA200の下
- 利確: 次のレジスタンスを目標、またはEMA50でトレーリングストップ
- **SELL(赤→青遷移)**:
- すべてのEMA塗りつぶしが赤から青に変化するのを監視
- エントリー: シグナル8 SELLラベルが出現した時
- ストップロス: 直近スイング高値またはEMA200の上
- 利確: 次のサポートを目標、またはEMA50でトレーリングストップ
**シグナル8の利点:**
- 他のシグナルより5-10バー早くトレンド反転を捕捉
- 新トレンド開始時の低リスクエントリー
- より高いリワード可能性(トレンド初期でのエントリー)
**シグナル8のリスク:**
- レンジ/不規則相場では偽シグナルを生成する可能性
- 上位時間軸での確認と組み合わせるのがベスト
- 早期エントリーのため、より大きなストップロスの使用を検討
---
### リスク管理
- **EMA20/EMA50**をトレーリングストップロスレベルとして使用
- シグナル8では:**EMA200**を主要トレンドストップロスとして使用
- 反対シグナルまたは主要EMAクロス時に決済
- 上位時間軸のトレンド確認と組み合わせ(60分足以上チャート)
- VWCステータステーブルが矛盾するシグナルを示す時は取引を避ける
### 推奨時間軸
- **シグナル8最適時間軸:** 15分足〜1時間足(早期トレンド反転用)
- **他のシグナル:** 1分足~15分足(スキャルピング/デイトレード)
- **上位時間軸:** 1時間足以上でも機能するがシグナル数は減少
- **補完的使用:** 4時間足/日足チャートで全体トレンド方向を確認
---
## 🔄 MTF OB & FVG Detectorとの統合トレード戦略
**Trend Gazer v2**と**MTF OB & FVG Detector**を組み合わせることで、機関投資家のオーダーフロー(OB)と市場の需給ギャップ(FVG)を活用した高度なトレーディング戦略を実現できます。
### 統合戦略の利点
**1. 最高確率エントリーポイントの特定**
- Trend GazerのBUY/SELLシグナル + OB/FVGゾーン = **最高確率エントリーポイント**
- 複数の時間足(5分、15分、60分)からのOB統合 + Trend Gazerシグナル = **機関投資家とトレンドの合致**
**2. 精密なエントリー価格の決定**
- Trend Gazerでトレンド方向と市場バイアスを確認
- OB/FVGゾーンで正確なエントリー価格を特定
- 不要なリスクを削減し、リワード比率を最大化
**3. 強化されたストップロス管理**
- EMA20/50(Trend Gazer)をトレーリングストップロスとして使用
- OBゾーン(MTF OB & FVG)を追加の防御ラインとして設定
- 多層防御によるリスク管理
---
### 推奨統合戦略
#### 戦略1: 高確率コンフルエンスエントリー 【最推奨】
**セットアップ:**
1. Trend Gazer v2でBUY/SELLシグナルを監視
2. MTF OB & FVG Detectorで統合OB/FVGゾーン(3つ以上の時間足)を特定
3. 両者が同じ価格ゾーンで一致するのを待つ
**エントリー条件(BUY例):**
- ✅ Trend Gazer: BUYシグナル発生(シグナル1-7のいずれか)
- ✅ MTF OB & FVG: ブリッシュOBゾーン(特に統合ゾーン)に価格がタッチ
- ✅ フィルター4(EMA遷移期間): 青→赤遷移中(BUYのみ期間)
- ✅ マーケットストラクチャー: 強気(赤枠)
- ✅ 高ボリューム: OBゾーンのボリュームパーセンテージが75%以上
**エントリー:**
- 価格がOBゾーン内でTrend GazerのBUYシグナルが点灯したバーの終値でエントリー
- または、次バーの始値でエントリー
**ストップロス:**
1. **初期SL**: OBゾーンの下端 - (5-10 pips/ポイント)
2. **代替SL**: EMA50の下(より広いSL、スイングトレード向け)
3. **タイトSL**: 直近安値 - (3-5 pips/ポイント)(スキャルピング向け)
**利確ターゲット:**
1. **T1(50%)**: 次の上位時間足ベアリッシュOB/FVGゾーン
2. **T2(30%)**: 60分足ボリンジャーバンド上限
3. **T3(20%)**: EMA20/50でトレーリング、逆シグナルまで保持
**SELL例は逆ロジック適用**
---
#### 戦略2: 精密反転エントリー【中級者向け】
**最適使用場面:**
- 強いトレンドの終了時
- 重要な統合OB/FVGゾーンでの反転
- 上位時間足のサポート/レジスタンスレベル
**エントリー条件(SELL例):**
1. **上位時間足確認:**
- 60分足でベアリッシュOB統合ゾーンを特定
- 価格が統合ゾーンに到達
2. **Trend Gazerシグナル:**
- **シグナル5**: 15分足上部BBを下抜け + リバースRSI弱気シフト、または
- **シグナル6**: 15分足上部BB/EMA50下抜け後の初回RSI弱気シグナル、または
- **シグナル7**: マーケットストラクチャー弱気 + EMA20/50からの下方反発
3. **OB/FVG確認:**
- 15分足または60分足のベアリッシュOBゾーンで反発確認
- FVGが上方に残っている(価格磁石効果)
**エントリー:**
- Trend Gazerシグナル + OBゾーン反発の両方確認後
- ローソク足パターン確認(ピンバー、エンガルフィング等)推奨
**ストップロス:**
- OBゾーン上端 + 10-15 pips/ポイント
- または60分足上部BBの上
**利確:**
- **T1**: 下位時間足ブリッシュOB/FVGゾーン(未充填FVG優先)
- **T2**: 15分足下部BB
- **T3**: 逆シグナルまたはEMA20/50タッチ
**BUY例は逆ロジック適用**
---
#### 戦略3: トレンドフォロー with OBサポート【初心者向け】
**シンプルなアプローチ:**
**BUY戦略:**
1. **トレンド確認(Trend Gazer):**
- EMA塗りつぶしが赤色(弱気配列)
- VWCステータスがBULLISH
- マーケットストラクチャーが強気(赤枠)
2. **押し目待ち:**
- 価格が下位時間足(5分または15分)のブリッシュOBゾーンまで調整
- Trend Gazerの**シグナル1, 2, または4**が発生
3. **エントリー:**
- OBゾーン内でBUYシグナル点灯時
- ローソク足の実体終値でエントリー
4. **ストップロス:**
- OBゾーン下端 - 10 pips/ポイント
5. **利確:**
- **簡易**: リスクの2倍(1:2 R:R)
- **動的**: 次のベアリッシュOBまたは逆シグナルまで
**SELL戦略は逆ロジック適用**
---
#### 戦略4: FVGフィリング with Trend Gazer確認【スキャルピング】
**短期トレーダー向け:**
**セットアップ:**
- 未充填のFVG(ブリッシュまたはベアリッシュ)を特定
- FVGが現在価格から離れている(最低20-30 pips/ポイント)
**BUY例(ブリッシュFVG下方):**
1. **FVG識別:**
- 下方に未充填のブリッシュFVG(オレンジボックス)
- 高ボリュームFVG優先(75%以上)
2. **Trend Gazer確認:**
- 価格がFVGに近づく
- マーケットストラクチャーが強気に転換
- **シグナル3, 4, または7**がFVGゾーン近辺で発生
3. **エントリー:**
- 価格がFVG内に入り、Trend GazerシグナルでFVGからの反発確認
- ローソク足の実体終値でエントリー
4. **ストップロス:**
- FVG下端 - 5-7 pips/ポイント(タイト)
5. **利確:**
- **T1(70%)**: FVG上端(ギャップ充填)
- **T2(30%)**: 次のレジスタンスまたは逆シグナル
**SELL例(ベアリッシュFVG上方)は逆ロジック適用**
---
### 統合使用のベストプラクティス
**1. チャート設定:**
- **メインチャート時間足**: 5分足または15分足
- **Trend Gazer v2**: すべてのシグナルとフィルター有効
- **MTF OB & FVG Detector**: 5分、15分、60分を有効化、統合機能ON
**2. アラート設定:**
- Trend Gazer: BUY/SELLシグナルアラート有効
- MTF OB & FVG: 反発アラート + 統合ゾーンアラート有効(Min 3 OBs)
- 両方のアラートが同時に鳴る = 最高確率エントリー
**3. 確認チェックリスト(エントリー前):**
- Trend GazerのBUY/SELLシグナル確認
- OB/FVGゾーンが価格に重なっている
- フィルター4が方向を支持(遷移期間中)
- マーケットストラクチャーが一致
- OB/FVGの高ボリューム確認(70%以上推奨)
- 上位時間足のトレンドが矛盾していない
- リスク:リワード比率が最低1:1.5以上
**4. リスク管理ルール:**
- 1トレードあたりの資金リスク: 口座残高の0.5-1%
- 同時ポジション: 最大2-3(相関性の低い銘柄のみ)
- 連続損失後: 3連敗後は休憩、戦略見直し
- 日次損失上限: 口座残高の2-3%
**5. 避けるべき状況:**
- ❌ Trend Gazerシグナルなしで、OB/FVGのみでエントリー
- ❌ 重要経済指標発表の直前/直後(ボラティリティスパイク)
- ❌ 複数フィルターが矛盾している時
- ❌ OB/FVGゾーンが既に複数回テストされている(弱体化)
- ❌ 流動性が低い時間帯(アジア早朝等)
---
### 統合戦略のパフォーマンス向上Tips
**1. 時間足の選択:**
- **スキャルピング**: 1分/3分足OB + 5分足Trend Gazerシグナル
- **デイトレード**: 5分/15分足OB + 15分足Trend Gazerシグナル
- **スイングトレード**: 15分/60分足OB + 60分足Trend Gazerシグナル
**2. 統合ゾーンの優先順位:**
- **最高優先**: 60分足OB統合(3つ以上)+ Trend Gazer Signal 6 or 7
- **高優先**: 15分足OB統合 + フィルター4遷移期間 + Signal 1-5
- **中優先**: 5分足OB + マーケットストラクチャー一致 + Signal 1-4
- **低優先**: 単一時間足OB + 基本シグナル(確認重視)
**3. バックテスト推奨:**
- 過去1-3ヶ月のデータで各戦略をテスト
- 勝率、平均R:R、最大ドローダウンを記録
- 自分のトレードスタイルに最適な組み合わせを発見
**4. 継続的改善:**
- トレード日誌を記録(スクリーンショット含む)
- 週次でパフォーマンスレビュー
- 有効な組み合わせパターンを文書化
- 市場環境の変化に応じて調整
---
### 統合戦略の実例
**実例1: 完璧なコンフルエンスBUY**
```
状況:
- 15分足チャート、EUR/USD
- 価格が60分足ブリッシュOB統合ゾーン(5分+15分+60分)にタッチ
- Trend Gazer Signal 6発生: 15分足下部BB上抜け後、初回RSI強気シグナル
- フィルター4: EMA塗りつぶし青→赤遷移中(BUYのみ期間)
- マーケットストラクチャー: 強気(赤枠)に転換
- OBボリューム: 82%(強い買い圧力)
エントリー: 1.0850(OBゾーン中央)
ストップロス: 1.0835(OBゾーン下端 - 5 pips)
利確T1: 1.0875(次の15分足ベアリッシュOB)- 達成
利確T2: 1.0895(60分足上部BB)- 達成
利確T3: 1.0920(EMA20トレーリング)- 逆シグナル手前で決済
結果: +70 pips、リスク15 pips = 4.67:1 R:R
```
**実例2: FVGフィリング with 反転確認SELL**
```
状況:
- 5分足チャート、GBP/JPY
- 上方に未充填ベアリッシュFVG(アクアボックス、15分足)
- 価格が急騰してFVGに到達
- Trend Gazer Signal 7発生: マーケットストラクチャー弱気 + EMA50からの下方反発
- リバースRSI: 弱気シフト
- FVGボリューム: 78%(強い売り圧力)
エントリー: 191.50(FVG上端での反発確認)
ストップロス: 191.75(FVG上端 + 25 pips)
利確T1: 191.00(FVG下端、ギャップ充填)- 達成
利確T2: 190.70(次のブリッシュOB)- 部分達成
結果: +50 pips(加重平均)、リスク25 pips = 2:1 R:R
```
---
### まとめ: なぜこの統合が強力なのか
**Trend Gazer v2の役割:**
- ✅ トレンド方向の確認(VWC、EMA、ストラクチャー)
- ✅ タイミングシグナル(7種類のエントリー機会)
- ✅ 複数フィルターによる偽シグナル削減
- ✅ 動的ストップロス管理(EMA、BB)
**MTF OB & FVG Detectorの役割:**
- ✅ 機関投資家のオーダーフロー可視化
- ✅ 正確な価格ゾーン特定(精密エントリー)
- ✅ 高確率サポート/レジスタンスレベル
- ✅ ボリューム分析による強度確認
**統合による相乗効果:**
- 🎯 **確率の掛け算**: 各インジケーター単独でも有効だが、両者の一致で確率が大幅向上
- 🎯 **リスク削減**: より精密なストップロス設定で損失を最小化
- 🎯 **リワード最大化**: 最適なエントリー価格で利益幅を拡大
- 🎯 **多様な戦略**: トレンドフォロー、反転、スキャルピング、スイング全てに対応
**推奨開始手順:**
1. デモ口座で戦略1(コンフルエンスエントリー)を2週間テスト
2. トレード日誌を記録し、パターンを学習
3. 小額リアル口座で同じ戦略を実践(最小ロット)
4. 自信がついたら戦略2, 3に拡張
5. 継続的にバックテストと改善を実施
この統合アプローチにより、市場の**需給ゾーン(OB/FVG)**と**トレンドモメンタム(Trend Gazer)**の両方を活用した、プロフェッショナルレベルのトレーディング戦略を実現できます。
---
## ⚙️ 入力パラメータ
### シグナル8設定 (v2新機能)
- **シグナル8を有効化: EMA塗りつぶし色遷移:** シグナル8のオン/オフ切り替え(デフォルト:OFF)
- **EMA傾きルックバック:** EMA傾き計算の期間(デフォルト:5、範囲:2-20)
- 低い値: より敏感、早期シグナル
- 高い値: より安定、偽シグナル減少
### シグナル表示設定
- **BUY/SELLラベルを表示:** メインエントリーシグナルの切り替え
- **RSIトレンドシフトラベルを表示:** Bullish/Bearish RSIシフトの表示
- **ラベルサイズ:** Small、Normal、Large、Huge
- **ラベル位置:** バー上またはATRでオフセット
### フィルター設定
- **RSI方向フィルターを有効化:** RSIトレンドでシグナルをフィルター(デフォルト:ON)
- **EMA配列フィルターを有効化:** SELLシグナルにEMA配列を要求(デフォルト:ON)
- **BB方向フィルターを有効化:** BBブレイクアウト後に方向バイアスゾーンを作成(デフォルト:ON)
### ビジュアル設定
- **ストラクチャーキャンドルを表示:** マーケットストラクチャーでキャンドルの枠に色付け
- **EMAを表示:** 7本の指数移動平均を表示
- **EMA塗りつぶしを表示:** 主要EMA間の色付き塗りつぶしを表示(シグナル8に重要)
- **15分足ボリンジャーバンドを表示:** 短期BBを表示
- **60分足ボリンジャーバンドを表示:** 長期BBを表示
- **VWCステータステーブル:** ステータステーブル表示の切り替え
---
## 🆕 v2の新機能
1. **シグナル8 - EMA塗りつぶし色遷移検知**
- 早期トレンド反転識別
- EMA傾きフラット化分析
- EMA収束パターン認識
- ATRを使用した正規化傾き計算
2. **強化されたツールチップドキュメント**
- すべてのシグナルが入力ツールチップに明確に文書化
- シグナル8の説明を含む
3. **改善されたアラートシステム**
- シグナル8 BUY/SELL用の新しいアラート
- EMA塗りつぶし色遷移専用アラート
4. **より優れた視覚的明瞭性**
- EMA塗りつぶしはシグナル8可視化に重要
- すべての塗りつぶしが色遷移している時が見やすい
---
## ⚠️ 免責事項
本インジケータは**教育および情報提供のみを目的**として提供されています。**金融アドバイスではありません**。
取引には多大な損失リスクが伴い、すべての投資家に適しているわけではありません。過去の実績は将来の結果を保証するものではありません。ユーザーは独自の調査を行い、取引決定を行う前に資格のある金融アドバイザーに相談することを検討してください。
作成者は本インジケータを使用して発生したいかなる損失についても責任を負いません。
---
## 📝 クレジット
- **リバースRSIシグナル:** AlgoAlphaのコンセプトに基づく
- **VWCトレンド検知器:** オリジナル実装
- **ICTドンチアンストラクチャー:** ICTコンセプトとドンチアンチャネルからインスピレーション
- **ボリンジャーバンド:** ジョン・ボリンジャー開発
- **EMA分析:** 標準的なテクニカル分析ツール
- **シグナル8 EMA遷移:** Trend Gazer v2のためのオリジナル実装
---
## 📜 ライセンス
このPine Script™コードは、https://mozilla.org/MPL/2.0/ の**Mozilla Public License 2.0**の条項に従います
---
## 🔔 アラート
インジケータには以下の内蔵アラート条件が含まれます:
- BUYシグナル(全8タイプ)
- SELLシグナル(全8タイプ)
- **新機能: シグナル8 EMA塗りつぶし色遷移アラート**
- リバースRSI強気/弱気シフト
- VWC UP/DOWNシグナル
TradingViewのアラート作成メニューからアラートを設定してください。
---
**バージョン:** 2.0
**プラットフォーム:** TradingView Pine Script™
**タイプ:** インジケータ(オーバーレイ)
---
## 🚀 最良の結果を得るためのヒント
1. **シグナルを組み合わせる:** シグナル8を他のシグナルと組み合わせて合致を確認
2. **シグナル8は上位時間軸で:** 15分足〜1時間足で最も信頼性が高い
3. **EMA塗りつぶしを使用:** シグナル8の遷移を見るためEMA塗りつぶしを表示
4. **マーケットストラクチャーを尊重:** 大きな時間軸のトレンドに逆らわない
5. **シグナル8をバックテスト:** 過去データでテストして動作を理解
6. **EMA傾きルックバックを調整:** トレードスタイルと時間軸に合わせて微調整
7. **テーブルを監視:** VWCステータステーブルで迅速なトレンド評価
8. **シグナル8 + ストラクチャー:** シグナル8がストラクチャー変化と一致する時に最良の結果
---
**ハッピートレーディング! 📊💹**
**v2アップグレード: シグナル8でトレンド反転をより早く捕捉!**
ーーー
# Trend Gazer v2 - Multi-Timeframe Trading Indicator
## 📊 Overview
**Trend Gazer v2** is an advanced trading indicator that combines **Volumetric Weighted Cloud (VWC)**, **Reverse RSI Signals**, **ICT Donchian Smart Money Structure**, **Multi-Timeframe Bollinger Bands**, and **EMA Analysis** for comprehensive market analysis.
**7 signal types** with **4 customizable filters**, featuring the **Filter 4 (EMA Fill Transition Period Filter)** which reduces false signals during trend changes by default.
---
## ✨ Key Features
### NEW in v2: Filter 4 - EMA Fill Transition Period Filter (Default ON)
**Filter 4** creates directional bias during EMA fill color transition periods to reduce false signals:
**Operation Logic:**
1. **ALL Blue → Transition Starts (some turn red) → BUY ONLY → ALL Red OR Back to Blue (period ends)**
- Blocks all SELL signals during transition period
2. **ALL Red → Transition Starts (some turn blue) → SELL ONLY → ALL Blue OR Back to Red (period ends)**
- Blocks all BUY signals during transition period
**Termination Conditions:**
- Transition completes (all fills become target color)
- Reverts to original color (transition fails)
**⭐ Key Feature:** While other filters (1,2,3) only apply to Signals 1-5, **Filter 4 applies to ALL signals (S1-7)**. This provides consistent filtering during trend changes and improves win rate.
---
### 1. **Multiple Signal Types (7 Types)**
**Signal 1:** Market Structure is Bullish (Bullish Structure) AND Reverse RSI shifts to Bullish
**Signal 2:** (Market Structure is Bullish OR Reverse RSI is Bullish) AND VWC UP signal detected
**Signal 3:** Reverse RSI is Bullish AND Market Structure changes from Bearish to Bullish (Structure Switch)
**Signal 4:** Market Structure is Bullish AND VWC Signal is in UP state (first time only)
**Signal 5:** Reverse RSI Bullish signal detected AFTER breaking above 15min Lower Bollinger Band
**Signal 6:** First Reverse RSI Bullish signal AFTER breaking above 15min Lower BB OR EMA50 (Bypasses Filter 1,2,3, Filter 4 still applies)
**Signal 7:** Market Structure is Bullish AND price bounces from EMA20 or EMA50, then first BUY detected (Bypasses Filter 1,2,3, Filter 4 still applies)
*(SELL signals follow inverse logic)*
---
### 2. **Advanced Filtering System**
**Filter 1: RSI Direction Filter (Default: ON) - Signals 1-5 Only**
- Only displays BUY when Reverse RSI is Bullish OR Market Structure is Bullish
- Only displays SELL when Reverse RSI is Bearish OR Market Structure is Bearish
- Prevents counter-trend signals in strong directional moves
**Filter 2: EMA Order Filter (Default: ON) - Signals 1-5 Only**
- SELL signals only appear when EMA alignment is confirmed:
- `ema20 > ema50 > ema100 > ema200` (Strong downtrend), OR
- `ema20 < ema50 < ema100 < ema200` (Strong uptrend)
- Reduces false signals during choppy/ranging markets
**Filter 3: Bollinger Band Direction Filter (Default: ON) - Signals 1-5 Only**
- After breaking below 15min Upper BB AND 60min Upper BB → Only SELL signals until touching 15min Lower BB
- After breaking above 15min Lower BB AND 60min Lower BB → Only BUY signals until touching 15min Upper BB
- Creates directional bias zones for high-probability entries
**⭐ Filter 4: EMA Fill Transition Period Filter (Default: ON) - ALL Signals 1-7**
- During ALL EMA fills transitioning blue→red → Show BUY only (block SELL)
- During ALL EMA fills transitioning red→blue → Show SELL only (block BUY)
- Period ends when transition completes OR reverts to original color
- Reduces false signals during trend changes and improves win rate
**Note:** Signals 6, 7 bypass Filters 1,2,3 but Filter 4 still applies.
---
### 3. **Multi-Timeframe Bollinger Bands**
- **15-Minute Bollinger Bands** (Black dotted lines): Short-term volatility zones
- **60-Minute Bollinger Bands** (Black/customizable): Longer-term support/resistance
These bands identify:
- **Overbought/Oversold Conditions**
- **Breakout Confirmations** (Signal 5 & 6)
- **Mean Reversion Opportunities**
---
### 4. **7 Exponential Moving Averages (EMA)**
- **EMA 7, 20, 50, 100, 200, 400, 800**
- Dynamic **EMA Fills** between EMA20-50 and EMA50-200 with color-coded trend bias:
- **Red Fill:** Bearish alignment (ema20 > ema50 > ema200)
- **Blue Fill:** Bullish alignment (ema20 < ema50 < ema200)
- EMAs act as dynamic support/resistance for Signal 7 bounce detection
- **Filter 4 monitors EMA fills** to create directional bias during transitions
---
### 5. **ICT Donchian Smart Money Structure**
- Colors candle borders to visualize market structure:
- **RED Border (Bullish Structure):** Bullish structure (buyers in control)
- **GREEN Border (Bearish Structure):** Bearish structure (sellers in control)
- Based on Donchian channels and pivot-based structure breaks
- Critical for Signal 1, 3, 4, and 7 detection
---
### 6. **Reverse RSI Signals**
- Inverts RSI calculations to derive price levels rather than oscillator values
- **Supertrend on RSI Midline** determines trend shifts:
- **Bullish Shift:** Potential upward momentum
- **Bearish Shift:** Potential downward momentum
- Displayed as semi-transparent labels ("Bullish"/"Bearish") above/below price
---
### 7. **VWC (Volumetric Weighted Cloud) Trend Detector**
- Adaptive volatility-based bands that expand/contract with market conditions
- Provides **UP/DOWN signals** when price enters the bands
- VWC Status Table displays:
- Current trend direction (BULLISH/BEARISH)
- EMA alignment status
- Last displayed signal (BUY/SELL) and bars since signal
---
## 🎯 Trading Strategy
### Recommended Approach
**1. Trend Following (Signals 1, 2, 4)**
- Wait for clear market structure (Bullish or Bearish Structure)
- Enter on confluence of VWC trend + RSI direction + Structure alignment
- Use EMA fills as dynamic stop-loss zones
**2. Reversal Trading (Signals 5, 6, 7, 8)**
- **Signal 5 & 6**: Identify Bollinger Band breakouts and reversals
- **Signal 7**: Look for EMA bounces with structure confirmation
- **Signal 8**: **EARLY TREND REVERSAL** - Enter at the very beginning of trend changes
- These signals bypass certain filters for early entry opportunities
**3. Signal 8 - Early Trend Reversal Strategy (NEW in v2)**
**Best Use Cases:**
- **Higher Timeframes (15m-1H)**: Most reliable for catching major trend reversals
- **Swing Trading**: Perfect for multi-day position entries
- **Confirmation Trading**: Use with other signals for high-confidence entries
**How to Trade Signal 8:**
- **BUY (Blue→Red transition)**:
- Watch for all EMA fills turning from blue to red
- Entry: When Signal 8 BUY label appears
- Stop Loss: Below recent swing low or EMA200
- Take Profit: Target next resistance or use trailing stop with EMA50
- **SELL (Red→Blue transition)**:
- Watch for all EMA fills turning from red to blue
- Entry: When Signal 8 SELL label appears
- Stop Loss: Above recent swing high or EMA200
- Take Profit: Target next support or use trailing stop with EMA50
**Signal 8 Advantages:**
- Catches trend reversals 5-10 bars BEFORE other signals
- Lower risk entry at the start of new trends
- Higher reward potential (entering at trend inception)
**Signal 8 Risks:**
- May produce false signals in choppy/ranging markets
- Best combined with higher timeframe confirmation
- Consider using larger stop losses due to early entry
---
### Risk Management
- Use **EMA20/EMA50** as trailing stop-loss levels
- For Signal 8: Use **EMA200** as major trend stop-loss
- Exit on opposite signal or when price crosses major EMA
- Combine with higher timeframe trend confirmation (60min+ chart)
- Avoid trading when VWC Status Table shows conflicting signals
### Timeframe Recommendations
- **Signal 8 Best Timeframes:** 15min to 1H (for early trend reversal)
- **Other Signals:** 1-minute to 15-minute charts (scalping/day trading)
- **Higher timeframes:** Works on 1H+ but may produce fewer signals
- **Complementary:** Use 4H/Daily chart for overall trend direction
---
## 🔄 Integrated Trading Strategy with MTF OB & FVG Detector
Combining **Trend Gazer v2** with **MTF OB & FVG Detector** creates a powerful trading approach that leverages institutional order flow (OB) and market supply-demand imbalances (FVG) alongside trend momentum.
### Benefits of Integration
**1. Highest Probability Entry Points**
- Trend Gazer BUY/SELL signals + OB/FVG zones = **Highest probability entry points**
- Multi-timeframe OB confluence (5m, 15m, 60m) + Trend Gazer signals = **Institutional + trend alignment**
**2. Precise Entry Price Determination**
- Trend Gazer confirms trend direction and market bias
- OB/FVG zones pinpoint exact entry prices
- Reduces unnecessary risk and maximizes reward ratios
**3. Enhanced Stop Loss Management**
- Use EMA20/50 (Trend Gazer) as trailing stop loss levels
- Set OB zones (MTF OB & FVG) as additional defensive lines
- Multi-layer risk protection
---
### Recommended Integration Strategies
#### Strategy 1: High-Probability Confluence Entry 【MOST RECOMMENDED】
**Setup:**
1. Monitor Trend Gazer v2 for BUY/SELL signals
2. Identify combined OB/FVG zones (3+ timeframes) on MTF OB & FVG Detector
3. Wait for both to align at the same price zone
**Entry Conditions (BUY example):**
- ✅ Trend Gazer: BUY signal triggered (any Signal 1-7)
- ✅ MTF OB & FVG: Price touches Bullish OB zone (especially combined zones)
- ✅ Filter 4 (EMA Transition Period): Blue→Red transition active (BUY-only period)
- ✅ Market Structure: Bullish (red border)
- ✅ High Volume: OB zone volume percentage ≥75%
**Entry:**
- Enter at close of bar when Trend Gazer BUY signal appears within OB zone
- Or enter at open of next bar
**Stop Loss:**
1. **Initial SL**: OB zone lower edge - (5-10 pips/points)
2. **Alternative SL**: Below EMA50 (wider SL, for swing trades)
3. **Tight SL**: Below recent low - (3-5 pips/points) (for scalping)
**Take Profit Targets:**
1. **T1 (50%)**: Next higher timeframe Bearish OB/FVG zone
2. **T2 (30%)**: 60min Bollinger Band upper limit
3. **T3 (20%)**: Trail with EMA20/50, hold until opposite signal
**SELL example follows inverse logic**
---
#### Strategy 2: Precise Reversal Entry 【INTERMEDIATE】
**Best Use Cases:**
- End of strong trends
- Reversals at significant combined OB/FVG zones
- Higher timeframe support/resistance levels
**Entry Conditions (SELL example):**
1. **Higher Timeframe Confirmation:**
- Identify Bearish OB confluence zone on 60min chart
- Price reaches confluence zone
2. **Trend Gazer Signals:**
- **Signal 5**: Break below 15min upper BB + Reverse RSI bearish shift, OR
- **Signal 6**: First RSI bearish signal after breaking 15min upper BB/EMA50, OR
- **Signal 7**: Market Structure bearish + bounce down from EMA20/50
3. **OB/FVG Confirmation:**
- Confirm bounce at 15min or 60min Bearish OB zone
- FVG remains above (price magnet effect)
**Entry:**
- Enter after confirming both Trend Gazer signal + OB zone bounce
- Candlestick pattern confirmation recommended (pin bar, engulfing, etc.)
**Stop Loss:**
- Above OB zone upper edge + 10-15 pips/points
- Or above 60min upper BB
**Take Profit:**
- **T1**: Lower timeframe Bullish OB/FVG zone (unfilled FVG preferred)
- **T2**: 15min lower BB
- **T3**: Until opposite signal or EMA20/50 touch
**BUY example follows inverse logic**
---
#### Strategy 3: Trend Following with OB Support 【BEGINNER-FRIENDLY】
**Simple Approach:**
**BUY Strategy:**
1. **Trend Confirmation (Trend Gazer):**
- EMA fills are red (bullish alignment)
- VWC Status shows BULLISH
- Market Structure is Bullish (red border)
2. **Wait for Pullback:**
- Price retraces to lower timeframe (5m or 15m) Bullish OB zone
- Trend Gazer **Signal 1, 2, or 4** triggers
3. **Entry:**
- Enter when BUY signal appears within OB zone
- Enter at candle body close
4. **Stop Loss:**
- Below OB zone lower edge - 10 pips/points
5. **Take Profit:**
- **Simple**: 2x risk (1:2 R:R)
- **Dynamic**: Until next Bearish OB or opposite signal
**SELL Strategy follows inverse logic**
---
#### Strategy 4: FVG Filling with Trend Gazer Confirmation 【SCALPING】
**For Short-Term Traders:**
**Setup:**
- Identify unfilled FVG (Bullish or Bearish)
- FVG should be away from current price (minimum 20-30 pips/points)
**BUY Example (Bullish FVG below):**
1. **FVG Identification:**
- Unfilled Bullish FVG below current price (Orange box)
- Prefer high-volume FVG (75%+)
2. **Trend Gazer Confirmation:**
- Price approaches FVG
- Market Structure turns Bullish
- **Signal 3, 4, or 7** triggers near FVG zone
3. **Entry:**
- Price enters FVG and Trend Gazer signal confirms bounce from FVG
- Enter at candle body close
4. **Stop Loss:**
- Below FVG lower edge - 5-7 pips/points (tight)
5. **Take Profit:**
- **T1 (70%)**: FVG upper edge (gap fill)
- **T2 (30%)**: Next resistance or opposite signal
**SELL Example (Bearish FVG above) follows inverse logic**
---
### Best Practices for Integrated Usage
**1. Chart Setup:**
- **Main Chart Timeframe**: 5min or 15min
- **Trend Gazer v2**: All signals and filters enabled
- **MTF OB & FVG Detector**: Enable 5m, 15m, 60m; Combine Overlapping OBs = ON
**2. Alert Configuration:**
- Trend Gazer: BUY/SELL signal alerts enabled
- MTF OB & FVG: Bounce alerts + Combined Zone alerts enabled (Min 3 OBs)
- Both alerts firing simultaneously = Highest probability entry
**3. Pre-Entry Checklist:**
- Trend Gazer BUY/SELL signal confirmed
- OB/FVG zone overlaps with price
- Filter 4 supports direction (during transition period)
- Market Structure aligns
- OB/FVG high volume confirmed (70%+ recommended)
- Higher timeframe trend doesn't conflict
- Risk:Reward ratio minimum 1:1.5
**4. Risk Management Rules:**
- Risk per trade: 0.5-1% of account balance
- Concurrent positions: Maximum 2-3 (low-correlation pairs only)
- After consecutive losses: Pause after 3 losses, review strategy
- Daily loss limit: 2-3% of account balance
**5. Situations to Avoid:**
- ❌ Entering with OB/FVG alone, without Trend Gazer signal
- ❌ Immediately before/after major economic releases (volatility spikes)
- ❌ When multiple filters contradict each other
- ❌ OB/FVG zones tested multiple times (weakened)
- ❌ Low liquidity periods (Asian early morning, etc.)
---
### Performance Enhancement Tips
**1. Timeframe Selection:**
- **Scalping**: 1m/3m OB + 5m Trend Gazer signals
- **Day Trading**: 5m/15m OB + 15m Trend Gazer signals
- **Swing Trading**: 15m/60m OB + 60m Trend Gazer signals
**2. Confluence Zone Priority:**
- **Highest**: 60min OB confluence (3+) + Trend Gazer Signal 6 or 7
- **High**: 15min OB confluence + Filter 4 transition period + Signal 1-5
- **Medium**: 5min OB + Market Structure alignment + Signal 1-4
- **Low**: Single timeframe OB + basic signal (require more confirmation)
**3. Backtesting Recommended:**
- Test each strategy on 1-3 months of historical data
- Record win rate, average R:R, maximum drawdown
- Discover optimal combinations for your trading style
**4. Continuous Improvement:**
- Keep trade journal (with screenshots)
- Weekly performance review
- Document effective combination patterns
- Adjust to changing market conditions
---
### Real-World Examples
**Example 1: Perfect Confluence BUY**
```
Situation:
- 15min chart, EUR/USD
- Price touches 60min Bullish OB confluence zone (5m+15m+60m)
- Trend Gazer Signal 6: First RSI bullish signal after 15min lower BB breakout
- Filter 4: EMA fills transitioning blue→red (BUY-only period)
- Market Structure: Turns Bullish (red border)
- OB Volume: 82% (strong buying pressure)
Entry: 1.0850 (OB zone middle)
Stop Loss: 1.0835 (OB zone lower edge - 5 pips)
Take Profit T1: 1.0875 (Next 15min Bearish OB) - Hit
Take Profit T2: 1.0895 (60min upper BB) - Hit
Take Profit T3: 1.0920 (EMA20 trailing) - Closed before opposite signal
Result: +70 pips, Risk 15 pips = 4.67:1 R:R
```
**Example 2: FVG Filling with Reversal Confirmation SELL**
```
Situation:
- 5min chart, GBP/JPY
- Unfilled Bearish FVG above (Aqua box, 15min)
- Price surges to reach FVG
- Trend Gazer Signal 7: Market Structure bearish + downward bounce from EMA50
- Reverse RSI: Bearish shift
- FVG Volume: 78% (strong selling pressure)
Entry: 191.50 (bounce confirmed at FVG upper edge)
Stop Loss: 191.75 (FVG upper edge + 25 pips)
Take Profit T1: 191.00 (FVG lower edge, gap fill) - Hit
Take Profit T2: 190.70 (Next Bullish OB) - Partially hit
Result: +50 pips (weighted average), Risk 25 pips = 2:1 R:R
```
---
### Summary: Why This Integration is Powerful
**Trend Gazer v2's Role:**
- ✅ Trend direction confirmation (VWC, EMA, Structure)
- ✅ Timing signals (7 types of entry opportunities)
- ✅ Multiple filters reduce false signals
- ✅ Dynamic stop loss management (EMA, BB)
**MTF OB & FVG Detector's Role:**
- ✅ Institutional order flow visualization
- ✅ Precise price zone identification (exact entries)
- ✅ High-probability support/resistance levels
- ✅ Volume analysis for zone strength confirmation
**Synergy from Integration:**
- 🎯 **Probability Multiplication**: Each indicator is effective alone, but alignment dramatically increases probability
- 🎯 **Risk Reduction**: More precise stop loss placement minimizes losses
- 🎯 **Reward Maximization**: Optimal entry prices expand profit potential
- 🎯 **Strategy Diversity**: Applicable to trend-following, reversals, scalping, and swing trading
**Recommended Getting Started:**
1. Test Strategy 1 (Confluence Entry) on demo account for 2 weeks
2. Keep trade journal and learn patterns
3. Practice same strategy on small real account (minimum lot)
4. Expand to Strategies 2, 3 as confidence grows
5. Continuously backtest and improve
This integrated approach enables professional-level trading strategies that combine market **supply-demand zones (OB/FVG)** with **trend momentum (Trend Gazer)**.
---
## ⚙️ Input Parameters
### Signal 8 Settings (NEW in v2)
- **Enable Signal 8: EMA Fill Color Transition:** Toggle Signal 8 on/off (Default: OFF)
- **EMA Slope Lookback:** Period for EMA slope calculation (Default: 5, Range: 2-20)
- Lower values: More sensitive, earlier signals
- Higher values: More stable, fewer false signals
### Signal Display Settings
- **Show BUY/SELL Labels:** Toggle main entry signals
- **Show RSI Trend Shift Labels:** Display Bullish/Bearish RSI shifts
- **Label Size:** Small, Normal, Large, Huge
- **Label Position:** On bar or offset by ATR
### Filter Settings
- **Enable RSI Direction Filter:** Filter signals by RSI trend (Default: ON)
- **Enable EMA Order Filter:** Require EMA alignment for SELL signals (Default: ON)
- **Enable BB Direction Filter:** Create directional bias zones after BB breakouts (Default: ON)
### Visual Settings
- **Show Structure Candles:** Color candle borders by market structure
- **Show EMAs:** Display 7 exponential moving averages
- **Show EMA Fills:** Display colored fills between key EMAs (critical for Signal 8)
- **Show 15min Bollinger Bands:** Display short-term BB
- **Show 60min Bollinger Bands:** Display longer-term BB
- **VWC Status Table:** Toggle status table display
---
## 🆕 What's New in v2
1. **Signal 8 - EMA Fill Color Transition Detection**
- Early trend reversal identification
- EMA slope flattening analysis
- EMA convergence pattern recognition
- Normalized slope calculation using ATR
2. **Enhanced Tooltip Documentation**
- All signals now clearly documented in input tooltips
- Signal 8 explanation included
3. **Improved Alert System**
- New alerts for Signal 8 BUY/SELL
- Dedicated alert for EMA fill color transitions
4. **Better Visual Clarity**
- EMA fills now critical for Signal 8 visualization
- Easy to see when all fills are transitioning colors
---
## ⚠️ Disclaimer
This indicator is provided for **educational and informational purposes only**. It is **not financial advice**.
Trading involves substantial risk of loss and is not suitable for all investors. Past performance does not guarantee future results. Users should conduct their own research and consider consulting with a qualified financial advisor before making any trading decisions.
The author is not responsible for any losses incurred using this indicator.
---
## 📝 Credits
- **Reverse RSI Signals:** Based on concepts by AlgoAlpha
- **VWC Trend Detector:** Original implementation
- **ICT Donchian Structure:** Inspired by ICT concepts and Donchian channels
- **Bollinger Bands:** Developed by John Bollinger
- **EMA Analysis:** Standard technical analysis tool
- **Signal 8 EMA Transition:** Original implementation for Trend Gazer v2
---
## 📜 License
This Pine Script™ code is subject to the terms of the **Mozilla Public License 2.0** at mozilla.org
---
## 🔔 Alerts
The indicator includes built-in alert conditions for:
- BUY signals (all 8 types)
- SELL signals (all 8 types)
- **NEW: Signal 8 EMA Fill Color Transition alerts**
- Reverse RSI Bullish/Bearish shifts
- VWC UP/DOWN signals
Configure alerts via TradingView's alert creation menu.
---
**Version:** 2.0
**Platform:** TradingView Pine Script™
**Type:** Indicator (Overlay)
---
## 🚀 Tips for Best Results
1. **Combine Signals:** Use Signal 8 with other signals for confluence
2. **Signal 8 on Higher TF:** Most reliable on 15m-1H timeframes
3. **Use EMA Fills:** Keep EMA fills visible to see Signal 8 transitions
4. **Respect Market Structure:** Don't fight the trend on larger timeframes
5. **Backtest Signal 8:** Test on historical data to understand its behavior
6. **Adjust EMA Slope Lookback:** Fine-tune for your trading style and timeframe
7. **Watch the Table:** The VWC Status Table provides quick trend assessment
8. **Signal 8 + Structure:** Best results when Signal 8 aligns with Structure change
---
**Happy Trading! 📊💹**
**v2 Upgrade: Catch trend reversals EARLIER with Signal 8!**

Prometheus Polarized Fractal Efficiency (PFE)This indicator uses market data to calculate Polarized Fractal Efficiency (PFE) on an asset, so traders can have a better idea of which direction it may go.
Users can control the lookback length for the fractal calculation, the lookback length for the Exponential Moving Average (EMA), and whether or not to display lines at the -50 and 50 level, or -25 and 25 level.
Polarized Fractal Efficiency:
The Polarized Fractal Efficiency (PFE) indicator is a value between -100 and 100 with 0 as a midpoint.
A PFE above 0 indicates the asset may trend higher, a PFE below 0 indicates the asset may trend lower.
There are many ways to trade with PFE, the intuitive trend riding as described above, or reversals.
Even when the PFE is above 0, if it gets high enough, it may also be an indication of a reversal. A PFE of 90 - 100, or -100 - -90, may indicate price is ready to revert the other direction. Furthermore, traders already in a position may look to breaks of other levels to be their take profit or stop out spot.
Calculation:
Pi = 100 x (Price - Price )2 + N2 / Summation, j= 0, to N-2 (Price - Price )2 + 1
If Close < Close Pi = -Pi
PFEi = EMA(Pi, M)
Where:
N = period of indicator
M = smoothing period
Citation: www.investopedia.com
Scenarios:
Inputs are (9, 5) and every display option is on.
Trend example
Step 1: A short trade appears as PFE crosses below -25. We reach a safe take profit as PFE crosses below -50. Traders can use these levels to exit as well as enter.
Step 2: On the cross above 25 there is a safe long. As the PFE value breaks 0 a safe, early take profit could be appropriate for this trade. No guarantee we would see 50.
Step 3: Long scenario at break of 25, straight to 50. Simple, straightforward setup.
Step 4: This long results in a stop loss. Once again entry as PFE crosses 25, but as we cross the 0 line it is for a loss.
Step 5: The last trade in this example is reminiscent of step 3. This is a short trade entry at break of 25 and exit at break of 50.
Traders have liberty to use the PFE value to determine spots to enter and exit trades, long or short. 25 and 50 were chosen arbitrarily, values like 10 and 60 may work as well, we encourage traders to use their own discretion along with tools.
Reversal example
Step 1: PFE is around -100, crossing below it at one point! Strong zone for a potential reversal.
Step 2: PFE crosses above 25 adding conviction.
Step 3: Option to exit at 70.
Step 4: Option to exit at 90.
There is no “one size fits all method”, this approach may be more intuitive for some users and is just as feasible as the first.
Longer trend example
Step 1: Using -50 and 50 this time instead of -25 and 25 to be safer on our entries we see a short here. Was a good entry and as the value gets closer to -70 we can safely close.
Step 2: On this candle we see a long for the break of 50. On the next candle we break the 0 line, but because of our safe entry at 50, we could hold this and only stop out at a break of -25. We get close but stay in it and close at 70.
Step 3: Break of 50 for a long once again. This time the break of 0 line occurs as we are in profit, not letting a green trade go red is a golden rule of trading, so an early exit here.
Step 4: Same at step 2, break of 50 to long and stay in it, not stopping out at break of 0 line. The PFE value eventually reaches 70 and there is a good exit.
Quicker Reversal example
Step 1: Notice a close with PFE below -90, enter long for the reversal. Then close for profit when the PFE crosses above 70.
Step 2: When the PFE breaks above 90 we have a short entry. Like the long closing it when it crosses below -70.
Step 3: This step is the same setup as step 2. As PFE breaks above 90 we have a short entry. Closing it when it crosses below -70.
Recap:
Described above are 4 different examples with many different trades. Both trend and reversal trades. The PFE value is an indicator that can be used by traders in many different ways and Prometheus encourages traders to use their own discretion along with tools and not follow indicators blindly.
Options:
Users can control the input for the lookback of the indicator. The default is 9.
The smoothing factor for the EMA is also changeable, default is 5.
Users have options to display lines at -50, -25, 25, and 50.

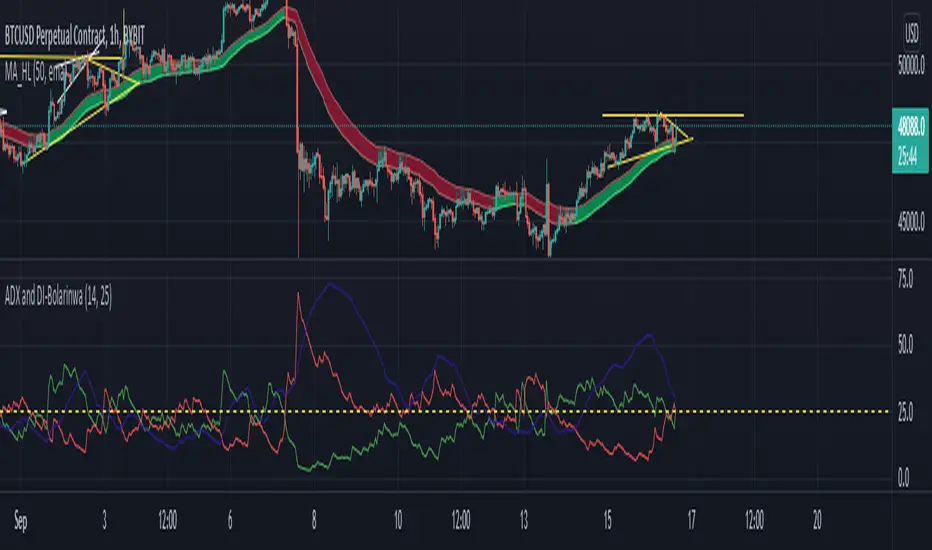
ADX and DI-BolarinwaThe Average Directional Movement Index (ADX) is a technical indicator that measures the strength of a trend. While the indicator itself doesn’t give an insight into the direction of the trend, the Directional Movement lines can be used to determine if the market moves up or down.
The ADX can return a value between 0 and 100. The usual threshold for a market to be considered as trending by the ADX is a value of 25 or above. Values between 25 and 50 signal a trending market, between 50 and 75 very strong trends and between 75 and 100 extremely strong trends.
The ADX Crossover Trading Strategy
A popular trading strategy to trade on the ADX is based on a crossover of the directional movement lines (+DI and -DI) which was developed directly by the indicator’s creator Mr. Wilder.
The trading strategy states that the first condition for a trade setup is that the ADX has a value of 25 or above, which indicates a trending market.
A buy order is triggered when +DI crosses above -DI, i.e. the underlying trend is an uptrend, while a sell signal is triggered when -DI crosses above +DI, i.e. the underlying trend is a downtrend.
Stop-losses are placed at the low of the current trading day, and the trade setup remains valid even if the directional movement lines cross again after the trade signal. Only a break of the current trading day’s low would lead to the trade setup becoming invalid.
If the ADX remains above 25 or rises even higher, indicating that the strength of the underlying trend increases, then traders can put a trailing stop on the trade.
The following chart shows an example of the ADX crossover strategy on the daily EUR/USD pair.
ADX Crossover Strategy
The first cross of -DI above +DI didn’t send a sell signal because the ADX was below 25. The sell signal came with ADX crossing above 25, while the -DI was still above +DI. On the chart, the SL was put just above the day’s high.
The second signal was a buy signal, with the cross of +DI above -DI and the ADX above 25, signaling a strong trend. The stop-loss is placed just below the day’s low, indicated by the dotted line on the chart.
Finally, the third sell signal came with the cross of -DI above -DI and the ADX above 25. Again, the stop-loss is placed just above the day’s high.
While the ADX crossover strategy can also be applied to lower timeframes, you need to be aware that the increased market noise may create more false signals than on the higher timeframes. The following chart is a 5-minute chart with buy and sell signals based on the crossover strategy. Notice that we placed the stop-losses slightly different than in the previous example. In this case, stop-losses have been placed at the recent highs and lows of the price.
ADX Trading Graph
The first buy signal came with +DI crossing above -DI and ADX above 25. In the middle of the chart, you can notice the crosses of the directional movement lines (+DI and -DI) while the ADX was below 25. As ADX needs to be above 25, those crosses are not used as entry triggers based on the ADX crossover strategy.
After that we received a sell signal with -DI crossing above +DI and ADX above 25, which is followed by a buy signal when +DI crossed above -DI.
Using ADX for Trade Confirmations
Beside the ADX crossover strategy which is based on the crosses of +DI and -DI, traders can also use the ADX indicator to supplement other trading strategies. For example, you might want to use a trend-following strategy when ADX shows a strong trend (value above 25), or a trading strategy that is more suited for ranging markets in times when the ADX shows an absence of trends (value below 25).
Before You Trade
The Average Directional Movement Index is a versatile technical indicator that can be used as a stand-alone trading strategy, or in combination with other trading strategies. The ADX crossover strategy is based on the crossover of the directional movement lines (+DI and -DI) and an ADX reading of above 25. While it can be used across all timeframes, it usually returns the best results on higher ones.
As the ADX measures the strength of the underlying trend, trend-following traders can use it to filter flat and ranging markets and avoid trading during those times.
Directional Movement Index (DMI) + AlertsThis is a Study with associated visual indicators and Bullish/Bearish Alerts for Directional Movement (DMI). It consists of an Average Directional Index (ADX), Plus Directional Indicator (+DI) and Minus Directional Indicator (-DI).
Published by J. Welles Wilder in 1978 for use with currencies and commodities which are typically more volatile than stocks and have stronger trends.
Development Notes
---------------------------
This indicator, and most of the descriptions below, were derived largely from the TradingView reference manual. Feedback and suggestions for improvement are more than welcome, as well are recommended Input settings and best practices for use.
tradingview.com/chart/?solution=43000502250
Strategy Description
---------------------------
ADX defines whether or not there is a trend present; +DI and -DI compliment the ADX by taking direction into account. An ADX above 25 indicates a strong trend, and a Bullish alert is subsequently triggered when +DI is above -DI and a Bearish alert when -DI is above +DI.
Note that the Bullish or Bearish crossover alert will only trigger if ADX is simultaneously above 25 during the crossover event. If ADX later rises to 25 and +DI is still greater than -DI, or -DI greater than +DI, then a delayed alert will not trigger by design.
Basic Use
---------------------------
Acceptable DMI values are up to the trader's interpretation and may change depending on the financial instrument being examined. Recommend not changing any default values without being first familiar with their purpose and impact on the indicator at large.
Confidence in price action and trend is higher when two or more indicators are in agreement -- therefore we recommend not using this indicator by itself to determine entry or exit trade opportunities.
Recommend also choosing 'Once Per Bar Close' when creating alerts.
Inputs
---------------------------
ADX Smoothing - the time period to be used in calculating the ADX which has a smoothing component (14 is the Default).
DI Length - the time period to be used in calculating the DI (14 is the Default).
Key Level - any trade with the ADX above the key level is a strong indicator that it is trending (23 to 25 is the suggested setting).
Sensitivity - an incremental variable to test whether the past n candles are in the same bullish or bearish state before triggering a delayed crossover alert (3 is the Default). Filter out some noise and reduces active alerts.
Show ADX Option - two visual styles are provided for user preference, a visible ADX line or a background overlay (green or red when ADX is above the key level, for bullish or bearish, and gray when below).
Color Candles - an option to transpose the bullish and bearish crossovers to the main candle bars. Can be turned off in the Style Tab by deselecting 'Bar Colors'. Dark blue is bullish, dark purple is bearish, and the black inner color is neutral. Note that the outer red and green border will still be distinguished by whether each individual candle is bearish or bullish during the specified timeframe.
Indicator Visuals
---------------------------
Bullish or Bearish plot based on DMI strategy (ADX and +/-DI values).
Visual cues are intended to improve analysis and decrease interpretation time during trading, as well as to aid in understanding the purpose of this study and how its inclusion can benefit a comprehensive trading strategy.
Trend Strength
---------------------------
To analyze trend strength, the focus should be on the ADX line and not the +DI or -DI lines. An ADX reading above 25 indicates a strong trend, while a reading below 20 indicates a weak or non-existent trend. A reading between those two values would be considered indeterminable. Though what is truly a strong trend or a weak trend depends on the financial instrument being examined; historical analysis can assist in determining appropriate values.
Bullish DI Cross
---------------------------
1. ADX must be over 25 (strong trend) (value is determined by the trader)
2. +DI cross above -DI
3. Set Stop Loss at the current day's low (any +DI cross-backs below -DI should be ignored)
4. Set trailing stop if ADX strengthens (i.e., signal rises)
Bearish DI Cross
---------------------------
1. ADX must be over 25 (strong trend) (value is determined by the trader)
2. -DI cross above +DI
3. Set Stop Loss at the current day's high (any -DI cross-backs below +DI should be ignored)
4. Set trailing stop if ADX strengthens (i.e., signal rises)
Disclaimer
---------------------------
This post and the script are not intended to provide any financial advice. Trade at your own risk.
No known repainting.
Version 1.1
-------------------------
- Added multi-timeframe resolution using PineCoders secure security function to eliminate repainting.
- Cleaned up option for selecting ADX view; and added a colored line as a choice, based on same bullish, bearish, or neutral colors as the background.
- Added exit crossover indicator to aid in an overall strategy development. This ability pairs better with my CHOP Zone Entry Strategy which relies on DMI Exits. Note that exit conditions don't employ the sensitivity variable. Green labels are for Bullish exits and red are for Bearish.
-- Exit condition is triggered if in an active Bullish or Bearish position and ADX drops below 25, Or if either the -DI crosses above +DI (for previously Bullish) or +DI crosses above -DI (for previously Bearish).
- Added reverse position determination. Triggers when a Bullish entry occurs on the same candle as a Bearish exit, or vice versa. Green labels are for Bullish reverses and red are for Bearish.
- Added selectable option to choose visible labels -- Bearish, Bullish, Both, Exits, Reverses, or All.
-- Note that a reverse label will only show if the opposing entry and exit labels are set to show, otherwise the reverse will revert to the appropriate entry or exit on the chart.
- Added alerts to account for new conditions.
-- Note that alerts for crossovers, exits, and reverses will only be triggered if the associated labels are selected to be shown (i.e., what you choose to see on the chart is what you will be alerted to).
Version 1.2
-------------------------
- Changed exit condition to be decided on by whether ADX is below 25 and on a +/-DI crossover. Versus being either or. The previous version had too many false triggers. This variety can now show multiple Bullish or Bearish alerts before an Exit condition too. I'm tempted to simply make this condition based on ADX, and not DI … thoughts? See lines 138 and 139.
- Updated the Background view to have deeper shades of colors dependent upon the ADX trend strength.
- Added an Oscillator view for the ADX and momentum computations to color the histogram by trend. DI lines are hidden.
-- If ADX is Bullish, then the oscillator is colored light green in an uptrend and dark green in a downtrend; if Bearish, then its light red in an uptrend and dark redin a downtrend; if adx is below key level, then it is light gray in a downtrend and dark grey in the uptrend.
- Added option to Hide ADX in case only the Directional lines are desired. This could be useful if you would like to have the ADX oscillator in one panel and +/-DI crossovers in another.
- Added a Columnar view for the ADX. DI lines are hidden. This view is really simple and compact, with the trend strength still easily understood. Colors are the same as for the oscillator -- the deeper the shade of green or red, then the higher the ADX trend strength level.
- Added a Trend Strength label.
ADX Trend Strength Trade (Y/N) Setup Types
0 to 10 = Barely Breathing N N/A
10 to 20 = Weak Trend Y Range/Pre-Breakout
20 to 30 = Potentially Starting to Trend Y Early Stage Trend
30 to 50 = Strong Trend Y Ride the Wave
50 to 75 = Very Strong Trend N Exhaustion
75 to 100 = Extremely Strong Trend N N/A
Version 1.3
-------------------------
Updated to Pine Script v5 to resolve errors from the deprecated v4 version.
This is a reissue of a previously published script that was hidden due to a v4 compatibility issue.
'https://www.tradingview.com/script/9OoEHrv5-Directional-Movement-Index-DMI-Alerts/'

Hidden Impulse═══════════════════════════════════════════════════════════════════
HIDDEN IMPULSE - Multi-Timeframe Momentum Detection System
═══════════════════════════════════════════════════════════════════
OVERVIEW
Hidden Impulse is an advanced momentum oscillator that combines the Schaff Trend Cycle (STC) and Force Index into a comprehensive multi-timeframe trading system. Unlike standard implementations of these indicators, this script introduces three distinct trading setups with specific entry conditions, multi-timeframe confirmation, and trend filtering.
═══════════════════════════════════════════════════════════════════
ORIGINALITY & KEY FEATURES
This indicator is original in the following ways:
1. DUAL-TIMEFRAME STC ANALYSIS
Standard STC implementations work on a single timeframe. This script
simultaneously analyzes STC on both your trading timeframe and a higher
timeframe, providing trend context and filtering out low-probability signals.
2. FORCE INDEX INTEGRATION
The script combines STC with Force Index (volume-weighted price momentum)
to confirm the strength behind price moves. This combination helps identify
when momentum shifts are backed by genuine buying/selling pressure.
3. THREE DISTINCT TRADING SETUPS
Rather than generic overbought/oversold signals, the indicator provides
three specific, rule-based setups:
- Setup A: Classic trend-following entries with multi-timeframe confirmation
- Setup B: Divergence-based reversal entries (highest probability)
- Setup C: Mean-reversion bounce trades at extreme levels
4. INTELLIGENT FILTERING
All signals are filtered through:
- 50 EMA trend direction (prevents counter-trend trades)
- Higher timeframe STC alignment (ensures macro trend agreement)
- Force Index confirmation (validates volume support)
═══════════════════════════════════════════════════════════════════
HOW IT WORKS - TECHNICAL EXPLANATION
SCHAFF TREND CYCLE (STC) CALCULATION:
The STC is a cyclical oscillator that combines MACD concepts with stochastic
smoothing to create earlier and smoother trend signals.
Step 1: Calculate MACD
- Fast MA = EMA(close, Length1) — default 23
- Slow MA = EMA(close, Length2) — default 50
- MACD Line = Fast MA - Slow MA
Step 2: First Stochastic Smoothing
- Apply stochastic calculation to MACD
- Stoch1 = 100 × (MACD - Lowest(MACD, Smoothing)) / (Highest(MACD, Smoothing) - Lowest(MACD, Smoothing))
- Smooth result with EMA(Stoch1, Smoothing) — default 10
Step 3: Second Stochastic Smoothing
- Apply stochastic calculation again to the smoothed stochastic
- This creates the final STC value between 0-100
The dual stochastic smoothing makes STC more responsive than MACD while
being smoother than traditional stochastics.
FORCE INDEX CALCULATION:
Force Index measures the power behind price movements by incorporating volume:
Force Raw = (Close - Close ) × Volume
Force Index = EMA(Force Raw, Period) — default 13
Interpretation:
- Positive Force Index = Buying pressure (bulls in control)
- Negative Force Index = Selling pressure (bears in control)
- Force Index crossing zero = Momentum shift
- Divergences with price = Weakening momentum (reversal signal)
TREND FILTER:
A 50-period EMA serves as the trend filter:
- Price above EMA50 = Uptrend → Only LONG signals allowed
- Price below EMA50 = Downtrend → Only SHORT signals allowed
This prevents counter-trend trading which accounts for most losing trades.
═══════════════════════════════════════════════════════════════════
THE THREE TRADING SETUPS - DETAILED
SETUP A: CLASSIC MOMENTUM ENTRY
Concept: Enter when STC exits oversold/overbought zones with trend confirmation
LONG CONDITIONS:
1. Higher timeframe STC > 25 (macro trend is up)
2. Primary timeframe STC crosses above 25 (momentum turning up)
3. Force Index crosses above 0 OR already positive (volume confirms)
4. Price above 50 EMA (local trend is up)
SHORT CONDITIONS:
1. Higher timeframe STC < 75 (macro trend is down)
2. Primary timeframe STC crosses below 75 (momentum turning down)
3. Force Index crosses below 0 OR already negative (volume confirms)
4. Price below 50 EMA (local trend is down)
Best for: Trending markets, continuation trades
Win rate: Moderate (60-65%)
Risk/Reward: 1:2 to 1:3
───────────────────────────────────────────────────────────────────
SETUP B: DIVERGENCE REVERSAL (HIGHEST PROBABILITY)
Concept: Identify exhaustion points where price makes new extremes but
momentum (Force Index) fails to confirm
BULLISH DIVERGENCE:
1. Price makes a lower low (LL) over 10 bars
2. Force Index makes a higher low (HL) — refuses to follow price down
3. STC is below 25 (oversold condition)
Trigger: STC starts rising AND Force Index crosses above zero
BEARISH DIVERGENCE:
1. Price makes a higher high (HH) over 10 bars
2. Force Index makes a lower high (LH) — refuses to follow price up
3. STC is above 75 (overbought condition)
Trigger: STC starts falling AND Force Index crosses below zero
Why this works: Divergences signal that the current trend is losing steam.
When volume (Force Index) doesn't confirm new price extremes, a reversal
is likely.
Best for: Reversal trading, range-bound markets
Win rate: High (70-75%)
Risk/Reward: 1:3 to 1:5
───────────────────────────────────────────────────────────────────
SETUP C: QUICK BOUNCE AT EXTREMES
Concept: Catch rapid mean-reversion moves when price touches EMA50 in
extreme STC zones
LONG CONDITIONS:
1. Price touches 50 EMA from above (pullback in uptrend)
2. STC < 15 (extreme oversold)
3. Force Index > 0 (buyers stepping in)
SHORT CONDITIONS:
1. Price touches 50 EMA from below (pullback in downtrend)
2. STC > 85 (extreme overbought)
3. Force Index < 0 (sellers stepping in)
Best for: Scalping, quick mean-reversion trades
Win rate: Moderate (55-60%)
Risk/Reward: 1:1 to 1:2
Note: Use tighter stops and quick profit-taking
═══════════════════════════════════════════════════════════════════
HOW TO USE THE INDICATOR
STEP 1: CONFIGURE TIMEFRAMES
Primary Timeframe (STC - Primary Timeframe):
- Leave empty to use your current chart timeframe
- This is where you'll take trades
Higher Timeframe (STC - Higher Timeframe):
- Default: 30 minutes
- Recommended ratios:
* 5min chart → 30min higher TF
* 15min chart → 1H higher TF
* 1H chart → 4H higher TF
* Daily chart → Weekly higher TF
───────────────────────────────────────────────────────────────────
STEP 2: ADJUST STC PARAMETERS FOR YOUR MARKET
Default (23/50/10) works well for stocks and forex, but adjust for:
CRYPTO (volatile):
- Length 1: 15
- Length 2: 35
- Smoothing: 8
(Faster response for rapid price movements)
STOCKS (standard):
- Length 1: 23
- Length 2: 50
- Smoothing: 10
(Balanced settings)
FOREX MAJORS (slower):
- Length 1: 30
- Length 2: 60
- Smoothing: 12
(Filters out noise in 24/7 markets)
───────────────────────────────────────────────────────────────────
STEP 3: ENABLE YOUR PREFERRED SETUPS
Toggle setups based on your trading style:
Conservative Trader:
✓ Setup B (Divergence) — highest win rate
✗ Setup A (Classic) — only in strong trends
✗ Setup C (Bounce) — too aggressive
Trend Trader:
✓ Setup A (Classic) — primary signals
✓ Setup B (Divergence) — for entries on pullbacks
✗ Setup C (Bounce) — not suitable for trending
Scalper:
✓ Setup C (Bounce) — quick in-and-out
✓ Setup B (Divergence) — high probability scalps
✗ Setup A (Classic) — too slow
───────────────────────────────────────────────────────────────────
STEP 4: READ THE SIGNALS
ON THE CHART:
Labels appear when conditions are met:
Green labels:
- "LONG A" — Setup A long entry
- "LONG B DIV" — Setup B divergence long (best signal)
- "LONG C" — Setup C bounce long
Red labels:
- "SHORT A" — Setup A short entry
- "SHORT B DIV" — Setup B divergence short (best signal)
- "SHORT C" — Setup C bounce short
IN THE INDICATOR PANEL (bottom):
- Blue line = Primary timeframe STC
- Orange dots = Higher timeframe STC (optional)
- Green/Red bars = Force Index histogram
- Dashed lines at 25/75 = Entry/Exit zones
- Background shading = Oversold (green) / Overbought (red)
INFO TABLE (top-right corner):
Shows real-time status:
- STC values for both timeframes
- Force Index direction
- Price position vs EMA
- Current trend direction
- Active signal type
═══════════════════════════════════════════════════════════════════
TRADING STRATEGY & RISK MANAGEMENT
ENTRY RULES:
Priority ranking (best to worst):
1st: Setup B (Divergence) — wait for these
2nd: Setup A (Classic) — in confirmed trends only
3rd: Setup C (Bounce) — scalping only
Confirmation checklist before entry:
☑ Signal label appears on chart
☑ TREND in info table matches signal direction
☑ Higher timeframe STC aligned (check orange dots or table)
☑ Force Index confirming (check histogram color)
───────────────────────────────────────────────────────────────────
STOP LOSS PLACEMENT:
Setup A (Classic):
- LONG: Below recent swing low
- SHORT: Above recent swing high
- Typical: 1-2 ATR distance
Setup B (Divergence):
- LONG: Below the divergence low
- SHORT: Above the divergence high
- Typical: 0.5-1.5 ATR distance
Setup C (Bounce):
- LONG: 5-10 pips below EMA50
- SHORT: 5-10 pips above EMA50
- Typical: 0.3-0.8 ATR distance
───────────────────────────────────────────────────────────────────
TAKE PROFIT TARGETS:
Conservative approach:
- Exit when STC reaches opposite level
- LONG: Exit when STC > 75
- SHORT: Exit when STC < 25
Aggressive approach:
- Hold until opposite signal appears
- Trail stop as STC moves in your favor
Partial profits:
- Take 50% at 1:2 risk/reward
- Let remaining 50% run to target
───────────────────────────────────────────────────────────────────
WHAT TO AVOID:
❌ Trading Setup A in sideways/choppy markets
→ Wait for clear trend or use Setup B only
❌ Ignoring higher timeframe STC
→ Always check orange dots align with your direction
❌ Taking signals against the major trend
→ If weekly trend is down, be cautious with longs
❌ Overtrading Setup C
→ Maximum 2-3 bounce trades per session
❌ Trading during low volume periods
→ Force Index becomes unreliable
═══════════════════════════════════════════════════════════════════
ALERTS CONFIGURATION
The indicator includes 8 alert types:
Individual setup alerts:
- "Setup A - LONG" / "Setup A - SHORT"
- "Setup B - DIV LONG" / "Setup B - DIV SHORT" ⭐ recommended
- "Setup C - BOUNCE LONG" / "Setup C - BOUNCE SHORT"
Combined alerts:
- "ANY LONG" — fires on any long signal
- "ANY SHORT" — fires on any short signal
Recommended alert setup:
- Create "Setup B - DIV LONG" and "Setup B - DIV SHORT" alerts
- These are the highest probability signals
- Set "Once Per Bar Close" to avoid false alerts
═══════════════════════════════════════════════════════════════════
VISUALIZATION SETTINGS
Show Labels on Chart:
Toggle on/off the signal labels (green/red)
Disable for cleaner chart once you're familiar with the indicator
Show Higher TF STC:
Toggle the orange dots showing higher timeframe STC
Useful for visual confirmation of multi-timeframe alignment
Info Panel:
Cannot be disabled — always shows current status
Positioned top-right to avoid chart interference
═══════════════════════════════════════════════════════════════════
EXAMPLE TRADE WALKTHROUGH
SETUP B DIVERGENCE LONG EXAMPLE:
1. Market Context:
- Price in downtrend, below 50 EMA
- Multiple lower lows forming
- STC below 25 (oversold)
2. Divergence Formation:
- Price makes new low at $45.20
- Force Index refuses to make new low (higher low forms)
- This indicates selling pressure weakening
3. Signal Trigger:
- STC starts turning up
- Force Index crosses above zero
- Label appears: "LONG B DIV"
4. Trade Execution:
- Entry: $45.50 (current price at signal)
- Stop Loss: $44.80 (below divergence low)
- Target 1: $47.90 (STC reaches 75) — risk/reward 1:3.4
- Target 2: Opposite signal or trail stop
5. Trade Management:
- Price rallies to $47.20
- STC reaches 68 (approaching target zone)
- Take 50% profit, move stop to breakeven
- Exit remaining at $48.10 when STC crosses 75
Result: 3.7R gain
═══════════════════════════════════════════════════════════════════
ADVANCED TIPS
1. MULTI-TIMEFRAME CONFLUENCE
For highest probability trades, wait for:
- Primary TF signal
- Higher TF STC aligned (>25 for longs, <75 for shorts)
- Even higher TF trend in same direction (manual check)
2. VOLUME CONFIRMATION
Watch the Force Index histogram:
- Increasing bar size = Strengthening momentum
- Decreasing bar size = Weakening momentum
- Use this to gauge signal strength
3. AVOID THESE MARKET CONDITIONS
- Major news events (Force Index becomes erratic)
- Market open first 30 minutes (volatility spikes)
- Low liquidity instruments (Force Index unreliable)
- Extreme trending days (wait for pullbacks)
4. COMBINE WITH SUPPORT/RESISTANCE
Best signals occur near:
- Key horizontal levels
- Fibonacci retracements
- Previous day's high/low
- Psychological round numbers
5. SESSION AWARENESS
- Asia session: Use lower timeframes, Setup C works well
- London session: Setup A and B both effective
- New York session: All setups work, highest volume
═══════════════════════════════════════════════════════════════════
INDICATOR WINDOWS LAYOUT
MAIN CHART:
- Price action
- 50 EMA (green/red)
- Signal labels
- Info panel
INDICATOR WINDOW:
- STC oscillator (blue line, 0-100 scale)
- Higher TF STC (orange dots, optional)
- Force Index histogram (green/red bars)
- Reference levels (25, 50, 75)
- Background zones (green oversold, red overbought)
═══════════════════════════════════════════════════════════════════
PERFORMANCE OPTIMIZATION
For best results:
Backtesting:
- Test on your specific instrument and timeframe
- Adjust STC parameters if win rate < 55%
- Record which setup works best for your market
Position Sizing:
- Risk 1-2% per trade
- Setup B can use 2% risk (higher win rate)
- Setup C should use 1% risk (lower win rate)
Trade Frequency:
- Setup B: 2-5 signals per week (be patient)
- Setup A: 5-10 signals per week
- Setup C: 10+ signals per week (scalping)
═══════════════════════════════════════════════════════════════════
CREDITS & REFERENCES
This indicator builds upon established technical analysis concepts:
Schaff Trend Cycle:
- Developed by Doug Schaff (1996)
- Original concept published in Technical Analysis of Stocks & Commodities
- Implementation based on standard STC formula
Force Index:
- Developed by Dr. Alexander Elder
- Described in "Trading for a Living" (1993)
- Classic volume-momentum indicator
The multi-timeframe integration, three-setup system, and specific
entry conditions are original contributions of this indicator.
═══════════════════════════════════════════════════════════════════
DISCLAIMER
This indicator is a technical analysis tool and does not guarantee profits.
Past performance is not indicative of future results. Always:
- Use proper risk management
- Test on demo account first
- Combine with fundamental analysis
- Never risk more than you can afford to lose
═══════════════════════════════════════════════════════════════════
SUPPORT & QUESTIONS
If you find this indicator helpful, please:
- Leave a like and comment
- Share your feedback and results
- Report any bugs or issues
For questions about usage or optimization for specific markets,
feel free to comment below.
═════════════════════════════════════════════════════════════

Langlands-Operadic Möbius Vortex (LOMV)Langlands-Operadic Möbius Vortex (LOMV)
Where Pure Mathematics Meets Market Reality
A Revolutionary Synthesis of Number Theory, Category Theory, and Market Dynamics
🎓 THEORETICAL FOUNDATION
The Langlands-Operadic Möbius Vortex represents a groundbreaking fusion of three profound mathematical frameworks that have never before been combined for market analysis:
The Langlands Program: Harmonic Analysis in Markets
Developed by Robert Langlands (Fields Medal recipient), the Langlands Program creates bridges between number theory, algebraic geometry, and harmonic analysis. In our indicator:
L-Function Implementation:
- Utilizes the Möbius function μ(n) for weighted price analysis
- Applies Riemann zeta function convergence principles
- Calculates quantum harmonic resonance between -2 and +2
- Measures deep mathematical patterns invisible to traditional analysis
The L-Function core calculation employs:
L_sum = Σ(return_val × μ(n) × n^(-s))
Where s is the critical strip parameter (0.5-2.5), controlling mathematical precision and signal smoothness.
Operadic Composition Theory: Multi-Strategy Democracy
Category theory and operads provide the mathematical framework for composing multiple trading strategies into a unified signal. This isn't simple averaging - it's mathematical composition using:
Strategy Composition Arity (2-5 strategies):
- Momentum analysis via RSI transformation
- Mean reversion through Bollinger Band mathematics
- Order Flow Polarity Index (revolutionary T3-smoothed volume analysis)
- Trend detection using Directional Movement
- Higher timeframe momentum confirmation
Agreement Threshold System: Democratic voting where strategies must reach consensus before signal generation. This prevents false signals during market uncertainty.
Möbius Function: Number Theory in Action
The Möbius function μ(n) forms the mathematical backbone:
- μ(n) = 1 if n is a square-free positive integer with even number of prime factors
- μ(n) = -1 if n is a square-free positive integer with odd number of prime factors
- μ(n) = 0 if n has a squared prime factor
This creates oscillating weights that reveal hidden market periodicities and harmonic structures.
🔧 COMPREHENSIVE INPUT SYSTEM
Langlands Program Parameters
Modular Level N (5-50, default 30):
Primary lookback for quantum harmonic analysis. Optimized by timeframe:
- Scalping (1-5min): 15-25
- Day Trading (15min-1H): 25-35
- Swing Trading (4H-1D): 35-50
- Asset-specific: Crypto 15-25, Stocks 30-40, Forex 35-45
L-Function Critical Strip (0.5-2.5, default 1.5):
Controls Riemann zeta convergence precision:
- Higher values: More stable, smoother signals
- Lower values: More reactive, catches quick moves
- High frequency: 0.8-1.2, Medium: 1.3-1.7, Low: 1.8-2.3
Frobenius Trace Period (5-50, default 21):
Galois representation lookback for price-volume correlation:
- Measures harmonic relationships in market flows
- Scalping: 8-15, Day Trading: 18-25, Swing: 25-40
HTF Multi-Scale Analysis:
Higher timeframe context prevents trading against major trends:
- Provides market bias and filters signals
- Improves win rates by 15-25% through trend alignment
Operadic Composition Parameters
Strategy Composition Arity (2-5, default 4):
Number of algorithms composed for final signal:
- Conservative: 4-5 strategies (higher confidence)
- Moderate: 3-4 strategies (balanced approach)
- Aggressive: 2-3 strategies (more frequent signals)
Category Agreement Threshold (2-5, default 3):
Democratic voting minimum for signal generation:
- Higher agreement: Fewer but higher quality signals
- Lower agreement: More signals, potential false positives
Swiss-Cheese Mixing (0.1-0.5, default 0.382):
Golden ratio φ⁻¹ based blending of trend factors:
- 0.382 is φ⁻¹, optimal for natural market fractals
- Higher values: Stronger trend following
- Lower values: More contrarian signals
OFPI Configuration:
- OFPI Length (5-30, default 14): Order Flow calculation period
- T3 Smoothing (3-10, default 5): Advanced exponential smoothing
- T3 Volume Factor (0.5-1.0, default 0.7): Smoothing aggressiveness control
Unified Scoring System
Component Weights (sum ≈ 1.0):
- L-Function Weight (0.1-0.5, default 0.3): Mathematical harmony emphasis
- Galois Rank Weight (0.1-0.5, default 0.2): Market structure complexity
- Operadic Weight (0.1-0.5, default 0.3): Multi-strategy consensus
- Correspondence Weight (0.1-0.5, default 0.2): Theory-practice alignment
Signal Threshold (0.5-10.0, default 5.0):
Quality filter producing:
- 8.0+: EXCEPTIONAL signals only
- 6.0-7.9: STRONG signals
- 4.0-5.9: MODERATE signals
- 2.0-3.9: WEAK signals
🎨 ADVANCED VISUAL SYSTEM
Multi-Dimensional Quantum Aura Bands
Five-layer resonance field showing market energy:
- Colors: Theme-matched gradients (Quantum purple, Holographic cyan, etc.)
- Expansion: Dynamic based on score intensity and volatility
- Function: Multi-timeframe support/resistance zones
Morphism Flow Portals
Category theory visualization showing market topology:
- Green/Cyan Portals: Bullish mathematical flow
- Red/Orange Portals: Bearish mathematical flow
- Size/Intensity: Proportional to signal strength
- Recursion Depth (1-8): Nested patterns for flow evolution
Fractal Grid System
Dynamic support/resistance with projected L-Scores:
- Multiple Timeframes: 10, 20, 30, 40, 50-period highs/lows
- Smart Spacing: Prevents level overlap using ATR-based minimum distance
- Projections: Estimated signal scores when price reaches levels
- Usage: Precise entry/exit timing with mathematical confirmation
Wick Pressure Analysis
Rejection level prediction using candle mathematics:
- Upper Wicks: Selling pressure zones (purple/red lines)
- Lower Wicks: Buying pressure zones (purple/green lines)
- Glow Intensity (1-8): Visual emphasis and line reach
- Application: Confluence with fractal grid creates high-probability zones
Regime Intensity Heatmap
Background coloring showing market energy:
- Black/Dark: Low activity, range-bound markets
- Purple Glow: Building momentum and trend development
- Bright Purple: High activity, strong directional moves
- Calculation: Combines trend, momentum, volatility, and score intensity
Six Professional Themes
- Quantum: Purple/violet for general trading and mathematical focus
- Holographic: Cyan/magenta optimized for cryptocurrency markets
- Crystalline: Blue/turquoise for conservative, stability-focused trading
- Plasma: Gold/magenta for high-energy volatility trading
- Cosmic Neon: Bright neon colors for maximum visibility and aggressive trading
📊 INSTITUTIONAL-GRADE DASHBOARD
Unified AI Score Section
- Total Score (-10 to +10): Primary decision metric
- >5: Strong bullish signals
- <-5: Strong bearish signals
- Quality ratings: EXCEPTIONAL > STRONG > MODERATE > WEAK
- Component Analysis: Individual L-Function, Galois, Operadic, and Correspondence contributions
Order Flow Analysis
Revolutionary OFPI integration:
- OFPI Value (-100% to +100%): Real buying vs selling pressure
- Visual Gauge: Horizontal bar chart showing flow intensity
- Momentum Status: SHIFTING, ACCELERATING, STRONG, MODERATE, or WEAK
- Trading Application: Flow shifts often precede major moves
Signal Performance Tracking
- Win Rate Monitoring: Real-time success percentage with emoji indicators
- Signal Count: Total signals generated for frequency analysis
- Current Position: LONG, SHORT, or NONE with P&L tracking
- Volatility Regime: HIGH, MEDIUM, or LOW classification
Market Structure Analysis
- Möbius Field Strength: Mathematical field oscillation intensity
- CHAOTIC: High complexity, use wider stops
- STRONG: Active field, normal position sizing
- MODERATE: Balanced conditions
- WEAK: Low activity, consider smaller positions
- HTF Trend: Higher timeframe bias (BULL/BEAR/NEUTRAL)
- Strategy Agreement: Multi-algorithm consensus level
Position Management
When in trades, displays:
- Entry Price: Original signal price
- Current P&L: Real-time percentage with risk level assessment
- Duration: Bars in trade for timing analysis
- Risk Level: HIGH/MEDIUM/LOW based on current exposure
🚀 SIGNAL GENERATION LOGIC
Balanced Long/Short Architecture
The indicator generates signals through multiple convergent pathways:
Long Entry Conditions:
- Score threshold breach with algorithmic agreement
- Strong bullish order flow (OFPI > 0.15) with positive composite signal
- Bullish pattern recognition with mathematical confirmation
- HTF trend alignment with momentum shifting
- Extreme bullish OFPI (>0.3) with any positive score
Short Entry Conditions:
- Score threshold breach with bearish agreement
- Strong bearish order flow (OFPI < -0.15) with negative composite signal
- Bearish pattern recognition with mathematical confirmation
- HTF trend alignment with momentum shifting
- Extreme bearish OFPI (<-0.3) with any negative score
Exit Logic:
- Score deterioration below continuation threshold
- Signal quality degradation
- Opposing order flow acceleration
- 10-bar minimum between signals prevents overtrading
⚙️ OPTIMIZATION GUIDELINES
Asset-Specific Settings
Cryptocurrency Trading:
- Modular Level: 15-25 (capture volatility)
- L-Function Precision: 0.8-1.3 (reactive to price swings)
- OFPI Length: 10-20 (fast correlation shifts)
- Cascade Levels: 5-7, Theme: Holographic
Stock Index Trading:
- Modular Level: 25-35 (balanced trending)
- L-Function Precision: 1.5-1.8 (stable patterns)
- OFPI Length: 14-20 (standard correlation)
- Cascade Levels: 4-5, Theme: Quantum
Forex Trading:
- Modular Level: 35-45 (smooth trends)
- L-Function Precision: 1.6-2.1 (high smoothing)
- OFPI Length: 18-25 (disable volume amplification)
- Cascade Levels: 3-4, Theme: Crystalline
Timeframe Optimization
Scalping (1-5 minute charts):
- Reduce all lookback parameters by 30-40%
- Increase L-Function precision for noise reduction
- Enable all visual elements for maximum information
- Use Small dashboard to save screen space
Day Trading (15 minute - 1 hour):
- Use default parameters as starting point
- Adjust based on market volatility
- Normal dashboard provides optimal information density
- Focus on OFPI momentum shifts for entries
Swing Trading (4 hour - Daily):
- Increase lookback parameters by 30-50%
- Higher L-Function precision for stability
- Large dashboard for comprehensive analysis
- Emphasize HTF trend alignment
🏆 ADVANCED TRADING STRATEGIES
The Mathematical Confluence Method
1. Wait for Fractal Grid level approach
2. Confirm with projected L-Score > threshold
3. Verify OFPI alignment with direction
4. Enter on portal signal with quality ≥ STRONG
5. Exit on score deterioration or opposing flow
The Regime Trading System
1. Monitor Aether Flow background intensity
2. Trade aggressively during bright purple periods
3. Reduce position size during dark periods
4. Use Möbius Field strength for stop placement
5. Align with HTF trend for maximum probability
The OFPI Momentum Strategy
1. Watch for momentum shifting detection
2. Confirm with accelerating flow in direction
3. Enter on immediate portal signal
4. Scale out at Fibonacci levels
5. Exit on flow deceleration or reversal
⚠️ RISK MANAGEMENT INTEGRATION
Mathematical Position Sizing
- Use Galois Rank for volatility-adjusted sizing
- Möbius Field strength determines stop width
- Fractal Dimension guides maximum exposure
- OFPI momentum affects entry timing
Signal Quality Filtering
- Trade only STRONG or EXCEPTIONAL quality signals
- Increase position size with higher agreement levels
- Reduce risk during CHAOTIC Möbius field periods
- Respect HTF trend alignment for directional bias
🔬 DEVELOPMENT JOURNEY
Creating the LOMV was an extraordinary mathematical undertaking that pushed the boundaries of what's possible in technical analysis. This indicator almost didn't happen. The theoretical complexity nearly proved insurmountable.
The Mathematical Challenge
Implementing the Langlands Program required deep research into:
- Number theory and the Möbius function
- Riemann zeta function convergence properties
- L-function analytical continuation
- Galois representations in finite fields
The mathematical literature spans decades of pure mathematics research, requiring translation from abstract theory to practical market application.
The Computational Complexity
Operadic composition theory demanded:
- Category theory implementation in Pine Script
- Multi-dimensional array management for strategy composition
- Real-time democratic voting algorithms
- Performance optimization for complex calculations
The Integration Breakthrough
Bringing together three disparate mathematical frameworks required:
- Novel approaches to signal weighting and combination
- Revolutionary Order Flow Polarity Index development
- Advanced T3 smoothing implementation
- Balanced signal generation preventing directional bias
Months of intensive research culminated in breakthrough moments when the mathematics finally aligned with market reality. The result is an indicator that reveals market structure invisible to conventional analysis while maintaining practical trading utility.
🎯 PRACTICAL IMPLEMENTATION
Getting Started
1. Apply indicator with default settings
2. Select appropriate theme for your markets
3. Observe dashboard metrics during different market conditions
4. Practice signal identification without trading
5. Gradually adjust parameters based on observations
Signal Confirmation Process
- Never trade on score alone - verify quality rating
- Confirm OFPI alignment with intended direction
- Check fractal grid level proximity for timing
- Ensure Möbius field strength supports position size
- Validate against HTF trend for bias confirmation
Performance Monitoring
- Track win rate in dashboard for strategy assessment
- Monitor component contributions for optimization
- Adjust threshold based on desired signal frequency
- Document performance across different market regimes
🌟 UNIQUE INNOVATIONS
1. First Integration of Langlands Program mathematics with practical trading
2. Revolutionary OFPI with T3 smoothing and momentum detection
3. Operadic Composition using category theory for signal democracy
4. Dynamic Fractal Grid with projected L-Score calculations
5. Multi-Dimensional Visualization through morphism flow portals
6. Regime-Adaptive Background showing market energy intensity
7. Balanced Signal Generation preventing directional bias
8. Professional Dashboard with institutional-grade metrics
📚 EDUCATIONAL VALUE
The LOMV serves as both a practical trading tool and an educational gateway to advanced mathematics. Traders gain exposure to:
- Pure mathematics applications in markets
- Category theory and operadic composition
- Number theory through Möbius function implementation
- Harmonic analysis via L-function calculations
- Advanced signal processing through T3 smoothing
⚖️ RESPONSIBLE USAGE
This indicator represents advanced mathematical research applied to market analysis. While the underlying mathematics are rigorously implemented, markets remain inherently unpredictable.
Key Principles:
- Use as part of comprehensive trading strategy
- Implement proper risk management at all times
- Backtest thoroughly before live implementation
- Understand that past performance does not guarantee future results
- Never risk more than you can afford to lose
The mathematics reveal deep market structure, but successful trading requires discipline, patience, and sound risk management beyond any indicator.
🔮 CONCLUSION
The Langlands-Operadic Möbius Vortex represents a quantum leap forward in technical analysis, bringing PhD-level pure mathematics to practical trading while maintaining visual elegance and usability.
From the harmonic analysis of the Langlands Program to the democratic composition of operadic theory, from the number-theoretic precision of the Möbius function to the revolutionary Order Flow Polarity Index, every component works in mathematical harmony to reveal the hidden order within market chaos.
This is more than an indicator - it's a mathematical lens that transforms how you see and understand market structure.
Trade with mathematical precision. Trade with the LOMV.
*"Mathematics is the language with which God has written the universe." - Galileo Galilei*
*In markets, as in nature, profound mathematical beauty underlies apparent chaos. The LOMV reveals this hidden order.*
— Dskyz, Trade with insight. Trade with anticipation.

PubLibCandleTrendLibrary "PubLibCandleTrend"
candle trend, multi-part candle trend, multi-part green/red candle trend, double candle trend and multi-part double candle trend conditions for indicator and strategy development
chh()
candle higher high condition
Returns: bool
chl()
candle higher low condition
Returns: bool
clh()
candle lower high condition
Returns: bool
cll()
candle lower low condition
Returns: bool
cdt()
candle double top condition
Returns: bool
cdb()
candle double bottom condition
Returns: bool
gc()
green candle condition
Returns: bool
gchh()
green candle higher high condition
Returns: bool
gchl()
green candle higher low condition
Returns: bool
gclh()
green candle lower high condition
Returns: bool
gcll()
green candle lower low condition
Returns: bool
gcdt()
green candle double top condition
Returns: bool
gcdb()
green candle double bottom condition
Returns: bool
rc()
red candle condition
Returns: bool
rchh()
red candle higher high condition
Returns: bool
rchl()
red candle higher low condition
Returns: bool
rclh()
red candle lower high condition
Returns: bool
rcll()
red candle lower low condition
Returns: bool
rcdt()
red candle double top condition
Returns: bool
rcdb()
red candle double bottom condition
Returns: bool
chh_1p()
1-part candle higher high condition
Returns: bool
chh_2p()
2-part candle higher high condition
Returns: bool
chh_3p()
3-part candle higher high condition
Returns: bool
chh_4p()
4-part candle higher high condition
Returns: bool
chh_5p()
5-part candle higher high condition
Returns: bool
chh_6p()
6-part candle higher high condition
Returns: bool
chh_7p()
7-part candle higher high condition
Returns: bool
chh_8p()
8-part candle higher high condition
Returns: bool
chh_9p()
9-part candle higher high condition
Returns: bool
chh_10p()
10-part candle higher high condition
Returns: bool
chh_11p()
11-part candle higher high condition
Returns: bool
chh_12p()
12-part candle higher high condition
Returns: bool
chh_13p()
13-part candle higher high condition
Returns: bool
chh_14p()
14-part candle higher high condition
Returns: bool
chh_15p()
15-part candle higher high condition
Returns: bool
chh_16p()
16-part candle higher high condition
Returns: bool
chh_17p()
17-part candle higher high condition
Returns: bool
chh_18p()
18-part candle higher high condition
Returns: bool
chh_19p()
19-part candle higher high condition
Returns: bool
chh_20p()
20-part candle higher high condition
Returns: bool
chh_21p()
21-part candle higher high condition
Returns: bool
chh_22p()
22-part candle higher high condition
Returns: bool
chh_23p()
23-part candle higher high condition
Returns: bool
chh_24p()
24-part candle higher high condition
Returns: bool
chh_25p()
25-part candle higher high condition
Returns: bool
chh_26p()
26-part candle higher high condition
Returns: bool
chh_27p()
27-part candle higher high condition
Returns: bool
chh_28p()
28-part candle higher high condition
Returns: bool
chh_29p()
29-part candle higher high condition
Returns: bool
chh_30p()
30-part candle higher high condition
Returns: bool
chl_1p()
1-part candle higher low condition
Returns: bool
chl_2p()
2-part candle higher low condition
Returns: bool
chl_3p()
3-part candle higher low condition
Returns: bool
chl_4p()
4-part candle higher low condition
Returns: bool
chl_5p()
5-part candle higher low condition
Returns: bool
chl_6p()
6-part candle higher low condition
Returns: bool
chl_7p()
7-part candle higher low condition
Returns: bool
chl_8p()
8-part candle higher low condition
Returns: bool
chl_9p()
9-part candle higher low condition
Returns: bool
chl_10p()
10-part candle higher low condition
Returns: bool
chl_11p()
11-part candle higher low condition
Returns: bool
chl_12p()
12-part candle higher low condition
Returns: bool
chl_13p()
13-part candle higher low condition
Returns: bool
chl_14p()
14-part candle higher low condition
Returns: bool
chl_15p()
15-part candle higher low condition
Returns: bool
chl_16p()
16-part candle higher low condition
Returns: bool
chl_17p()
17-part candle higher low condition
Returns: bool
chl_18p()
18-part candle higher low condition
Returns: bool
chl_19p()
19-part candle higher low condition
Returns: bool
chl_20p()
20-part candle higher low condition
Returns: bool
chl_21p()
21-part candle higher low condition
Returns: bool
chl_22p()
22-part candle higher low condition
Returns: bool
chl_23p()
23-part candle higher low condition
Returns: bool
chl_24p()
24-part candle higher low condition
Returns: bool
chl_25p()
25-part candle higher low condition
Returns: bool
chl_26p()
26-part candle higher low condition
Returns: bool
chl_27p()
27-part candle higher low condition
Returns: bool
chl_28p()
28-part candle higher low condition
Returns: bool
chl_29p()
29-part candle higher low condition
Returns: bool
chl_30p()
30-part candle higher low condition
Returns: bool
clh_1p()
1-part candle lower high condition
Returns: bool
clh_2p()
2-part candle lower high condition
Returns: bool
clh_3p()
3-part candle lower high condition
Returns: bool
clh_4p()
4-part candle lower high condition
Returns: bool
clh_5p()
5-part candle lower high condition
Returns: bool
clh_6p()
6-part candle lower high condition
Returns: bool
clh_7p()
7-part candle lower high condition
Returns: bool
clh_8p()
8-part candle lower high condition
Returns: bool
clh_9p()
9-part candle lower high condition
Returns: bool
clh_10p()
10-part candle lower high condition
Returns: bool
clh_11p()
11-part candle lower high condition
Returns: bool
clh_12p()
12-part candle lower high condition
Returns: bool
clh_13p()
13-part candle lower high condition
Returns: bool
clh_14p()
14-part candle lower high condition
Returns: bool
clh_15p()
15-part candle lower high condition
Returns: bool
clh_16p()
16-part candle lower high condition
Returns: bool
clh_17p()
17-part candle lower high condition
Returns: bool
clh_18p()
18-part candle lower high condition
Returns: bool
clh_19p()
19-part candle lower high condition
Returns: bool
clh_20p()
20-part candle lower high condition
Returns: bool
clh_21p()
21-part candle lower high condition
Returns: bool
clh_22p()
22-part candle lower high condition
Returns: bool
clh_23p()
23-part candle lower high condition
Returns: bool
clh_24p()
24-part candle lower high condition
Returns: bool
clh_25p()
25-part candle lower high condition
Returns: bool
clh_26p()
26-part candle lower high condition
Returns: bool
clh_27p()
27-part candle lower high condition
Returns: bool
clh_28p()
28-part candle lower high condition
Returns: bool
clh_29p()
29-part candle lower high condition
Returns: bool
clh_30p()
30-part candle lower high condition
Returns: bool
cll_1p()
1-part candle lower low condition
Returns: bool
cll_2p()
2-part candle lower low condition
Returns: bool
cll_3p()
3-part candle lower low condition
Returns: bool
cll_4p()
4-part candle lower low condition
Returns: bool
cll_5p()
5-part candle lower low condition
Returns: bool
cll_6p()
6-part candle lower low condition
Returns: bool
cll_7p()
7-part candle lower low condition
Returns: bool
cll_8p()
8-part candle lower low condition
Returns: bool
cll_9p()
9-part candle lower low condition
Returns: bool
cll_10p()
10-part candle lower low condition
Returns: bool
cll_11p()
11-part candle lower low condition
Returns: bool
cll_12p()
12-part candle lower low condition
Returns: bool
cll_13p()
13-part candle lower low condition
Returns: bool
cll_14p()
14-part candle lower low condition
Returns: bool
cll_15p()
15-part candle lower low condition
Returns: bool
cll_16p()
16-part candle lower low condition
Returns: bool
cll_17p()
17-part candle lower low condition
Returns: bool
cll_18p()
18-part candle lower low condition
Returns: bool
cll_19p()
19-part candle lower low condition
Returns: bool
cll_20p()
20-part candle lower low condition
Returns: bool
cll_21p()
21-part candle lower low condition
Returns: bool
cll_22p()
22-part candle lower low condition
Returns: bool
cll_23p()
23-part candle lower low condition
Returns: bool
cll_24p()
24-part candle lower low condition
Returns: bool
cll_25p()
25-part candle lower low condition
Returns: bool
cll_26p()
26-part candle lower low condition
Returns: bool
cll_27p()
27-part candle lower low condition
Returns: bool
cll_28p()
28-part candle lower low condition
Returns: bool
cll_29p()
29-part candle lower low condition
Returns: bool
cll_30p()
30-part candle lower low condition
Returns: bool
gc_1p()
1-part green candle condition
Returns: bool
gc_2p()
2-part green candle condition
Returns: bool
gc_3p()
3-part green candle condition
Returns: bool
gc_4p()
4-part green candle condition
Returns: bool
gc_5p()
5-part green candle condition
Returns: bool
gc_6p()
6-part green candle condition
Returns: bool
gc_7p()
7-part green candle condition
Returns: bool
gc_8p()
8-part green candle condition
Returns: bool
gc_9p()
9-part green candle condition
Returns: bool
gc_10p()
10-part green candle condition
Returns: bool
gc_11p()
11-part green candle condition
Returns: bool
gc_12p()
12-part green candle condition
Returns: bool
gc_13p()
13-part green candle condition
Returns: bool
gc_14p()
14-part green candle condition
Returns: bool
gc_15p()
15-part green candle condition
Returns: bool
gc_16p()
16-part green candle condition
Returns: bool
gc_17p()
17-part green candle condition
Returns: bool
gc_18p()
18-part green candle condition
Returns: bool
gc_19p()
19-part green candle condition
Returns: bool
gc_20p()
20-part green candle condition
Returns: bool
gc_21p()
21-part green candle condition
Returns: bool
gc_22p()
22-part green candle condition
Returns: bool
gc_23p()
23-part green candle condition
Returns: bool
gc_24p()
24-part green candle condition
Returns: bool
gc_25p()
25-part green candle condition
Returns: bool
gc_26p()
26-part green candle condition
Returns: bool
gc_27p()
27-part green candle condition
Returns: bool
gc_28p()
28-part green candle condition
Returns: bool
gc_29p()
29-part green candle condition
Returns: bool
gc_30p()
30-part green candle condition
Returns: bool
rc_1p()
1-part red candle condition
Returns: bool
rc_2p()
2-part red candle condition
Returns: bool
rc_3p()
3-part red candle condition
Returns: bool
rc_4p()
4-part red candle condition
Returns: bool
rc_5p()
5-part red candle condition
Returns: bool
rc_6p()
6-part red candle condition
Returns: bool
rc_7p()
7-part red candle condition
Returns: bool
rc_8p()
8-part red candle condition
Returns: bool
rc_9p()
9-part red candle condition
Returns: bool
rc_10p()
10-part red candle condition
Returns: bool
rc_11p()
11-part red candle condition
Returns: bool
rc_12p()
12-part red candle condition
Returns: bool
rc_13p()
13-part red candle condition
Returns: bool
rc_14p()
14-part red candle condition
Returns: bool
rc_15p()
15-part red candle condition
Returns: bool
rc_16p()
16-part red candle condition
Returns: bool
rc_17p()
17-part red candle condition
Returns: bool
rc_18p()
18-part red candle condition
Returns: bool
rc_19p()
19-part red candle condition
Returns: bool
rc_20p()
20-part red candle condition
Returns: bool
rc_21p()
21-part red candle condition
Returns: bool
rc_22p()
22-part red candle condition
Returns: bool
rc_23p()
23-part red candle condition
Returns: bool
rc_24p()
24-part red candle condition
Returns: bool
rc_25p()
25-part red candle condition
Returns: bool
rc_26p()
26-part red candle condition
Returns: bool
rc_27p()
27-part red candle condition
Returns: bool
rc_28p()
28-part red candle condition
Returns: bool
rc_29p()
29-part red candle condition
Returns: bool
rc_30p()
30-part red candle condition
Returns: bool
cdut()
candle double uptrend condition
Returns: bool
cddt()
candle double downtrend condition
Returns: bool
cdut_1p()
1-part candle double uptrend condition
Returns: bool
cdut_2p()
2-part candle double uptrend condition
Returns: bool
cdut_3p()
3-part candle double uptrend condition
Returns: bool
cdut_4p()
4-part candle double uptrend condition
Returns: bool
cdut_5p()
5-part candle double uptrend condition
Returns: bool
cdut_6p()
6-part candle double uptrend condition
Returns: bool
cdut_7p()
7-part candle double uptrend condition
Returns: bool
cdut_8p()
8-part candle double uptrend condition
Returns: bool
cdut_9p()
9-part candle double uptrend condition
Returns: bool
cdut_10p()
10-part candle double uptrend condition
Returns: bool
cdut_11p()
11-part candle double uptrend condition
Returns: bool
cdut_12p()
12-part candle double uptrend condition
Returns: bool
cdut_13p()
13-part candle double uptrend condition
Returns: bool
cdut_14p()
14-part candle double uptrend condition
Returns: bool
cdut_15p()
15-part candle double uptrend condition
Returns: bool
cdut_16p()
16-part candle double uptrend condition
Returns: bool
cdut_17p()
17-part candle double uptrend condition
Returns: bool
cdut_18p()
18-part candle double uptrend condition
Returns: bool
cdut_19p()
19-part candle double uptrend condition
Returns: bool
cdut_20p()
20-part candle double uptrend condition
Returns: bool
cdut_21p()
21-part candle double uptrend condition
Returns: bool
cdut_22p()
22-part candle double uptrend condition
Returns: bool
cdut_23p()
23-part candle double uptrend condition
Returns: bool
cdut_24p()
24-part candle double uptrend condition
Returns: bool
cdut_25p()
25-part candle double uptrend condition
Returns: bool
cdut_26p()
26-part candle double uptrend condition
Returns: bool
cdut_27p()
27-part candle double uptrend condition
Returns: bool
cdut_28p()
28-part candle double uptrend condition
Returns: bool
cdut_29p()
29-part candle double uptrend condition
Returns: bool
cdut_30p()
30-part candle double uptrend condition
Returns: bool
cddt_1p()
1-part candle double downtrend condition
Returns: bool
cddt_2p()
2-part candle double downtrend condition
Returns: bool
cddt_3p()
3-part candle double downtrend condition
Returns: bool
cddt_4p()
4-part candle double downtrend condition
Returns: bool
cddt_5p()
5-part candle double downtrend condition
Returns: bool
cddt_6p()
6-part candle double downtrend condition
Returns: bool
cddt_7p()
7-part candle double downtrend condition
Returns: bool
cddt_8p()
8-part candle double downtrend condition
Returns: bool
cddt_9p()
9-part candle double downtrend condition
Returns: bool
cddt_10p()
10-part candle double downtrend condition
Returns: bool
cddt_11p()
11-part candle double downtrend condition
Returns: bool
cddt_12p()
12-part candle double downtrend condition
Returns: bool
cddt_13p()
13-part candle double downtrend condition
Returns: bool
cddt_14p()
14-part candle double downtrend condition
Returns: bool
cddt_15p()
15-part candle double downtrend condition
Returns: bool
cddt_16p()
16-part candle double downtrend condition
Returns: bool
cddt_17p()
17-part candle double downtrend condition
Returns: bool
cddt_18p()
18-part candle double downtrend condition
Returns: bool
cddt_19p()
19-part candle double downtrend condition
Returns: bool
cddt_20p()
20-part candle double downtrend condition
Returns: bool
cddt_21p()
21-part candle double downtrend condition
Returns: bool
cddt_22p()
22-part candle double downtrend condition
Returns: bool
cddt_23p()
23-part candle double downtrend condition
Returns: bool
cddt_24p()
24-part candle double downtrend condition
Returns: bool
cddt_25p()
25-part candle double downtrend condition
Returns: bool
cddt_26p()
26-part candle double downtrend condition
Returns: bool
cddt_27p()
27-part candle double downtrend condition
Returns: bool
cddt_28p()
28-part candle double downtrend condition
Returns: bool
cddt_29p()
29-part candle double downtrend condition
Returns: bool
cddt_30p()
30-part candle double downtrend condition
Returns: bool

Strength Measurement -HTThe Strength Measurement -HT indicator is a tool designed to measure the strength and trend of a security using the Average Directional Index (ADX) across multiple time frames. This script averages the ADX values from five different time frames to provide a comprehensive view of the trend's strength, helping traders make more informed decisions.
Key Features:
Multi-Time Frame Analysis: The indicator calculates ADX values from five different time frames (5 minutes, 15 minutes, 30 minutes, 1 hour, and 4 hours) to offer a more holistic view of the market trend.
Trend Strength Visualization: The average ADX value is plotted as a histogram, with colors indicating the trend strength and direction, making it easy to visualize and interpret.
Reference Levels: The script includes horizontal lines at ADX levels 25, 50, and 75 to signify weak, strong, and very strong trends, respectively.
How It Works
Directional Movement Calculation: The script calculates the positive and negative directional movements (DI+) and (DI-) using the true range over a specified period (default is 14 periods).
ADX Calculation: The ADX value is derived from the smoothed moving average of the absolute difference between DI+ and DI-, normalized by their sum.
Multi-Time Frame ADX: ADX values are computed for the 5-minute, 15-minute, 30-minute, 1-hour, and 4-hour time frames.
Average ADX: The script averages the ADX values from the different time frames to generate a single, comprehensive ADX value.
Trend Visualization: The average ADX value is plotted as a histogram with colors indicating:
Gray for weak trends (ADX < 25)
Green for strengthening trends (25 ≤ ADX < 50)
Dark Green for strong trends (ADX ≥ 50)
Light Red for weakening trends (ADX < 25)
Red for strong trends turning weak (ADX ≥ 25)
Usage
Trend Detection: Use the color-coded histogram to quickly identify the trend strength and direction. Green indicates a strengthening trend, while red signifies a weakening trend.
Reference Levels: Utilize the horizontal lines at ADX levels 25, 50, and 75 as reference points to gauge the trend's strength.
ADX < 25 suggests a weak trend.
ADX between 25 and 50 indicates a moderate to strong trend.
ADX > 50 points to a very strong trend.
Multi-Time Frame Insight: Leverage the averaged ADX value to gain insights from multiple time frames, helping you make more informed trading decisions based on a broader market perspective.
Feel free to explore and integrate this indicator into your trading strategy to enhance your market analysis and decision-making process. Happy trading!

Directional Movement IndexADX is an oscillating indicator, displayed as a single line, ranging from 0 to 100, it only indicates the strength of the trend and does not indicate its direction. In other words, the ADX is non-directional, meaning that it measures the strength of a trend, but doesn’t distinguish between uptrend and downtrends. So, during a strong uptrend, the ADX rises and during a strong downtrend, the ADX also rises.
Here is how you correctly read what ADX is saying about the market. Here are 5 aspects regarding the interpretation of the ADX:
1- When ADX is above 25, trend strength is strong. Usually, once the ADX gets above 25 this signals the beginning of a trend. Big moves (upwards or downwards) tend to happen when ADX is right around this number. You can experiment with this number, some traders that want faster signals, tend to use a 20 threshold when trading with the ADX.
2- When ADX is below 25, traders must avoid trend trading strategies as the market is in accumulation or distribution phase. So, when we see the ADX line below 20 or 25 level, we forget about trend following strategies and we apply strategies suitable for a ranging market.
3- When ADX is above 25 and Positive Directional Movement Indicator (+DMI) is above the Negative Directional Movement Indicator (-DMI). ADX measures the strength of an uptrend. The crossover between the 2 Directional Movement Indicator, as the ADX line is well above 25 can result in an excellent bullish move.
4- The Positive Directional Movement Indicator (+DMI) should be above the Negative Directional Movement and the ADX should be above 25 signals for a strong upward trend for long opportunities. When ADX is above 25 and Positive Directional Movement Indicator is below the Negative Directional Movement Indicator, ADX measures the strength of a downtrend and short opportunities.
5- Values over 50 of the ADX indicate a very strong trend
There are pros and cons of ADX.
So, why is the ADX useful for traders: First, is excellent at quantifying trend strength. Also, it allows traders to see the strength of bulls and bears at the same time. It is good at filtering out trades, during accumulation periods and is good at identifying trending conditions.
But the ADX also has its limitations. The most important disadvantage is the fact that ADX is a lagging indicator that follows the price, so we must be very careful when we apply this indicator, because we might miss the inception of the trend and join it when it’s nearly over.
Also, it offers many false signals when used on shorter time frames, so it’s advisable to trade it on higher time frames Also, the ADX does not contain all of the data necessary a for proper analysis of price action, so it must be used in combination with other tools or indicators.
Now that we fully covered the good and the bad regarding ADX, let’s see how it is used in a trading strategy.
The trading strategy involves a DMI crossover, confirmed by ADX above consolidation threshold. If +DMI crossover, we take long position and if -DMI crosses over, we take a short position.
Candles are re-colored for easy demonstration of uptrend, downtrend and consolidation periods.
Green candles – ADX > Consolidation Threshold and +DMI > -DMI
Red candles – ADX > Consolidation Threshold and +DMI < -DMI
Black candles – ADX < Consolidation Threshold
Repaint – This is a non-repainting strategy - All the signals are generated at candle closing. All the calculations are made on previous candle’s open, high, low, close. No request security function is used. No data is being used from higher time frame. Trade exit uses close function instead of exit to avoid limit orders. Only one long trade at a time (no pyramiding) is allowed.
Strategy Time frame – D (To filter out false signals, higher time frame is recommended)
Strategy For – Swing Traders
Assets – Cryptocurrencies + Stocks

Average Directional Index + ΔDI± (Delta)Average Directional Index (ADX) and Difference between DI+ and DI- (ΔDI±), I call it Delta for short.
The idea explained:
ADX is a common indicator for analysing trend strength. Values over 25 usually indicate the symbol is in "trend mode", meaning there is a lot of momentum, upwards or downwards, - while values under 25 suggest it is in "range mode", the price moves sideways, lacking energy. Note that this indicator is not volume-based.
I moved the graph (red) down 25 points; this version shows positive values in "trend mode" (>25), and negative values in "range mode" (<25). The line sits at 0. The underlying code for the ADX is basically identical to the official TradingView built-in version.
Now the exciting part: DI+ and DI- are used to calculate the ADX. They are sometimes included in the ADX indicator chart, I included a version that shows them in the graphic, at the bottom. Traditionally, DI+ (green) crossing DI- (dark red) from below shows the beginning of an upward trend, and therefore a good LONG entry position. However, I noticed that this is usually not the case: this method responds very slowly to the actual price movement. At the point the indicator tells you to enter, the trend is usually already exhausted.
I found a better way to use this data; instead of waiting for both graphs to cross, meaning the difference in their respective values is 0, we look for the greatest possible difference. That is what the purple graph of my indicator shows (ΔDI±). It utilizes the zero-line we already created for the ADX. High positive values declare that the DI+ is much greater than the DI-, and vice versa. Delta is the greek letter used in mathematics for difference, so that is what I call this indicator.
How to use it:
When you look at the graph, low Delta values seem to be good entry points for LONG positions, high Delta values good exits. This is similar to how RSI and CCI work, which is why included them in the chart above (). However, this is only reliable, when the ADX is above 25, or 0 in this version, indicating the symbol is in "trend mode". This is important .
When you look at the examples in the chart, you can confirm that. The marked candles show good entry and exit points, with Delta being notably low/high (±25 seems to be a good threshold, the dashed lines sit at +30/-30), and the ADX above 0 (25). Now, you might have noticed that around mid-december the Delta actually registers the highest value for this symbol in the given time frame, indicating a strong SHORT after a steep climb. But, importantly , the ADX is not in "trend mode" as required for a clear signal, it is in "range mode": the price discovers this new level and takes a few days to get used to it. It does not fall. This shows why only the combination of both Delta and ADX gives desirable results.
I noticed that this seems to work best for 1D and 1H candles; if you find any other time frames or scenarios, let me know!
PLEASE NOTE THAT THIS IS BASED ON PERSONAL, EMPIRICAL OBSERVATIONS. PAST RESULTS DO NOT GUARANTEE SUCCESS IN THE FUTURE. DO NOT TAKE THIS AS INVESTMENT ADVICE!
Thanks to TradingView and robertkowalski for providing the basis on which the code is built. Credit goes to the appropriate developers/owners.
()
Let me know if you make any other observations, or find other ways to use the data!

FlowScape PredictorFlowScape Predictor is a non-repainting, regime-aware entry qualifier that turns complex market context into two readiness scores (Long & Short, each 0/25/50/75/100) and clean, confirmed-bar signals. It blends three orthogonal pillars so you act only when trend energy, momentum, and location agree:
Regime (energy): ATR-normalized linear-regression slope of a smooth HMA → EMA baseline, gated by ADX to confirm when pressure is meaningful.
Momentum (push): RSI slope alignment so price has directional follow-through, not just drift.
Structure (location): proximity to pivot-confirmed swings, scaled by ATR, so “ready” appears near constructive pullbacks—not mid-trend chases.
A soft ATR cloud wraps the baseline for context. A yellow Predictive Baseline extends beyond the last bar to visualize near-term trajectory. It is visual-only: scores/alerts never use it.
What you see
Baseline line that turns green/red when regime is strong in that direction; gray when weak.
ATR cloud around the baseline (context for stretch and pullbacks).
Scores (Long & Short, 0–100 in steps of 25) and optional “L/S” icons on bar close.
Yellow Predictive Baseline that extends to the right for a few bars (visual trajectory of the smoothed baseline).
The scoring system (simple and transparent)
Each side (Long/Short) sums four binary checks, 25 points each:
Regime aligned: trendStrong is true and LR slope sign favors that side.
Momentum aligned: RSI side (>50 for Long, <50 for Short) and RSI slope confirms direction.
Baseline side: price is above (Long) / below (Short) the baseline.
Location constructive: distance from the last confirmed pivot is healthy (ATR-scaled; not overstretched).
Valid totals are 0, 25, 50, 75, 100.
Best-quality signal: 100/0 (your side/opposite) on bar close.
Good, still valid: 75/0, especially when the missing block is only “location” right as price re-engages the cloud/baseline.
Avoid: 75/25 or any opposition > 0 in a weak (gray) regime.
The Predictive (Kalman) line — what it is and isn’t
The yellow line is a visual forward extension of the smoothed baseline to help you see the current trajectory and time pullback resumptions. It does not predict price and is excluded from scores and alerts.
How it’s built (plain English):
We maintain a one-dimensional Kalman state x as a smoothed estimate of the baseline. Each bar we observe the current baseline z.
The filter adjusts its trust using the Kalman gain K = P / (P + R) and updates:
x := x + K*(z − x), then P := (1 − K)*P + Q.
Q (process noise): Higher Q → expects faster change → tracks turns quicker (less smoothing).
R (measurement noise): Higher R → trusts raw baseline less → smoother, steadier projection.
What you control:
Lead (how many bars forward to draw).
Kalman Q/R (visual smoothness vs. responsiveness).
Toggle the line on/off if you prefer a minimal chart.
Important: The predictive line extends the baseline, not price. It’s a visual timing aid—don’t automate off it.
How to use (step-by-step)
Keep the chart clean and use a standard OHLC/candlestick chart.
Read the regime: Prefer trades with green/red baseline (trendStrong = true).
Check scores on bar close:
Take Long 100 / Short 0 or Long 75 / Short 0 when the chart shows a tidy pullback re-engaging the cloud/baseline.
Mirror the logic for shorts.
Confirm location: If price is > ~1.5 ATR from its reference pivot, let it come back—avoid chasing.
Set alerts: Add an alert on Long Ready or Short Ready; these fire on closed bars only.
Risk management: Use ATR-buffered stops beyond the recent pivot; target fixed-R multiples (e.g., 1.5–3.0R). Manage the trade with the baseline/cloud if you trail.
Best-practice playbook (quick rules)
Green light: 100/0 (best) or 75/0 (good) on bar close in a colored (non-gray) regime.
Location first: Prefer entries near the baseline/cloud right after a pullback, not far above/below it.
Avoid mixed signals: Skip 75/25 and anything with opposition while the baseline is gray.
Use the yellow line with discretion: It helps you see rhythm; it’s not a signal source.
Timeframes & tuning (practical defaults)
Intraday indices/FX (5m–15m): Demand 100/0 in chop; allow 75/0 when ADX is awake and pullback is clean.
Crypto intraday (15m–1h): Prefer 100/0; 75/0 on the first pullback after a regime turn.
Swing (1h–4h/D1): 75/0 is often sufficient; 100/0 is excellent (fewer but cleaner signals).
If choppy: raise ADX threshold, raise the readiness bar (insist on 100/0), or lengthen the RSI slope window.
What makes FlowScape different
Energy-first regime filter: ATR-normalized LR slope + ADX gate yields a consistent read of trend quality across symbols and timeframes.
Location-aware entries: ATR-scaled pivot proximity discourages mid-air chases, encouraging pullback timing.
Separation of concerns: The predictive line is visual-only, while scores/alerts are confirmed on close for non-repainting behavior.
One simple score per side: A single 0–100 readiness figure is easier to tune than juggling multiple indicators.
Transparency & limitations
Scores are coarse by design (25-point blocks). They’re a gatekeeper, not a promise of outcomes.
Pivots confirm after right-side bars, so structure signals appear after swings form (non-repainting by design).
Avoid using non-standard chart types (Heikin Ashi, Renko, Range, etc.) for signals; use a clean, standard chart.
No lookahead, no higher-timeframe requests; alerts fire on closed bars only.

ADX with Shaded ZoneThe ADX with Shaded Zone indicator is a momentum-based tool that visualizes trend strength using the Average Directional Index (ADX) along with the +DI and -DI lines. This indicator enhances the traditional ADX setup by adding a shaded zone between ADX levels 20 and 25, helping traders easily identify the transition area between non-trending and trending market conditions.
It plots:
+DI (Green): Positive Directional Indicator
−DI (Red): Negative Directional Indicator
ADX (Blue): Measures the strength of the trend
Shaded Zone: Highlights the indecisive range where ADX is below 25 (gray background between levels 20 and 25)
⚙️ How to Use:
✅ Trend Identification:
ADX < 20: Weak or no trend. Avoid trend-following strategies.
ADX 20–25 (Shaded Zone): Transition zone. Potential trend forming — stay cautious.
ADX > 25: Stronger trend. Favor trend-following strategies.
✅ Direction Confirmation:
If +DI > -DI and ADX > 25 → Uptrend confirmation.
If -DI > +DI and ADX > 25 → Downtrend confirmation.
Crossovers between +DI and -DI can be used as early signals.
✅ Shaded Zone Use:
The gray shaded area helps visually filter out low-trend strength conditions.
Useful for trend traders to wait before entering until ADX breaks above 25.

Donchian Trend Ribbon (Gradient)Donchian Trend Ribbon (Gradient) Indicator
The Donchian Trend Ribbon (Gradient) uses Donchian Channels to visualize trend direction, strength, and market phases. Columns with varying colors and intensity help traders quickly assess trends.
Key Components:
Green Columns (Bullish):
Appear when price is above the upper Donchian Channel boundary.
Bright green in the top zone (25-50): Strong bullish trend.
Darker green in the lower zone (0-25): Weak/moderate bullish trend.
A full-height bright green column indicates a very strong upward move.
Red Columns (Bearish):
Appear when price is below the lower Donchian Channel boundary.
Bright red in the top zone (25-50): Strong bearish trend.
Darker red in the lower zone (0-25): Weak/moderate bearish trend.
A full-height bright red column indicates a very strong downward move.
Black Columns (Neutral):
Indicate no trend or market consolidation.
Signal to wait for trend emergence.
Expanding Steps:
Steps expanding downward from the upper edge (50) suggest diminishing momentum.
Steps expanding upward from the lower edge (0) indicate growing trend strength.
Methods of Use:
Identify Trends: Green (buy) or red (sell) columns in the top zone (25-50) signal strong trends.
Assess Strength: Bright colors = strong trends, darker colors = weaker trends. Full-height bright columns indicate very strong moves.
Neutral Phases: Black columns suggest waiting for a trend.
Example Strategy:
Buy when green columns appear in the 25-50 range with bright intensity.
Sell when red columns appear in the 25-50 range with bright intensity.
Exit positions if columns turn black or darker-colored.

FX Meter ScriptA while ago, we wrote* about the usefulness of using a currency strength meter and how you can build one from scratch.
See here: www.globalprime.com.au
Now we've taken this little project to the next level by visually spotting, via color signals in a dashboard and alerts, when a potential new trend might be developing in a currency pair.
*It's critical that you first read that article before you jump into reading this one or else you could get easily lost.
The script gives a trigger every time two currencies show diverging flows via opposing moving average slopes.
The signals originate from a first chart where currency indexes can be found, calculated through a formula, in various thin lines. Then a moving average to each currency index is applied so that it can smooth out the lines (what I call Micro moving averages – thicker lines -) and is usually a 4-5 period MA, with the key input to pay attention being the slope. One can perform their own tests on what works best for their particular trading style. The smaller the period in the moving average, the more responsive to changes in biases but the downside is that you will get a greater number of false moves. In the windows below the 1st chart, the stochRSI is calculated for each currency index (these values originate from the currency index and not from the applied MA). By default, a 25-period is applied to both RSI and Stoch length.
A 2nd chart that looks at the same logic is also accounted for to build this script, but instead of checking the micro trend, it applies a 25MA to the currency index, so it looks at what I call the slope of the macro trend. In this case, by default, a 125-period is applied to both RSI and Stoch length.
We had in mind to transition from just eye-balling and monitoring these charts manually to build a script via Tradingview that makes calculations real time (whenever the change in the moving average slope first occurs, and not when the bar/line closes), so that one can decide whether or not its a signal worth trading as part of a new trend emerging. Note, this is not so much a signal-triggering indicator but rather a tool to constantly be on the lookout monitoring what currencies might start to develop trends.
The actual script consists of a dashboard with different colored rectangles being triggered depending on the quality of the signal.
We will be happy to discuss it further with anyone who is interested in exploiting all the benefits that it can offer.
The way you add the script into your Tradingview chart is by first copy everything in the txt file. Then go to Pine editor (bottom middle-left) in your tradingview chart, delete everything there, then Paste the script. Then click Add to Chart (top right of the pine editor).
Note, you should add via the Anchored Text function the following list of pairs below, in this alphabetic order, on the right-hand side of the chart, as demonstrated above:
AUDCAD
AUDJPY
AUDNZD
AUDUSD
CADJPY
EURAUD
EURJPY
EURCAD
EURNZD
EURGBP
EURUSD
GBPAUD
GBPCAD
GBPJPY
GBPNZD
GBPUSD
NZDCAD
NZDJPY
NZDUSD
USDCAD
USDJPY
There are only 2 rules for the script to trigger a signal (see below). However, as I will elaborate further down, there are up to 6 different colors we can grade a signal
RULE 1 -> 2 moving averages, which are a calculation applied to a currency index as shown in the micro trend above, exhibit slopes in the opposite direction.
RULE 2 -> The Stoch RSI cannot be in overbought conditions if the slope of the moving average points higher or in oversold if the slope points lower.
Note 1: Even if the chart is a 60m timeframe by default (can be changed to any timeframe(, one gets the signal the moment the change of slope is identified, which means the indicator monitors changes in price tick by tick, and not on a candle close, otherwise one would get the trigger too late.
As an example of the highest-graded signal triggering (in green), a few hours ago we were given the visual cue that GBPCAD was experiencing a change of behavior. If we crosscheck the time the green-colored trigger was given with the actual GBPCAD chart, this is what we can observe. The pair is 30p higher since the trigger.
HOW TO SETUP ALERTS
One can easily setup a notification window each time the above rules are met, for example, if the EUR MA slope changes to bullish, and the AUD MA slope changes to bearish, and none of the 2 currency index values corresponding to these 2 moving averages (EUR and AUD) show a stoch RSI in overbought (above 80) in the case of the EUR, or oversold (below 20) in the case of the AUD, then the notification pop up would show a customized line: Long EURAUD
Note 1: Recording the slope of the macro moving average, which is usually a 25period MA applied to the currency index, is not included as part of the rules to trigger a signal, but it is taken into account to grade the quality of each signal.
Note 2: I recommend each signal to be triggered once or if you prefer, simply monitor the chart visually on the change of colors via the dashboard. The calculation resets and can appear again the moment that the slope changes to the opposite direction, so it’s a very dynamic indicator that will alert you the second a pair of currencies starts trending.
Note 3: When the signal is triggered, the indicator draws a colored rectangle. Each signal notification should be colored based on the following logic below.
LOGIC TO QUALIFY SIGNALS
-> Any long micro position with Macro MA in full agreement (ie/ Long EURAUD, Macro EUR up, Macro AUD down) is highlighted with green color
-> Any long micro position with macro moving averages in partial agreement (for example Long EURAUD, Macro EUR up AUD up) is highlighted with blue color
-> Any long micro position with macro moving averages in full disagreement (for example Long EURAUD, Macro EUR down AUD up) is highlighted with magenta color
-> Any short micro position with macro moving averages in full agreement (for example Short EURAUD, Macro EUR down AUD up) is highlighted with red color
-> Any short micro position with macro moving averages in partial agreement (for example Short EURAUD, Macro EUR up AUD up) is highlighted with orange color
-> Any short micro position with macro moving averages in full disagreement (for example Short EURAUD, Macro EUR up AUD down) is highlighted with purple color
PARAMETERS IN THE SCRIPT SETTINGS
Overbought/oversold: One can modify the stoch RSI level from which the indicator considers the value to be in overbought or oversold conditions. As a rule of thumb, consider 20/30 for oversold and 70/80 for oversold.
Slopes micro/macro MAs: One can edit the slope of the micro MA period (rule of thumb 4-5) and the macro MA (by default 25).
Value StochRSI: The default inputs are K 3, D 3, RSI Length 25, Stoch Length 25 for the micro and 125 period for the macro.
Change colors: One can edit the assigned colors in the signals dashboard.
Timeframe applied: The indicator has the flexibility to be applied to any timeframe, not just the 60m by default. Simply change the timeframe temporality.
CURRENCY INDEXES FORMULAS
It is the responsibility of the user to keep the values of the indexes updated. Find a recent sample below, as per values in early April. What this means is that at least once a week, in order to not let the values outdated, you should update the script with the latest valuations in the denominator.
NZD INDEX -> FX_IDC:NZDAUD/0.96+FX:NZDJPY/75.81+FX:NZDUSD/0.68+FX_IDC:NZDEUR/0.6+FX_IDC:NZDGBP/0.52+FX:NZDCHF/0.69+FX:NZDCAD/0.9
EUR INDEX -> FX:EURUSD/1.13+FX:EURJPY/125.5+FX:EURGBP/0.87+FX:EURCHF/1.135+FX:EURCAD/1.49+FX:EURNZD/1.655+FX:EURAUD/1.59
JPY INDEX -> 1/(FX:USDJPY/110.5+FX:EURJPY/125.5+FX:AUDJPY/79+FX:NZDJPY/75.5+FX:GBPJPY/144.5+FX:CHFJPY/110.5+FX:CADJPY/84)
USD INDEX -> FX_IDC:USDEUR/0.88+FX:USDJPY/110.5+FX_IDC:USDGBP/0.77+FX:USDCHF+FX:USDCAD/1.315+FX_IDC:USDNZD/1.46+FX_IDC:USDAUD/1.4
CAD INDEX-> FX_IDC:CADAUD/1.07+FX_IDC:CADNZD/1.11+FX:CADJPY/84.27+FX_IDC:CADUSD/0.76+FX_IDC:CADEUR/0.67+FX:CADCHF/0.76+FX_IDC:CADGBP/0.58
GBP INDEX -> FX:GBPAUD/1.83+FX:GBPNZD/1.91+FX:GBPJPY/144.5+FX_IDC:GBPEUR/1.15+FX:GBPCHF/1.31+FX:GBPUSD/1.31+FX:GBPCAD/1.71
Remember, I have provided a manual on how to build a currency strength meter. That’s what you will need to do first if you want to obtain the actual currency indexes other than just the indicator, which is just the visual cue to get you alerted when the slopes turn.
Once you’ve created your indexes via tradingview, you then apply a moving average to each index. Then apply the stochrsi 25 period to each index. For the macro trend, I make the same calculations, but the period of the MA is 25 instead of 4, while the stoch rsi is 125 periods vs 25 periods.
FINAL NOTE
This is a tool that should be interpreted as visual assistance, via the dashboard, to get that first cue when opposing micro slopes via the FX meter occur. However, you still need to check the technical context of the pair (levels marked, proj reached, etc.) but that first cue is a major time saver to constantly spot what's trending in FX. The permutations u can play with, as part of this script, are significant. You can tweak the timeframes you use, the periods of the moving averages, etc. I find the micro and macro trend combos when either a green or red signals is triggered the most reliable, with positions to be exploited via 15m and hourly under the right technical context.

Alpha-Weighted RSIDescription:
The Alpha-Weighted RSI is a next-generation momentum oscillator that redefines the classic RSI by incorporating the mathematical principles of Lévy Flight. This advanced adaptation applies non-linear weighting to price changes, making the indicator more sensitive to significant market moves and less reactive to minor noise. It is designed for traders seeking a clearer, more powerful view of momentum and potential reversal zones.
🔍 Key Features & Innovations:
Lévy Flight Alpha Weighting: At the core of this indicator is the Alpha parameter (1.0-2.0), which controls the sensitivity to price changes.
Lower Alpha (e.g., 1.2): Makes the indicator highly responsive to recent price movements, ideal for capturing early trend shifts.
Higher Alpha (e.g., 1.8): Creates a smoother, more conservative output that filters out noise, focusing on stronger momentum.
Customizable Smoothing: The raw Lévy-RSI is smoothed by a user-selectable moving average (8 MA types supported: SMA, EMA, SMMA, etc.), allowing for further customization of responsiveness.
Intuitive Centered Oscillator: The RSI is centered around a zero line, providing a clean visual separation between bullish and bearish territory.
Dynamic Gradient Zones: Subtle, colour coded gradient fills in the overbought (>+25) and oversold (<-25) regions enhance visual clarity without cluttering the chart.
Modern Histogram Display: Momentum is plotted as a sleek histogram that changes color between bright cyan (bullish) and magenta (bearish) based on its position relative to the zero line.
🎯 How to Use & Interpret:
Zero-Line Crossovers: The most basic signals. A crossover above the zero line indicates building bullish momentum, while a crossover below suggests growing bearish momentum.
Overbought/Oversold Levels: Use the +25/-25 and +35/-35 levels as dynamic zones. A reading above +25 suggests strong bullish momentum (overbought), while a reading below -25 indicates strong bearish momentum (oversold).
Divergence Detection: Look for divergences between the Alpha-Weighted RSI and price action. For example, if price makes a new low but the RSI forms a higher low, it can signal a potential bullish reversal.
Alpha Tuning: Adjust the Alpha parameter to match market volatility. In choppy markets, increase alpha to reduce noise. In trending markets, decrease alpha to become more responsive.
⚙️ Input Parameters:
RSI Settings: Standard RSI inputs for Length and Calculation Source.
Lévy Flight Settings: The crucial Alpha factor for response control.
MA Settings: MA Type and MA Length for smoothing the final output.
By applying Lévy Flight dynamics, this indicator offers a nuanced perspective on momentum, helping you stay ahead of the curve. Feedback is always welcome!

Monthly Color Marker V4
## 📊 Monthly Color Marker - Historical Month Highlighting
### Overview
A unique indicator that allows rapid identification of all monthly candles from a specific month across multiple years. The indicator marks candles with different colors based on their direction (bullish/bearish), enabling quick analysis of seasonal patterns and cyclical behavior of stocks or assets.
### 🎯 Purpose
- **Identify Seasonal Patterns (Seasonality)** - Discover recurring trends in specific months
- **Quick Historical Analysis** - Visual representation of monthly performance over the years
- **Direction Recognition** - Instant understanding of whether a month tends to be bullish or bearish
- **Seasonal Trading Planning** - Build strategies based on cyclical patterns
### ⚙️ Adjustable Parameters
1. **Month to Mark (1-12)**
- Select the desired month for analysis
- 1 = January, 2 = February... 12 = December
- Default: 11 (November)
2. **Years Back (1-50)**
- Determines how many years back to scan
- Recommended: 10-25 years for statistically reliable data
- Default: 25 years
3. **Bullish Candle Color**
- Color for marking bullish candles (close > open)
- Default: Green
- Customizable to your personal color scheme
4. **Bearish Candle Color**
- Color for marking bearish candles (close < open)
- Default: Red
- Customizable to your personal color scheme
5. **Show Current Year**
- Whether to include the current month in the marking
- Useful when the month hasn't finished yet
- Default: Yes
### 📈 How to Use the Indicator
#### Step 1: Adding to Chart
1. Switch to **Monthly timeframe** - Required!
2. Add the indicator to your chart
3. Select the month you want to analyze
#### Step 2: Initial Analysis
- **Count green vs red candles** - What's the ratio?
- **Look for patterns** - Are there years where the month always rises/falls?
- **Identify outliers** - Years where behavior was different
#### Step 3: Making Decisions
- **Mostly green** → Statistically, the month tends to rise
- **Mostly red** → Statistically, the month tends to fall
- **Mixed** → No clear seasonal pattern
### 💡 Usage Examples
**Example 1: "Santa Claus Rally"**
- Select month 12 (December)
- Check if there are mostly green candles
- If yes, this confirms the well-known year-end rally effect
**Example 2: "September Effect"**
- Select month 9 (September)
- Historically, September is considered a weak month
- Do the data support this for this stock?
**Example 3: Quarterly Earnings**
- Identify which month earnings are released
- Check the historical response
- Plan entry/exit accordingly
### 🔍 Combining with Other Indicators
This indicator works excellently with:
- **Historical Monthly Levels** (the first indicator) - Identify nearby price levels
- **Volume Profile** - Check volume during those months
- **RSI/MACD** - Identify momentum strength in specific months
### ⚠️ Important Notes
1. **Must use Monthly timeframe!** The indicator won't work correctly on other timeframes
2. **Statistical Sample** - More years = more reliable analysis
3. **Not a Guarantee** - Past performance doesn't guarantee future results, use additional analysis
4. **Adjust Colors** - If hard to see, change colors in settings
### 🎨 Tips for Optimal Experience
- **Zoom Out** - See more years at a glance
- **Clean Chart** - Remove unnecessary indicators for clear analysis
- **Compare Stocks** - Check multiple stocks for the same month
- **Document Findings** - Take screenshots and save insights for future reference
### 📊 Recommended Statistics
After identifying an interesting month:
- Calculate success rate (green / total candles)
- Check average volatility
- Identify outlier years and investigate what happened
- Plan entry/exit strategy
### 🚀 Who Is This Indicator For?
✅ **Swing Traders** - Plan medium-term trades
✅ **Seasonal Investors** - Exploit cyclical patterns
✅ **Technical Analysts** - Understand historical behavior
✅ **Portfolio Managers** - Time entries and exits
---
### 📝 Summary
The Monthly Color Marker indicator is a powerful and easy-to-use tool for identifying seasonal patterns. The combination of clear visualization with flexible parameters makes it an essential tool for any trader seeking a statistical edge in the market.
**Recommendation:** Start with 25 years back, analyze 2-3 key months, and build a data-driven strategy.
---
**Version:** 4.0
**Compatibility:** Pine Script v5
**Timeframe:** Monthly only
**Author:** 954
## 📊 Monthly Color Marker - סימון חודשים היסטוריים
### תיאור כללי
אינדיקטור ייחודי המאפשר לזהות במהירות את כל הנרות החודשיים מחודש ספציפי לאורך השנים. האינדיקטור מסמן את הנרות בצבעים שונים בהתאם לכיוון התנועה (עלייה/ירידה), ומאפשר ניתוח מהיר של דפוסים עונתיים והתנהגות מחזורית של המניה או הנכס.
### 🎯 מטרת האינדיקטור
- **זיהוי דפוסים עונתיים (Seasonality)** - מציאת מגמות חוזרות בחודשים מסוימים
- **ניתוח היסטורי מהיר** - ראייה ויזואלית של ביצועי החודש לאורך השנים
- **זיהוי כיווניות** - הבנה מיידית האם החודש נוטה להיות שורי או דובי
- **תכנון מסחר עונתי** - בניית אסטרטגיות מבוססות מחזוריות
### ⚙️ פרמטרים מתכווננים
1. **חודש לסימון (1-12)**
- בחירת החודש הרצוי לניתוח
- 1 = ינואר, 2 = פברואר... 12 = דצמבר
- ברירת מחדל: 11 (נובמבר)
2. **שנים אחורה (1-50)**
- קובע כמה שנים אחורה לסרוק
- מומלץ: 10-25 שנים לקבלת תמונה סטטיסטית מהימנה
- ברירת מחדל: 25 שנים
3. **צבע נר עולה**
- צבע לסימון נרות שורים (close > open)
- ברירת מחדל: ירוק
- ניתן להתאים לסכמת הצבעים האישית
4. **צבע נר יורד**
- צבע לסימון נרות דוביים (close < open)
- ברירת מחדל: אדום
- ניתן להתאים לסכמת הצבעים האישית
5. **צבע את השנה הנוכחית**
- האם לכלול את החודש הנוכחי בסימון
- שימושי כאשר החודש טרם הסתיים
- ברירת מחדל: כן
### 📈 איך להשתמש באינדיקטור
#### שלב 1: הוספה לגרף
1. עבור לטיימפריים **חודשי (Monthly)** - חובה!
2. הוסף את האינדיקטור לגרף
3. בחר את החודש שאתה רוצה לנתח
#### שלב 2: ניתוח ראשוני
- **ספור נרות ירוקים מול אדומים** - מה היחס?
- **חפש דפוסים** - האם יש שנים שבהן החודש תמיד עולה/יורד?
- **זהה חריגים** - שנים שבהן ההתנהגות הייתה שונה
#### שלב 3: קבלת החלטות
- **רוב ירוקים** → סטטיסטית החודש נוטה לעלות
- **רוב אדומים** → סטטיסטית החודש נוטה לרדת
- **מעורב** → אין דפוס עונתי ברור
### 💡 דוגמאות שימוש
**דוגמה 1: "Santa Claus Rally"**
- בחר חודש 12 (דצמבר)
- בדוק אם יש רוב נרות ירוקים
- אם כן, זה מאשר את האפקט הידוע של עליות בסוף השנה
**דוגמה 2: "September Effect"**
- בחר חודש 9 (ספטמבר)
- היסטורית, ספטמבר נחשב לחודש חלש
- האם הנתונים תומכים בכך במניה זו?
**דוגמה 3: דיווחים רבעוניים**
- זהה בחודש אילו נפרסמים דיווחים
- בדוק את התגובה ההיסטורית
- תכנן כניסה/יציאה בהתאם
### 🔍 שילוב עם אינדיקטורים אחרים
האינדיקטור עובד מצוין בשילוב עם:
- **Historical Monthly Levels** (האינדיקטור הראשון) - זיהוי רמות מחיר קרובות
- **Volume Profile** - בדיקת ווליום באותם חודשים
- **RSI/MACD** - זיהוי כוח המומנטום בחודשים ספציפיים
### ⚠️ הערות חשובות
1. **חובה להשתמש בטיימפריים חודשי!** האינדיקטור לא יעבוד נכון בטיימפריים אחרים
2. **מדגם סטטיסטי** - ככל שיש יותר שנים, הניתוח מהימן יותר
3. **לא ערובה** - עבר לא מבטיח עתיד, השתמש בניתוח נוסף
4. **התאם צבעים** - אם קשה לראות, שנה את הצבעים בהגדרות
### 🎨 טיפים לחוויית שימוש מיטבית
- **זום אאוט** - ראה יותר שנים במבט אחד
- **נקה גרף** - הסר אינדיקטורים מיותרים לניתוח ברור
- **השווה מניות** - בדוק מספר מניות לאותו חודש
- **תעד ממצאים** - צלם מסך ושמור תובנות לעתיד
### 📊 סטטיסטיקה מומלצת
לאחר שזיהית חודש מעניין:
- חשב אחוז הצלחה (ירוקים / כל הנרות)
- בדוק תנודתיות ממוצעת
- זהה שנים חריגות ובדוק מה קרה אז
- תכנן אסטרטגיית כניסה/יציאה
### 🚀 למי מתאים האינדיקטור?
✅ **סווינג טריידרים** - תכנון עסקאות לטווח בינוני
✅ **משקיעים עונתיים** - ניצול דפוסים מחזוריים
✅ **אנליסטים טכניים** - הבנת התנהגות היסטורית
✅ **מנהלי תיקים** - תזמון כניסות ויציאות
---
### 📝 סיכום
אינדיקטור Monthly Color Marker הוא כלי חזק וקל לשימוש לזיהוי דפוסים עונתיים. השילוב של ויזואליזציה ברורה עם פרמטרים גמישים הופך אותו לכלי חיוני לכל טריידר המחפש יתרון סטטיסטי בשוק.
**המלצה:** התחל עם 25 שנים אחורה, נתח 2-3 חודשים מרכזיים, ובנה אסטרטגיה מבוססת נתונים.
---
**גרסה:** 4.0
**תאימות:** Pine Script v5
**טיימפריים:** חודשי בלבד
**מחבר:** [954
---

Market Opening Time### TradingView Pine Script "Market Opening Time" Explanation
This Pine Script (`@version=5`) is an indicator that visually highlights market trading sessions (Sydney, London, New York, etc.) by changing the chart's background color. It adjusts for U.S. and Australian Daylight Saving Time (DST).
---
#### **1. Overview**
- **Purpose**: Changes the chart's background color based on UTC time zones to highlight market sessions.
- **Features**:
- Automatically adjusts for U.S. DST (2nd Sunday of March to 1st Sunday of November) and Australian DST (1st Sunday of October to 1st Sunday of April).
- Assigns colors to four time zones (00:00, 06:30, 14:00, 21:00).
- **Use Case**: Helps forex/stock traders identify active market sessions.
---
#### **2. Key Logic**
- **DST Detection**:
- `f_isUSDst`: Checks U.S. DST status.
- `f_isAustraliaDst`: Checks Australian DST status.
- **Time Adjustment** (`f_getAdjustedTime`):
- U.S. DST off: Shifts `time3` (14:00) forward by 1 hour.
- Australian DST off: Shifts `time4` (21:00) forward by 1 hour.
- **Time Conversion** (`f_timeToMinutes`): Converts time (e.g., "14:00") to minutes (e.g., 840).
- **Current Time** (`f_currentTimeInMinutes`): Gets UTC time in minutes.
- **Background Color** (`f_getBackgroundColor`):
- Applies colors based on time ranges:
- 00:00–06:30: Orange (Asia)
- 06:30–14:00: Purple (London)
- 14:00–21:00: Blue (New York, DST-adjusted)
- 21:00–00:00: Red (Sydney, DST-adjusted)
- Outside ranges: Gray
---
#### **3. Settings**
- **Time Zones**:
- `time1` = 00:00 (Orange)
- `time2` = 06:30 (Purple)
- `time3` = 14:00 (Blue, DST-adjusted)
- `time4` = 21:00 (Red, DST-adjusted)
- **Colors**: Transparency set to 90 for visibility.
---
#### **4. Example**
- **September 5, 2025, 10:25 PM JST (13:25 UTC)**:
- U.S. DST active, Australian DST inactive.
- 13:25 UTC falls between `time2` (06:30) and `time3` (14:00) → Background is **Purple** (London session).
- **Effect**: Background color changes dynamically to reflect active sessions.
---
#### **5. Customization**
- Modify `time1`–`time4` or colors for different sessions.
- Add time zones for other markets (e.g., Tokyo).
---
#### **6. Notes**
- Uses UTC; ensure chart is set to UTC.
- DST rules are U.S./Australia-specific; verify for other regions.
A simple, visual tool for tracking market sessions.
----
### TradingView Pine Script「Market Opening Time」解説
このPine Script(`@version=5`)は、市場の取引時間帯(シドニー、ロンドン、ニューヨークなど)を背景色で視覚化するインジケーターです。米国とオーストラリアの夏時間(DST)を考慮し、時間帯を調整します。
---
#### **1. 概要**
- **目的**: UTC基準の時間帯に基づき、チャートの背景色を変更して市場セッションを強調。
- **機能**:
- 米国DST(3月第2日曜~11月第1日曜)とオーストラリアDST(10月第1日曜~4月第1日曜)を自動調整。
- 4つの時間帯(00:00、06:30、14:00、21:00)に色を割り当て。
- **用途**: FXや株式トレーダーが市場のアクティブ時間を把握。
---
#### **2. 主要ロジック**
- **DST判定**:
- `f_isUSDst`: 米国DSTを判定。
- `f_isAustraliaDst`: オーストラリアDSTを判定。
- **時間調整** (`f_getAdjustedTime`):
- 米国DST非適用時: `time3`(14:00)を1時間遅延。
- オーストラリアDST非適用時: `time4`(21:00)を1時間遅延。
- **時間変換** (`f_timeToMinutes`): 時間(例: "14:00")を分単位(840)に変換。
- **現在時刻** (`f_currentTimeInMinutes`): UTCの現在時刻を分単位で取得。
- **背景色** (`f_getBackgroundColor`):
- 時間帯に応じた色を適用:
- 00:00~06:30: オレンジ(アジア)
- 06:30~14:00: 紫(ロンドン)
- 14:00~21:00: 青(ニューヨーク、DST調整)
- 21:00~00:00: 赤(シドニー、DST調整)
- 時間外: グレー
---
#### **3. 設定**
- **時間帯**:
- `time1` = 00:00(オレンジ)
- `time2` = 06:30(紫)
- `time3` = 14:00(青、DST調整)
- `time4` = 21:00(赤、DST調整)
- **色**: 透明度90で視認性確保。
---
#### **4. 使用例**
- **2025年9月5日22:25 JST(13:25 UTC)**:
- 米国DST適用、豪DST非適用。
- 13:25は`time2`(06:30)~`time3`(14:00)の間 → 背景色は**紫**(ロンドン)。
- **効果**: 時間帯に応じて背景色が変化し、市場セッションを直感的に把握。
---
#### **5. カスタマイズ**
- 時間帯(`time1`~`time4`)や色を変更可能。
- 他の市場(例: 東京)に対応する時間帯を追加可能。
---
#### **6. 注意点**
- UTC基準のため、チャート設定をUTCに。
- DSTルールは米国・オーストラリア準拠。他地域では要確認。
シンプルで視覚的な市場時間インジケーターです。

Live Market - Performance MonitorLive Market — Performance Monitor
Study material (no code) — step-by-step training guide for learners
________________________________________
1) What this tool is — short overview
This indicator is a live market performance monitor designed for learning. It scans price, volume and volatility, detects order blocks and trendline events, applies filters (volume & ATR), generates trade signals (BUY/SELL), creates simple TP/SL trade management, and renders a compact dashboard summarizing market state, risk and performance metrics.
Use it to learn how multi-factor signals are constructed, how Greeks-style sensitivity is replaced by volatility/ATR reasoning, and how a live dashboard helps monitor trade quality.
________________________________________
2) Quick start — how a learner uses it (step-by-step)
1. Add the indicator to a chart (any ticker / timeframe).
2. Open inputs and review the main groups: Order Block, Trendline, Signal Filters, Display.
3. Start with defaults (OB periods ≈ 7, ATR multiplier 0.5, volume threshold 1.2) and observe the dashboard on the last bar.
4. Walk the chart back in time (use the last-bar update behavior) and watch how signals, order blocks, trendlines, and the performance counters change.
5. Run the hands-on labs below to build intuition.
________________________________________
3) Main configurable inputs (what you can tweak)
• Order Block Relevant Periods (default ~7): number of consecutive candles used to define an order block.
• Min. Percent Move for Valid OB (threshold): minimum percent move required for a valid order block.
• Number of OB Channels: how many past order block lines to keep visible.
• Trendline Period (tl_period): pivot lookback for detecting highs/lows used to draw trendlines.
• Use Wicks for Trendlines: whether pivot uses wicks or body.
• Extension Bars: how far trendlines are projected forward.
• Use Volume Filter + Volume Threshold Multiplier (e.g., 1.2): requires volume to be greater than multiplier × average volume.
• Use ATR Filter + ATR Multiplier: require bar range > ATR × multiplier to filter noise.
• Show Targets / Table settings / Colors for visualization.
________________________________________
4) Core building blocks — what the script computes (plain language)
Price & trend:
• Spot / LTP: current close price.
• EMA 9 / 21 / 50: fast, medium, slow moving averages to define short/medium trend.
o trend_bullish: EMA9 > EMA21 > EMA50
o trend_bearish: EMA9 < EMA21 < EMA50
o trend_neutral: otherwise
Volatility & noise:
• ATR (14): average true range used for dynamic target and filter sizing.
• dynamic_zone = ATR × atr_multiplier: minimum bar range required for meaningful move.
• Annualized volatility: stdev of price changes × sqrt(252) × 100 — used to classify volatility (HIGH/MEDIUM/LOW).
Momentum & oscillators:
• RSI 14: overbought/oversold indicator (thresholds 70/30).
• MACD: EMA(12)-EMA(26) and a 9-period signal line; histogram used for momentum direction and strength.
• Momentum (ta.mom 10): raw momentum over 10 bars.
Mean reversion / band context:
• Bollinger Bands (20, 2σ): upper, mid, lower.
o price_position measures where price sits inside the band range as 0–100.
Volume metrics:
• avg_volume = SMA(volume, 20) and volume_spike = volume > avg_volume × volume_threshold
o volume_ratio = volume / avg_volume
Support & Resistance:
• support_level = lowest low over 20 bars
• resistance_level = highest high over 20 bars
• current_position = percent of price between support & resistance (0–100)
________________________________________
5) Order Block detection — concept & logic
What it tries to find: a bar (the base) followed by N candles in the opposite direction (a classical order block setup), with a minimum % move to qualify. The script records the high/low of the base candle, averages them, and plots those levels as OB channels.
How learners should think about it (conceptual):
1. An order block is a signature area where institutions (theory) left liquidity — often seen as a large bar followed by a sequence of directional candles.
2. This indicator uses a configurable number of subsequent candles to confirm that the pattern exists.
3. When found, it stores and displays the base candle’s high/low area so students can see how price later reacts to those zones.
Implementation note for learners: the tool keeps a limited history of OB lines (ob_channels). When new OBs exceed the count, the oldest lines are removed — good practice to avoid clutter.
________________________________________
6) Trendline detection — idea & interpretation
• The script finds pivot highs and lows using a symmetric lookback (tl_period and half that as right/left).
• It then computes a trendline slope from successive pivots and projects the line forward (extension_bars).
• Break detection: Resistance break = close crosses above the projected resistance line; Support break = close crosses below projected support.
Learning tip: trendlines here are computed from pivot points and time. Watch how changing tl_period (bigger = smoother, fewer pivots) alters the trendlines and break signals.
________________________________________
7) Signal generation & filters — step-by-step
1. Primary triggers:
o Bullish trigger: order block bullish OR resistance trendline break.
o Bearish trigger: bearish order block OR support trendline break.
2. Filters applied (both must pass unless disabled):
o Volume filter: volume must be > avg_volume × volume_threshold.
o ATR filter: bar range (high-low) must exceed ATR × atr_multiplier.
o Not in an existing trade: new trades only start if trade_active is false.
3. Trend confirmation:
o The primary trigger is only confirmed if trend is bullish/neutral for buys or bearish/neutral for sells (EMA alignment).
4. Result:
o When confirmed, a long or short trade is activated with TP/SL calculated from ATR multiples.
________________________________________
8) Trade management — what the tool does after a signal
• Entry management: the script marks a trade as trade_active and sets long_trade or short_trade flags.
• TP & SL rules:
o Long: TP = high + 2×ATR ; SL = low − 1×ATR
o Short: TP = low − 2×ATR ; SL = high + 1×ATR
• Monitoring & exit:
o A trade closes when price reaches TP or SL.
o When TP/SL hit, the indicator updates win_count and total_pnl using a very simple calculation (difference between TP/SL and previous close).
o Visual lines/labels are drawn for TP and updated as the trade runs.
Important learner notes:
• The script does not store a true entry price (it uses close in its P&L math), so PnL is an approximation — treat this as a learning proxy, not a position accounting system.
• There’s no sizing, slippage, or fee accounted — students must manually factor these when translating to real trades.
• This indicator is not a backtesting strategy; strategy.* functions would be needed for rigorous backtest results.
________________________________________
9) Signal strength & helper utilities
• Signal strength is a composite score (0–100) made up of four signals worth 25 points each:
1. RSI extreme (overbought/oversold) → 25
2. Volume spike → 25
3. MACD histogram magnitude increasing → 25
4. Trend existence (bull or bear) → 25
• Progress bars (text glyphs) are used to visually show RSI and signal strength on the table.
Learning point: composite scoring is a way to combine orthogonal signals — study how changing weights changes outcomes.
________________________________________
10) Dashboard — how to read each section (walkthrough)
The dashboard is split into sections; here's how to interpret them:
1. Market Overview
o LTP / Change%: immediate price & daily % change.
2. RSI & MACD
o RSI value plus progress bar (overbought 70 / oversold 30).
o MACD histogram sign indicates bullish/bearish momentum.
3. Volume Analysis
o Volume ratio (current / average) and whether there’s a spike.
4. Order Block Status
o Buy OB / Sell OB: the average base price of detected order blocks or “No Signal.”
5. Signal Status
o 🔼 BUY or 🔽 SELL if confirmed, or ⚪ WAIT.
o No-trade vs Active indicator summarizing market readiness.
6. Trend Analysis
o Trend direction (from EMAs), market sentiment score (composite), volatility level and band/position metrics.
7. Performance
o Win Rate = wins / signals (percentage)
o Total PnL = cumulative PnL (approximate)
o Bull / Bear Volume = accumulated volumes attributable to signals
8. Support & Resistance
o 20-bar highest/lowest — use as nearby reference points.
9. Risk & R:R
o Risk Level from ATR/price as a percent.
o R:R Ratio computed from TP/SL if a trade is active.
10. Signal Strength & Active Trade Status
• Numeric strength + progress bar and whether a trade is currently active with TP/SL display.
________________________________________
11) Alerts — what will notify you
The indicator includes pre-built alert triggers for:
• Bullish confirmed signal
• Bearish confirmed signal
• TP hit (long/short)
• SL hit (long/short)
• No-trade zone
• High signal strength (score > 75%)
Training use: enable alerts during a replay session to be notified when the indicator would have signalled.
________________________________________
12) Labs — hands-on exercises for learners (step-by-step)
Lab A — Order Block recognition
1. Pick a 15–30 minute timeframe on a liquid ticker.
2. Use default OB periods (7). Mark each time the dashboard shows a Buy/Sell OB.
3. Manually inspect the chart at the base candle and the following sequence — draw the OB zone by hand and watch later price reactions to it.
4. Repeat with OB periods 5 and 10; note stability vs noise.
Lab B — Trendline break confirmation
1. Increase trendline period (e.g., 20), watch trendlines form from pivots.
2. When a resistance break is flagged, compare with MACD & volume: was momentum aligned?
3. Note false breaks vs confirmed moves — change extension_bars to see projection effects.
Lab C — Filter sensitivity
1. Toggle Use Volume Filter off, and record the number and quality of signals in a 2-day window.
2. Re-enable volume filter and change threshold from 1.2 → 1.6; note how many low-quality signals are filtered out.
Lab D — Trade management simulation
1. For each signalled trade, record the time, close entry approximation, TP, SL, and eventual hit/miss.
2. Compute actual PnL if you had entered at the open of the next bar to compare with the script’s PnL math.
3. Tabulate win rate and average R:R.
Lab E — Performance review & improvement
1. Build a spreadsheet of signals over 30–90 periods with columns: Date, Signal type, Entry price (real), TP, SL, Exit, PnL, Notes.
2. Analyze which filters or indicators contributed most to winners vs losers and adjust weights.
________________________________________
13) Common pitfalls, assumptions & implementation notes (things to watch)
• P&L simplification: total_pnl uses close as a proxy entry price. Real entry/exit prices and slippage are not recorded — so PnL is approximate.
• No position sizing or money management: the script doesn’t compute position size from equity or risk percent.
• Signal confirmation logic: composite "signal_strength" is a simple 4×25 point scheme — explore different weights or additional signals.
• Order block detection nuance: the script defines the base candle and checks the subsequent sequence. Be sure to verify whether the intended candle direction (base being bullish vs bearish) aligns with academic/your trading definition — read the code carefully and test.
• Trendline slope over time: slope is computed using timestamps; small differences may make lines sensitive on very short timeframes — using bar_index differences is usually more stable.
• Not a true backtester: to evaluate performance statistically you must transform the logic into a strategy script that places hypothetical orders and records exact entry/exit prices.
________________________________________
14) Suggested improvements for advanced learners
• Record true entry price & timestamp for accurate PnL.
• Add position sizing: risk % per trade using SL distance and account size.
• Convert to strategy. (Pine Strategy)* to run formal backtests with equity curves, drawdowns, and metrics (Sharpe, Sortino).
• Log trades to an external spreadsheet (via alerts + webhook) for offline analysis.
• Add statistics: average win/loss, expectancy, max drawdown.
• Add additional filters: news time blackout, market session filters, multi-timeframe confirmation.
• Improve OB detection: combine wick/body, volume spike at base bar, and liquidity sweep detection.
________________________________________
15) Glossary — quick definitions
• ATR (Average True Range): measure of typical range; used to size targets and stops.
• EMA (Exponential Moving Average): trend smoothing giving more weight to recent prices.
• RSI (Relative Strength Index): momentum oscillator; >70 overbought, <30 oversold.
• MACD: momentum oscillator using difference of two EMAs.
• Bollinger Bands: volatility bands around SMA.
• Order Block: a base candle area with subsequent confirmation candles; a zone of institutional interest (learning model).
• Pivot High/Low: local turning point defined by candles on both sides.
• Signal Strength: combined score from multiple indicators.
• Win Rate: proportion of signals that hit TP vs total signals.
• R:R (Risk:Reward): ratio of potential reward (TP distance) to risk (entry to SL).
________________________________________
16) Limitations & assumptions (be explicit)
• This is an indicator for learning — not a trading robot or broker connection.
• No slippage, fees, commissions or tie-in to real orders are considered.
• The logic is heuristic (rule-of-thumb), not a guarantee of performance.
• Results are sensitive to timeframe, market liquidity, and parameter choices.
________________________________________
17) Practical classroom / study plan (4 sessions)
• Session 1 — Foundations: Understand EMAs, ATR, RSI, MACD, Bollinger Bands. Run the indicator and watch how these numbers change on a single day.
• Session 2 — Zones & Filters: Study order blocks and trendlines. Test volume & ATR filters and note changes in false signals.
• Session 3 — Simulated trading: Manually track 20 signals, compute real PnL and compare to the dashboard.
• Session 4 — Improvement plan: Propose changes (e.g., better PnL accounting, alternative OB rule) and test their impact.
________________________________________
18) Quick reference checklist for each signal
1. Was an order block or trendline break detected? (primary trigger)
2. Did volume meet threshold? (filter)
3. Did ATR filter (bar size) show a real move? (filter)
4. Was trend aligned (EMA 9/21/50)? (confirmation)
5. Signal confirmed → mark entry approximation, TP, SL.
6. Monitor dashboard (Signal Strength, Volatility, No-trade zone, R:R).
7. After exit, log real entry/exit, compute actual PnL, update spreadsheet.
________________________________________
19) Educational caveat & final note
This tool is built for training and analysis: it helps you see how common technical building blocks combine into trade ideas, but it is not a trading recommendation. Use it to develop judgment, to test hypotheses, and to design robust systems with proper backtesting and risk control before risking capital.
________________________________________
20) Disclaimer (must include)
Training & Educational Only — This material and the indicator are provided for educational purposes only. Nothing here is investment advice or a solicitation to buy or sell financial instruments. Past simulated or historical performance does not predict future results. Always perform full backtesting and risk management, and consider seeking advice from a qualified financial professional before trading with real capital.
________________________________________

ADX + Volume Strategy### Strategy Description: ADX and Volume-Based Trading Strategy
This strategy is designed to identify strong market trends using the **Average Directional Index (ADX)** and confirm trading signals with **Volume**. The idea behind the strategy is to enter trades only when the market shows a strong trend (as indicated by ADX) and when the price movement is supported by high trading volume. This combination helps filter out weaker signals and provides more reliable entries into positions.
### Key Indicators:
1. **ADX (Average Directional Index)**:
- **Purpose**: ADX is a technical indicator that measures the strength of a trend, regardless of its direction (up or down).
- **Usage**: The strategy uses ADX to determine whether the market is trending strongly. If ADX is above a certain threshold (default is 25), it indicates that a strong trend is present.
- **Directional Indicators**:
- **DI+ (Directional Indicator Plus)**: Indicates the strength of the upward price movement.
- **DI- (Directional Indicator Minus)**: Indicates the strength of the downward price movement.
- ADX does not indicate the direction of the trend but confirms that a trend exists. DI+ and DI- are used to determine the direction.
2. **Volume**:
- **Purpose**: Volume is a key indicator for confirming the strength of a price movement. High volume suggests that a large number of market participants are supporting the movement, making it more likely to continue.
- **Usage**: The strategy compares the current volume to the 20-period moving average of the volume. The trade signal is confirmed if the current volume is greater than the average volume by a specified **Volume Multiplier** (default multiplier is 1.5). This ensures that the trade is supported by strong market participation.
### Strategy Logic:
#### **Entry Conditions:**
1. **Long Position** (Buy):
- **ADX** is above the threshold (default is 25), indicating a strong trend.
- **DI+ > DI-**, signaling that the market is trending upward.
- The **current volume** is greater than the 20-period average volume multiplied by the **Volume Multiplier** (e.g., 1.5), indicating that the upward price movement is backed by sufficient market activity.
2. **Short Position** (Sell):
- **ADX** is above the threshold (default is 25), indicating a strong trend.
- **DI- > DI+**, signaling that the market is trending downward.
- The **current volume** is greater than the 20-period average volume multiplied by the **Volume Multiplier** (e.g., 1.5), indicating that the downward price movement is backed by strong selling activity.
#### **Exit Conditions**:
- Positions are closed when the opposite signal appears:
- **For long positions**: Close when the short conditions are met (ADX still above the threshold, DI- > DI+, and the volume condition holds).
- **For short positions**: Close when the long conditions are met (ADX still above the threshold, DI+ > DI-, and the volume condition holds).
### Parameters:
- **ADX Period**: The period used to calculate ADX (default is 14). This controls how sensitive the ADX is to price movements.
- **ADX Threshold**: The minimum ADX value required for the strategy to consider the market trend as strong (default is 25). Higher values focus on stronger trends.
- **Volume Multiplier**: This parameter adjusts how much higher the current volume needs to be compared to the 20-period moving average for the signal to be valid. A value of 1.5 means the current volume must be 50% higher than the average volume.
### Example Trade Flow:
1. **Long Trade Example**:
- ADX > 25, confirming a strong trend.
- DI+ > DI-, confirming that the trend direction is upward.
- The current volume is 50% higher than the 20-period average volume (multiplied by 1.5).
- **Action**: Enter a long position.
2. **Short Trade Example**:
- ADX > 25, confirming a strong trend.
- DI- > DI+, confirming that the trend direction is downward.
- The current volume is 50% higher than the 20-period average volume.
- **Action**: Enter a short position.
### Strengths of the Strategy:
- **Trend Filtering**: The strategy ensures that trades are only taken when the market is trending strongly (confirmed by ADX) and that the price movement is supported by high volume, reducing the likelihood of false signals.
- **Volume Confirmation**: Using volume as confirmation provides an additional layer of reliability, as volume spikes often accompany sustained price moves.
- **Dual Signal Confirmation**: Both trend strength (ADX) and volume conditions must be met for a trade, making the strategy more robust.
### Weaknesses of the Strategy:
- **Limited Effectiveness in Range-Bound Markets**: Since the strategy relies on strong trends, it may underperform in sideways or non-trending markets where ADX stays below the threshold.
- **Lagging Nature of ADX**: ADX is a lagging indicator, which means that it may confirm the trend after it has already begun, potentially leading to late entries.
- **Volume Requirement**: In low-volume markets, the volume multiplier condition may not be met often, leading to fewer trade opportunities.
### Customization:
- **Adjust the ADX Threshold**: You can raise the threshold if you want to focus only on very strong trends, or lower it to capture moderate trends.
- **Adjust the Volume Multiplier**: You can change the multiplier to be more or less strict. A higher multiplier (e.g., 2.0) will require a stronger volume spike to confirm the signal, while a lower multiplier (e.g., 1.2) will allow more trades with weaker volume confirmation.
### Summary:
This ADX and Volume strategy is ideal for traders who want to follow strong trends while ensuring that the trend is supported by high trading volume. By combining a trend strength filter (ADX) and volume confirmation, the strategy aims to increase the probability of entering profitable trades while reducing the number of false signals. However, it may underperform in range-bound markets or in markets with low volume.
Trend Following ADX + Parabolic SAR### Strategy Description: Trend Following using **ADX** and **Parabolic SAR**
This strategy is designed to follow market trends using two popular indicators: **Average Directional Index (ADX)** and **Parabolic SAR**. The strategy attempts to enter trades when the market shows a strong trend (using ADX) and confirms the trend direction using the Parabolic SAR. Here's a breakdown:
### Key Indicators:
1. **ADX (Average Directional Index)**:
- **Purpose**: ADX measures the strength of a trend, regardless of direction.
- **Usage**: The strategy uses ADX to confirm that the market is trending. When ADX is above a certain threshold (e.g., 25), it indicates a strong trend.
- **Directional Indicators**:
- **DI+ (Directional Indicator Plus)**: Indicates upward movement strength.
- **DI- (Directional Indicator Minus)**: Indicates downward movement strength.
2. **Parabolic SAR**:
- **Purpose**: Parabolic SAR is a trend-following indicator used to identify potential reversals in the price direction.
- **Usage**: It provides specific price points above or below which the strategy confirms buy or sell signals.
### Strategy Logic:
#### **Entry Conditions**:
1. **Long Position** (Buy):
- **ADX** is above the threshold (default: 25), indicating a strong trend.
- **DI+ > DI-**, indicating the upward trend is stronger than the downward.
- The price is above the **Parabolic SAR** level, confirming the upward trend.
2. **Short Position** (Sell):
- **ADX** is above the threshold (default: 25), indicating a strong trend.
- **DI- > DI+**, indicating the downward trend is stronger than the upward.
- The price is below the **Parabolic SAR** level, confirming the downward trend.
#### **Exit Conditions**:
- Positions are closed when an opposite signal is detected.
- For example, if a long position is open and the conditions for a short position are met, the long position is closed, and a short position is opened.
### Parameters:
1. **ADX Period**: Defines the length of the period for the ADX calculation (default: 14).
2. **ADX Threshold**: The minimum value of ADX to confirm a strong trend (default: 25).
3. **Parabolic SAR Start**: The initial step for the SAR (default: 0.02).
4. **Parabolic SAR Increment**: The step increment for SAR (default: 0.02).
5. **Parabolic SAR Max**: The maximum step for SAR (default: 0.2).
### Example Trade Flow:
#### **Long Trade**:
1. ADX > 25, confirming a strong trend.
2. DI+ > DI-, indicating the market is trending upward.
3. The price is above the Parabolic SAR, confirming the upward direction.
4. **Action**: Enter a long (buy) position.
5. Exit the long position when a short signal is triggered (i.e., DI- > DI+, price below Parabolic SAR).
#### **Short Trade**:
1. ADX > 25, confirming a strong trend.
2. DI- > DI+, indicating the market is trending downward.
3. The price is below the Parabolic SAR, confirming the downward direction.
4. **Action**: Enter a short (sell) position.
5. Exit the short position when a long signal is triggered (i.e., DI+ > DI-, price above Parabolic SAR).
### Strengths of the Strategy:
- **Trend-Following**: It performs well in markets with strong trends, whether upward or downward.
- **Dual Confirmation**: The combination of ADX and Parabolic SAR reduces false signals by ensuring both trend strength and direction are considered before entering a trade.
### Weaknesses:
- **Range-Bound Markets**: This strategy may perform poorly in choppy, non-trending markets because both ADX and SAR are trend-following indicators.
- **Lagging Nature**: Since both ADX and SAR are lagging indicators, the strategy may enter trades after the trend has already started, potentially missing early profits.
### Customization:
- **ADX Threshold**: You can increase the threshold if you only want to trade in very strong trends, or lower it to capture more moderate trends.
- **SAR Parameters**: Adjusting the SAR `start`, `increment`, and `max` values will make the Parabolic SAR more or less sensitive to price changes.
### Summary:
This strategy combines the ADX and Parabolic SAR to take advantage of strong market trends. By confirming both trend strength (ADX) and trend direction (Parabolic SAR), it aims to enter high-probability trades in trending markets while minimizing false signals. However, it may struggle in sideways or non-trending markets.
For Educational purposes only !!!