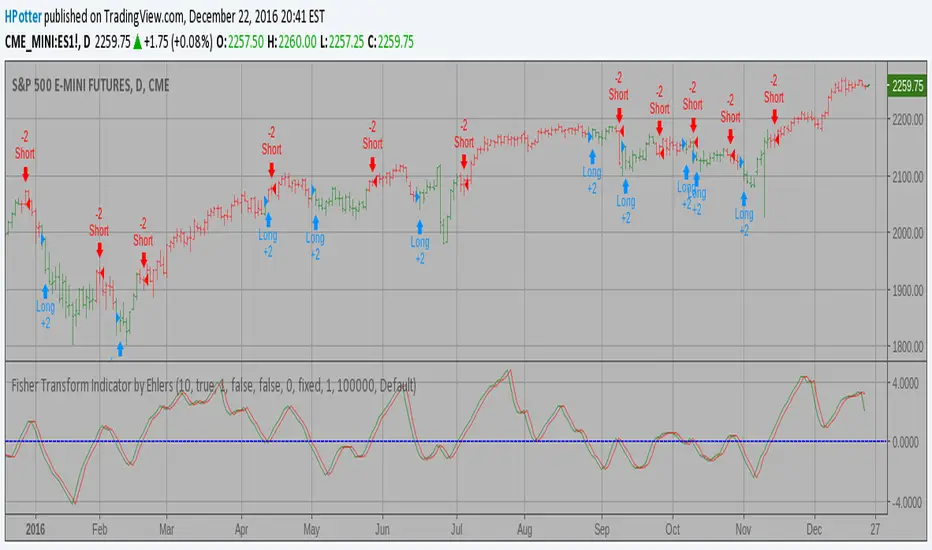
Fisher Transform Indicator by Ehlers Backtest v 2.0 Market prices do not have a Gaussian probability density function
as many traders think. Their probability curve is not bell-shaped.
But trader can create a nearly Gaussian PDF for prices by normalizing
them or creating a normalized indicator such as the relative strength
index and applying the Fisher transform. Such a transformed output
creates the peak swings as relatively rare events.
Fisher transform formula is: y = 0.5 * ln ((1+x)/(1-x))
The sharp turning points of these peak swings clearly and unambiguously
identify price reversals in a timely manner.
For signal used zero.
You can change long to short in the Input Settings
Please, use it only for learning or paper trading. Do not for real trading.
Tìm kiếm tập lệnh với "通达信+选股公式+换手率+0.5+源码"
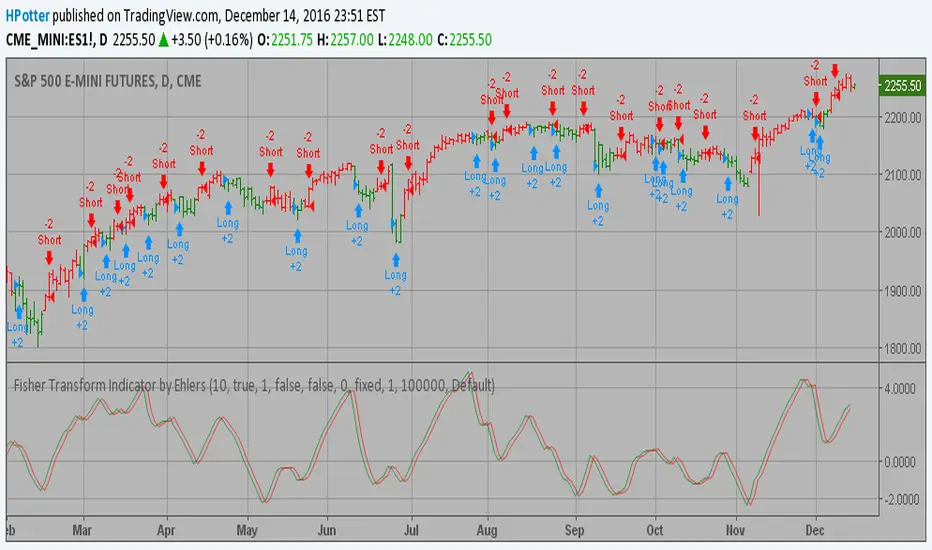
Fisher Transform Indicator by Ehlers Backtest Market prices do not have a Gaussian probability density function
as many traders think. Their probability curve is not bell-shaped.
But trader can create a nearly Gaussian PDF for prices by normalizing
them or creating a normalized indicator such as the relative strength
index and applying the Fisher transform. Such a transformed output
creates the peak swings as relatively rare events.
Fisher transform formula is: y = 0.5 * ln ((1+x)/(1-x))
The sharp turning points of these peak swings clearly and unambiguously
identify price reversals in a timely manner.
You can change long to short in the Input Settings
Please, use it only for learning or paper trading. Do not for real trading.
MACDouble + RSI (rec. 15min-2hr intrv) Uses two sets of MACD plus an RSI to either long or short. All three indicators trigger buy/sell as one (ie it's not 'IF MACD1 OR MACD2 OR RSI > 1 = buy", its more like "IF 1 AND 2 AND RSI=buy", all 3 match required for trigger)
The MACD inputs should be tweaked depending on timeframe and what you are trading. If you are doing 1, 3, 5 min or real frequent trading then 21/44/20 and 32/66/29 or other high value MACDs should be considered. If you are doing longer intervals like 2, 3, 4hr then consider 9/19/9 and 21/44/20 for MACDs (experiment! I picked these example #s randomly).
Ideal usage for the MACD sets is to have MACD2 inputs at around 1.5x, 2x, or 3x MACD1's inputs.
Other settings to consider: try having fastlength1=macdlength1 and then (fastlength2 = macdlength2 - 2). Like 10/26/10 and 23/48/20. This seems to increase net profit since it is more likely to trigger before major price moves, but may decrease profitable trade %. Conversely, consider FL1=MCDL1 and FL2 = MCDL2 + (FL2 * 0.5). Example: 10/26/10 and 22/48/30 this can increase profitable trade %, though may cost some net profit.
Feel free to message me with suggestions or questions.

[JR] Multi Bollinger Heat BandsBollinger Bands, with incremented additional outer bands.
Set as you would normally, but with the addition of an incremental value for the added outer bands.
Defaults with Length 20, base multiplier of 2.0, and an Increment value of 0.5 for additional outer bands at 2.5 and 3.0. Adjust values to suite your needs.
All lines and zones have colour and formatting options available - because why not eh?

[AutoView] MovingAvg Cross - Video AttachedThere is nothing special or spectacular about this script. It's your standard Moving Average Cross Strategy. It is actually a built in script everyone has access to already. I only changed some of the settings and flipped the orders.
The reason I actually published this, is because people have been asking me what the best way to find the best settings for a strategy. So I made a YouTube video showing people how I personally do it. I took this built in strategy and within 5 minutes took it from a net profit loss and profit factor of 0.5 to a net profit win with a profit factor of 3-5.
Of course this is only on the 1 minute candles, so forward testing the strategy is a must as I do not recommend straight up taking this and trading it.
You can watch the video here:
www.youtube.com
Hope this helps everyone speed up their back testing and fine tuning their strategies.

Fisher Transform Indicator by Ehlers - Strategy Market prices do not have a Gaussian probability density function
as many traders think. Their probability curve is not bell-shaped.
But trader can create a nearly Gaussian PDF for prices by normalizing
them or creating a normalized indicator such as the relative strength
index and applying the Fisher transform. Such a transformed output
creates the peak swings as relatively rare events.
Fisher transform formula is: y = 0.5 * ln ((1+x)/(1-x))
The sharp turning points of these peak swings clearly and unambiguously
identify price reversals in a timely manner.

Fisher Transform Indicator by Ehlers Market prices do not have a Gaussian probability density function
as many traders think. Their probability curve is not bell-shaped.
But trader can create a nearly Gaussian PDF for prices by normalizing
them or creating a normalized indicator such as the relative strength
index and applying the Fisher transform. Such a transformed output
creates the peak swings as relatively rare events.
Fisher transform formula is: y = 0.5 * ln ((1+x)/(1-x))
The sharp turning points of these peak swings clearly and unambiguously
identify price reversals in a timely manner.

Indicators: Rainbow Charts Oscillator, Binary Wave and MAsRainbow Charts, by Mel Widner, is a trend detector. It uses recursively smoothed MAs (remember, this idea was proposed back in 1997 -- it was certainly cool back then!) and also builds an oscillator out of the MAs. Oscillator bands indicate the stability range.
I have also included a simple binary wave based on whether all the MAs are in an upward slope or not. If you see any value above 0.5 there, the trend is definitely up (all MAs pointing up).
More info:
www.traders.com
Here's my complete list of indicators (With these 3, the total count should be above 100 now...will update the list later today)
