Tìm kiếm tập lệnh với "3 ema"
COLLAR - RSI MACD EMACOLLAR - RSI MACD EMA
I created this "COLLAR" script by combining scripts from others.
Mentor Piet Vannoppen uses the COLLAR-technique in TC2000 to analyse charts. Because it didn't exist in TradingView, I created it. ; )
In the mean time my friend Vinpierke also created a script for the COLLAR-technique, in which he uses 4 colors.
Check these scripts. If you like it/them or have tips, let me/us know!


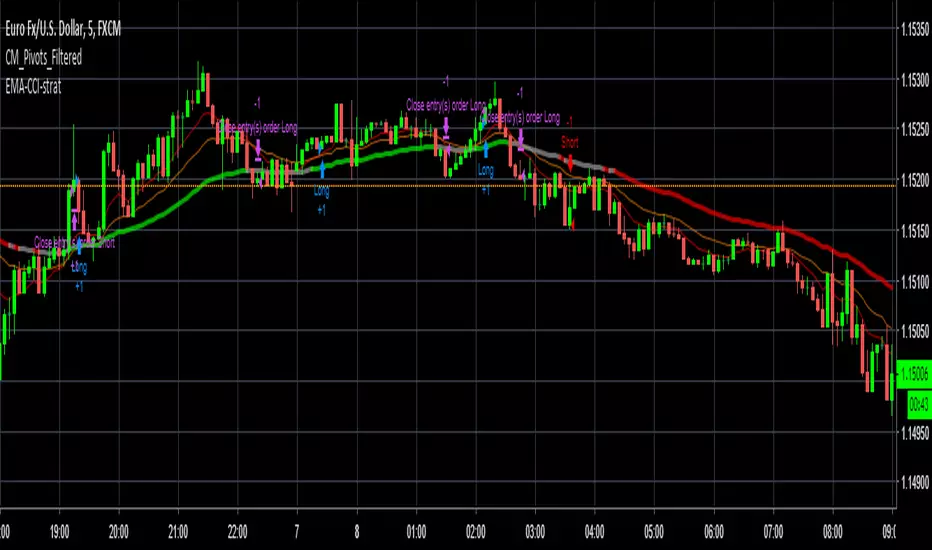
[Strategy] CCI EMA scalping [DEV]Recommended timeframe: 5M or higher
Based on EMA crosses and CCI levels.
Take profit can be also at Pivot levels like Daily/Weekly
Stop loss should be between 12-15 pips.
This strategy is still under development!
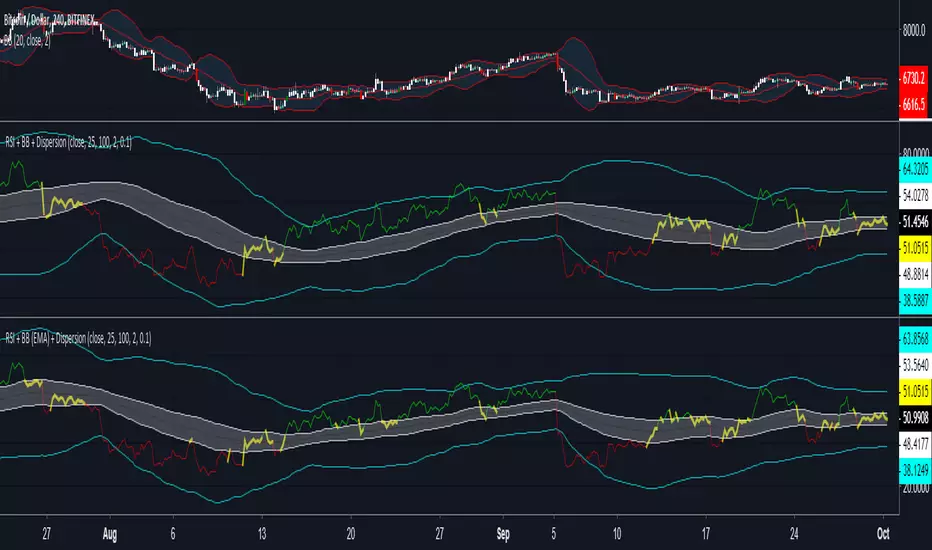
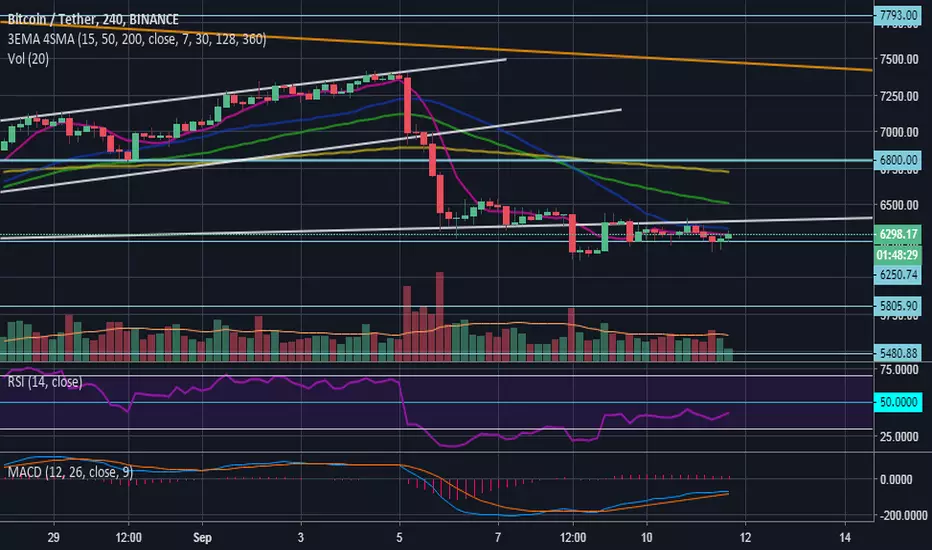
RSI + BB (EMA) + DispersionInitial data:
1) RSI
2) Bollinger Bands (Basis - EMA)
3) Dispersion (around basis)
Signal for purchase: RSI crosses the dispersion zone upwards
Signal for sale: RSI crosses the dispersion zone downwards
Buffer zone: white area, it is not recommended to make transactions.
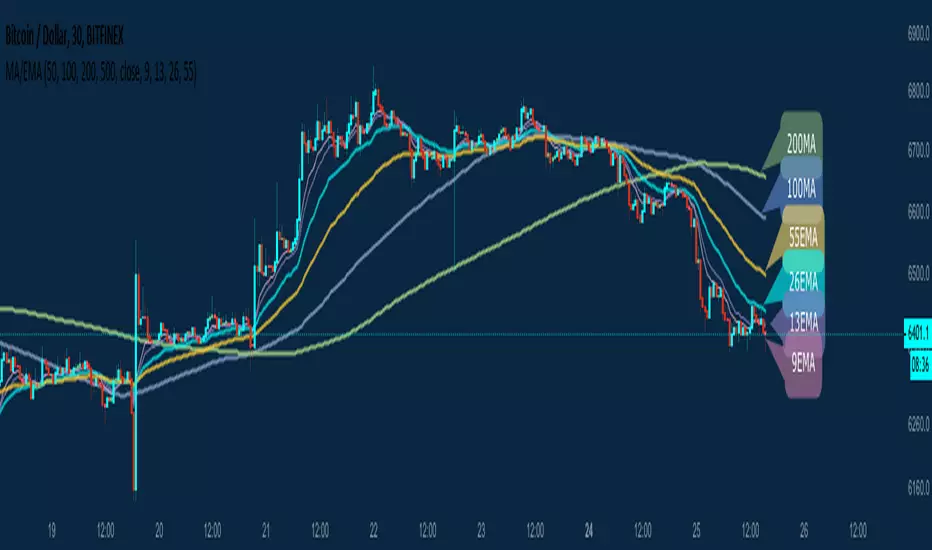
Ruler's Multiple Moving Averages - 8 EMA/MAA handy tool for those who need Multiple Moving Averages in a single indicator!
A great collection of 8 very powerful EMAs and SMAs including:
50MA 9EMA
100MA 13EMA
200MA 26EMA
500MA 55EMA
Of course, completely customizable to your own needs. No need to upgrade your Tradingview account to be able to use multiple MA indicators when you can have all of them in a single Indicator.
All feedback is welcome of course! Enjoy.

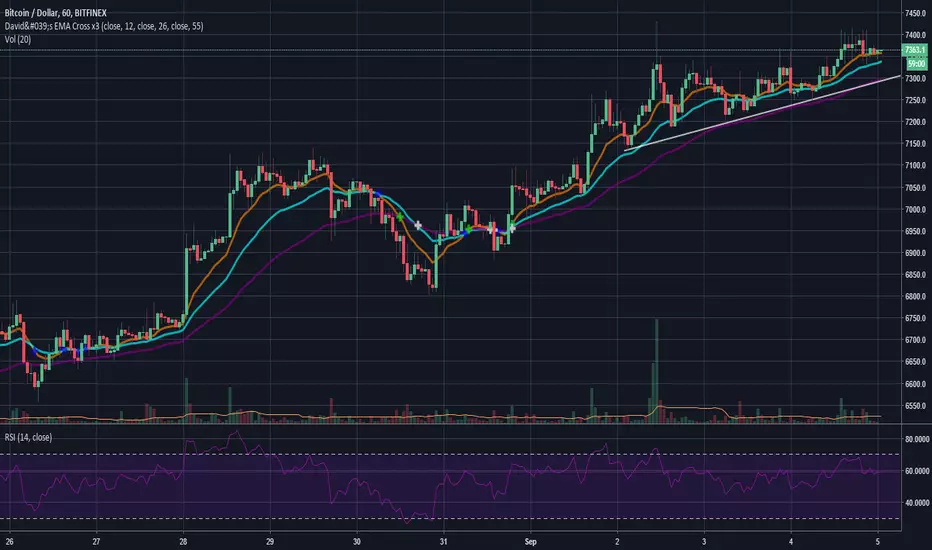
[STRATEGY]EMA 30/60 Cross Strategystrategy based on EMA 30/60 cross
works best on 4hr timeframes & high-midcaps

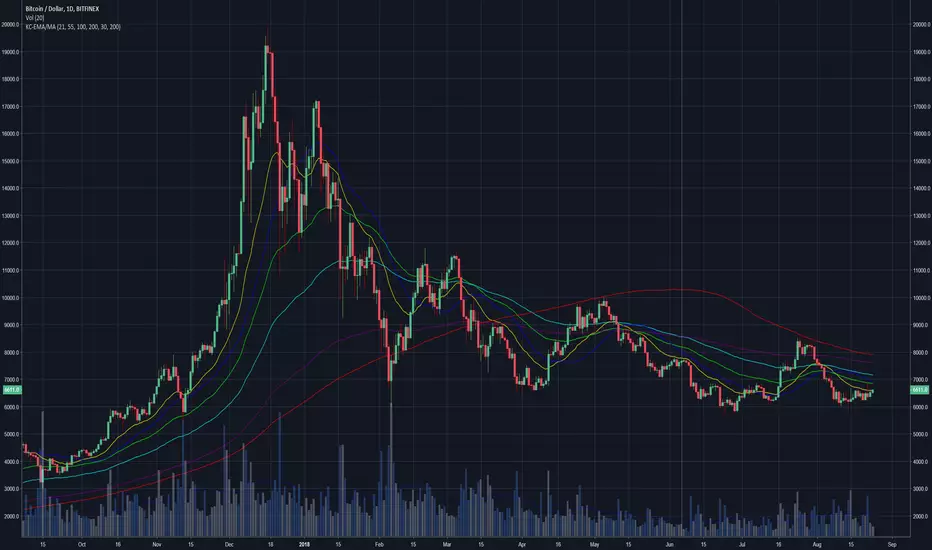
Krowns Cave EMA MA Combo A copy of the 4 EMA / 2 MA settings used by the man himself on 'Krown's Crypto Cave'.
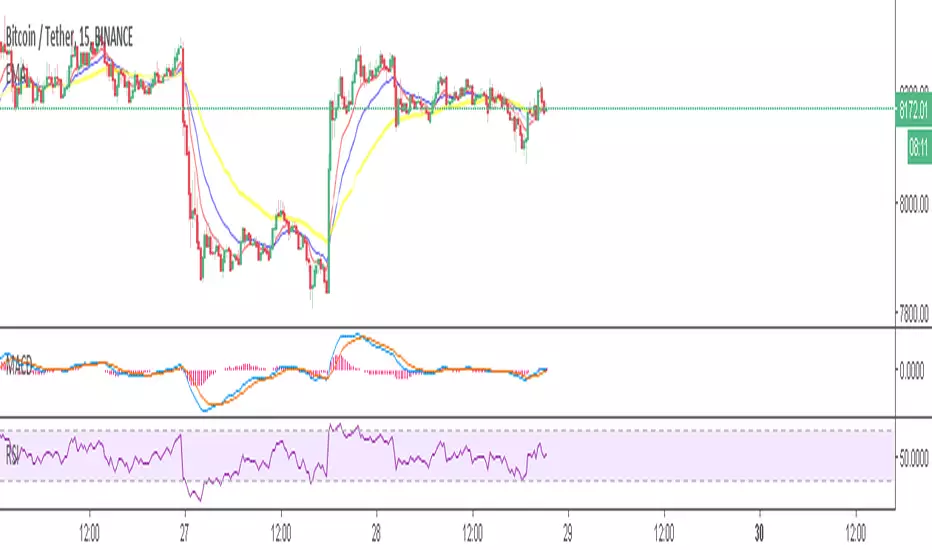
ZC - RSI and EMA It is a indicator that tries to predict when to buy and sell using RSI and EMA indicators together.
When the red columns over the blue columns that is the "buy signal". When it is not, it is a "sell signal".

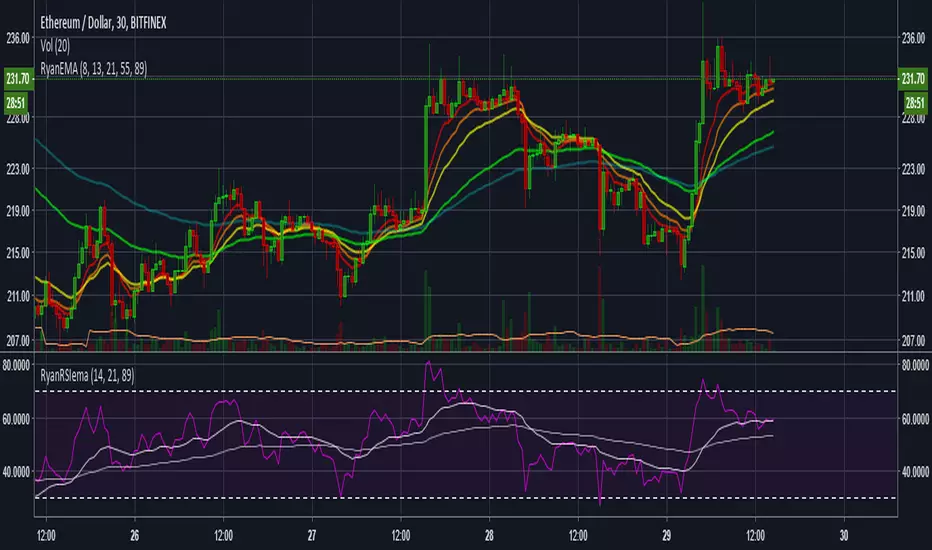
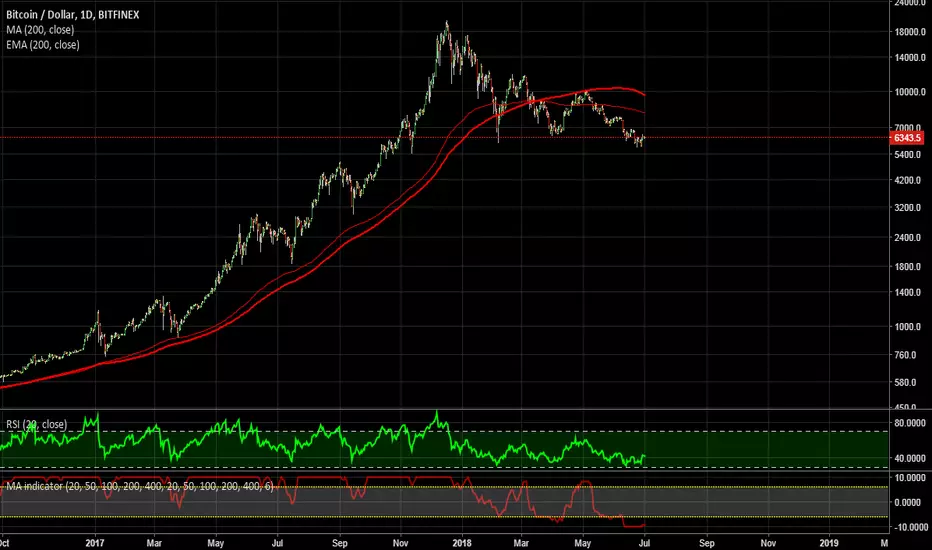
ALL Philakone's EMA's (8,13,21,55,100, 200)These are Philakone's EMA's. I added the 100 day in there as I didn't see that anyone had done that.
The 100 might be the same color as the 200 looking at the code, I changed it on my chart, but just make sure you check the colors.

Multiple moving averages EMA and SMA (up to 4 each)Simple script lets you add multiple moving averages under one indicator. Up o 4 EMAs and 4 simple MAs. Specify the time frames for each one individual, and turn off the ones you don't need under "Style" tab in settings. Have fun.


MA/EMA/SMA JumboMultiple moving averages, can choose between EMA and SMA, if some MA not required the deselect in style.
Ultimate Multiframe EMA 1h-4h-12h-1DThis is an overlay indicator for EMA in various timeframe (1h-4h-12h-1D), backtesting is needed and I am not responsible for any miscalculation done by the code.
Current GUI is in Vietnamese but I think you guys will understand what it says.

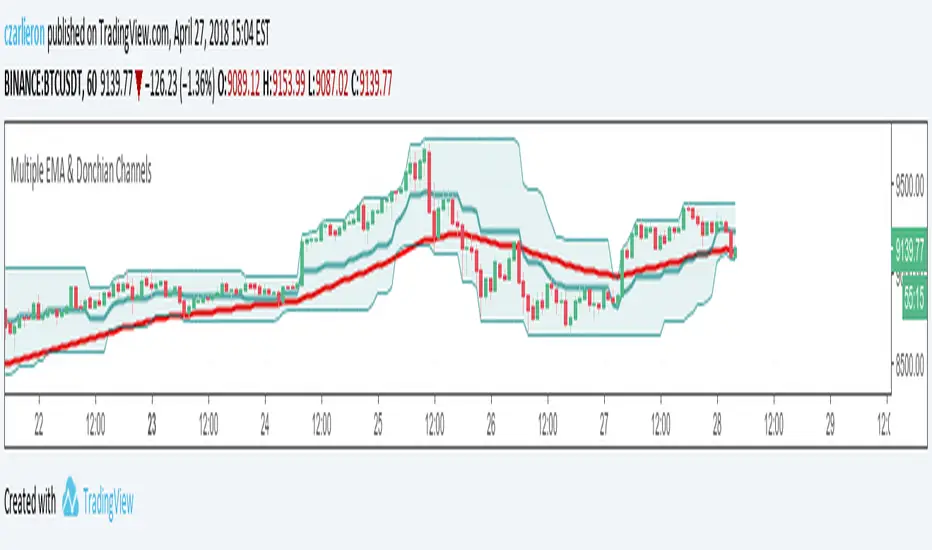
My Multiple EMA with Donchian ChannelsDonchian Channels with EMA's 8, 13, 21, 34, 55, 89 (fib numbers). Everything is configurable.