MechArt ATR Box V1MechArt ATR Box V1
Description:
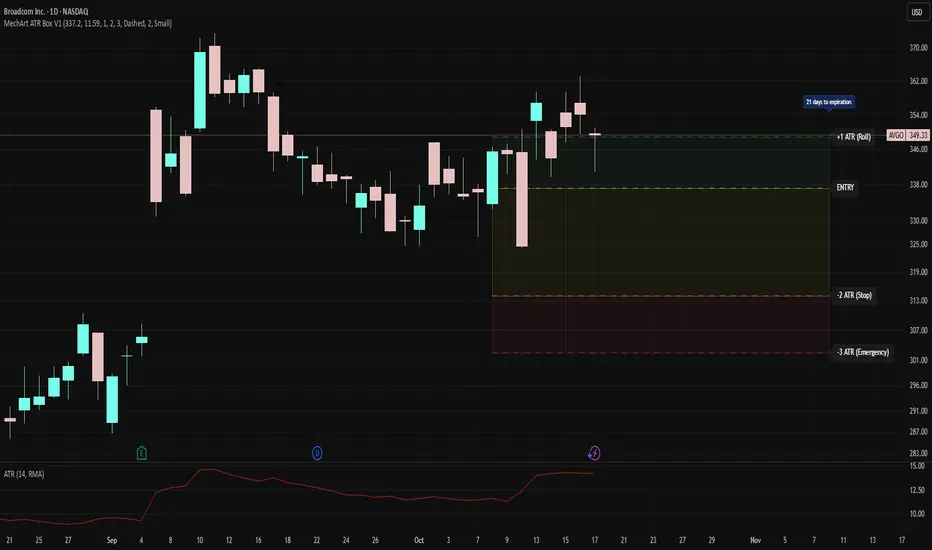
The MechArt ATR Box V1 is a precision trade-planning and risk-management tool that visualizes your entire position framework using customizable ATR-based zones.
It automatically plots your key decision levels from a defined entry price and ATR value — helping you clearly see when to roll, hold, or exit a trade.
Features:
Configurable ATR multipliers for roll, stop, and emergency zones.
Automatically updates labels and price levels based on your custom ATR settings.
Distinct color-coded boxes for:
✅ +1 ATR (Roll Zone) – visualize profit or roll targets.
⚠️ –2 ATR (Stop Zone) – manage risk boundaries.
🚨 –3 ATR (Emergency Stop) – mark hard exit thresholds.
Adjustable ATRs, line style, width, color, and opacity for visual clarity.
Optional Days Until Expiration label for time-sensitive trades.
Ideal for:
Traders using mechanical, ATR driven systems (like OVTLYR Plan M), or anyone who wants a clear, rule-based visualization of risk vs. reward directly on the chart.
Tìm kiếm tập lệnh với "ATR"
Mutanabby_AI | ATR+ | Trend-Following StrategyThis document presents the Mutanabby_AI | ATR+ Pine Script strategy, a systematic approach designed for trend identification and risk-managed position entry in financial markets. The strategy is engineered for long-only positions and integrates volatility-adjusted components to enhance signal robustness and trade management.
Strategic Design and Methodological Basis
The Mutanabby_AI | ATR+ strategy is constructed upon a foundation of established technical analysis principles, with a focus on objective signal generation and realistic trade execution.
Heikin Ashi for Trend Filtering: The core price data is processed via Heikin Ashi (HA) methodology to mitigate transient market noise and accentuate underlying trend direction. The script offers three distinct HA calculation modes, allowing for comparative analysis and validation:
Manual Calculation: Provides a transparent and deterministic computation of HA values.
ticker.heikinashi(): Utilizes TradingView's built-in function, employing confirmed historical bars to prevent repainting artifacts.
Regular Candles: Allows for direct comparison with standard OHLC price action.
This multi-methodological approach to trend smoothing is critical for robust signal generation.
Adaptive ATR Trailing Stop: A key component is the Average True Range (ATR)-based trailing stop. ATR serves as a dynamic measure of market volatility. The strategy incorporates user-defined parameters (
Key Value and ATR Period) to calibrate the sensitivity of this trailing stop, enabling adaptation to varying market volatility regimes. This mechanism is designed to provide a dynamic exit point, preserving capital and locking in gains as a trend progresses.
EMA Crossover for Signal Generation: Entry and exit signals are derived from the interaction between the Heikin Ashi derived price source and an Exponential Moving Average (EMA). A crossover event between these two components is utilized to objectively identify shifts in momentum, signaling potential long entry or exit points.
Rigorous Stop Loss Implementation: A critical feature for risk mitigation, the strategy includes an optional stop loss. This stop loss can be configured as a percentage or fixed point deviation from the entry price. Importantly, stop loss execution is based on real market prices, not the synthetic Heikin Ashi values. This design choice ensures that risk management is grounded in actual market liquidity and price levels, providing a more accurate representation of potential drawdowns during backtesting and live operation.
Backtesting Protocol: The strategy is configured for realistic backtesting, employing fill_orders_on_standard_ohlc=true to simulate order execution at standard OHLC prices. A configurable Date Filter is included to define specific historical periods for performance evaluation.
Data Visualization and Metrics: The script provides on-chart visual overlays for buy/sell signals, the ATR trailing stop, and the stop loss level. An integrated information table displays real-time strategy parameters, current position status, trend direction, and key price levels, facilitating immediate quantitative assessment.
Applicability
The Mutanabby_AI | ATR+ strategy is particularly suited for:
Cryptocurrency Markets: The inherent volatility of assets such as #Bitcoin and #Ethereum makes the ATR-based trailing stop a relevant tool for dynamic risk management.
Systematic Trend Following: Individuals employing systematic methodologies for trend capture will find the objective signal generation and rule-based execution aligned with their approach.
Pine Script Developers and Quants: The transparent code structure and emphasis on realistic backtesting provide a valuable framework for further analysis, modification, and integration into broader quantitative models.
Automated Trading Systems: The clear, deterministic entry and exit conditions facilitate integration into automated trading environments.
Implementation and Evaluation
To evaluate the Mutanabby_AI | ATR+ strategy, apply the script to your chosen chart on TradingView. Adjust the input parameters (Key Value, ATR Period, Heikin Ashi Method, Stop Loss Settings) to observe performance across various asset classes and timeframes. Comprehensive backtesting is recommended to assess the strategy's historical performance characteristics, including profitability, drawdown, and risk-adjusted returns.
I'd love to hear your thoughts, feedback, and any optimizations you discover! Drop a comment below, give it a like if you find it useful, and share your results.

Limit Order + ATR Stop-Loss [TANHEF]This indicator enables interactive placement of limit or stop-limit orders with a trailing ATR stop-loss and optional profit target (with alerts). Refer to the images below for further clarification.
Why use a trailing stop-loss?
A trailing stop-loss serves as an exit strategy when price moves against you, while also allowing you to adjust the exit point further into profit when price moves favorably. The ATR (Average True Range), a reliable measure of volatility, acts as an effective risk management tool, functioning as a trailing stop-loss.
Indicator Explanation
Initial indicator placement: Select Long Limit or Long-Stop Limit order.
Change Entry Type: Switch between Long and Short within settings.
Modify entry price: Drag circle, adjust in settings, or re-add indicator to chart.
Optional Profit Target: Use Risk/Reward ratio or specify price.
Entry anticipation: Estimated ATR stop-loss and profit target as blue circles (fluctuates with volatility changes).
Entry triggered: Actual ATR stop-loss and profit target plotted.
Exit conditions: Stop-loss or profit target hit, exit entry.
Update Frequency: Continuously, Bar Open, or Bar Open on entry then continuously.
ATR Overlap: no entry occurs if the ATR overlaps with price (stop-loss 'hit' already on entry bar)
Table: Displays input settings selected.
Show Only On Ticker: Ability to hide indicator on other tickers.
Long Limit
Long Stop-Limit
Short Limit
Short Stop-Limit
Alerts
1. 'Check' alerts to use within indicator settings (entry, trailing stop hit, profit target hit, and failed entry).
2. Select 'Create Alert'
3. Set the condition to 'Limit Order + ATR Stop-Loss''
4. Select create.
Additional details can be added to the alert message using these words in between Curly (Brace) Brackets:
{{trail}} = ATR trailing stop-loss (price)
{{target}} = Price target (price)
{{type}} = Long or Short stop-loss (word)
{{traildistance}} = Trailing Distance (%)
{{targetdistance}} = Target Distance (%)
{{starttime}} = Start time of position (day:hr:min)
{{maxdrawdown}} = max loss
{{maxprofit}} = max profit
{{update}} = stoploss update frequency
{{entrysource}} = entry as 1st bar source (yes/no)
{{triggerentry}} = Wick/Close Trigger entry input
{{triggerexit}} = Wick/Close Trigger exit input
{{triggertarget}} = Wick/Close Trigger target input
{{atrlength}} = ATR length input
{{atrmultiplier}} = ATR multiplier input
{{atrtype}} = ATR type input
{{ticker}} = Ticker of chart (word)
{{exchange}} = Exchange of chart (word)
{{description}} = Description of ticker (words)
{{close}} = Bar close (price)
{{open}} = Bar open (price)
{{high}} = Bar high (price)
{{low}} = Bar low (price)
{{hl2}} = Bar HL2 (price)
{{volume}} = Bar volume (value)
{{time}} = Current time (day:hr:min)
{{interval}} = Chart timeframe
{{newline}} = New line for text

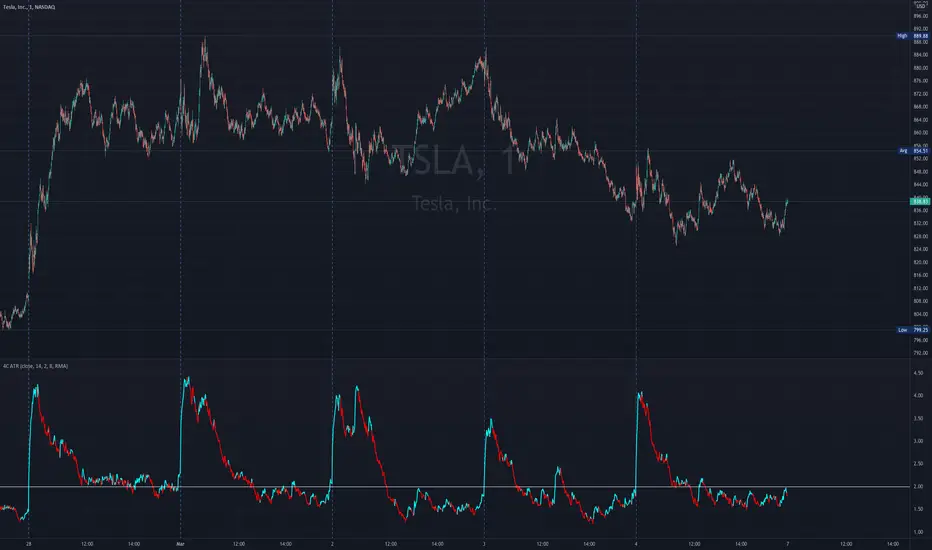
4C ATR w/ Reference LineThe 4C ATR is a simple indicator that plots a horizontal line on the ATR indicator, which can be used as a minimum or maximum reference value.
Some trading setups have specific criteria that require a minimum ATR on a certain timeframe for the instrument to be playable. The horizontal line is useful as a quick visual reference, and can be adjusted to any specific level for any timeframe. If the ATR dips below the horizontal line, the trader can quickly see that the ATR is below the minimum criteria, and should not trade that instrument (based on their personal trade criteria).
This indicator also features a color change of the ATR line based on trend direction. If the ATR is trending up, it is painted blue, and if it starts to trend down, it is painted red. It uses a hidden simple moving average of the ATR, and the slope direction of the moving average paints the ATR line. The moving average length can be adjusted, and is set at a length of 8 for default. The ATR is set at a default value of 14.
Parts of this script used the default/stock Tradingview ATR indicator to build off of.
CM ATR Stops/Bands - Multi-TimeFrameCM_MTF ATR Bands/Stops
Many Options Available Via Input Tab:
-Chart Defaults to Upper and Lower ATR's Based on Current Chart TimeFrame
-Ability to Plot either Upper and/or Lower ATR's
-Ability to Change the Time Frame ATR's are Based On!
-Ability to change Look Back Period and ATR Multiplier Individually for Both Time Frames
-This Gives you the ability to plot same Time Frame with (for ex.) a 5 ATR with a 1.5 Mult and a 14 ATR with a 2.0 Mult etc.
-Or you can plot Daily ATR's on a 60 minute Chart etc.
-ATR Multipliers are Calculated with Code that allows "Non Whole Numbers" Allowing Ability to use 1.5 ATR's, 1.8 ATR's etc.
***Endless # of Combinations can be used!!!!

Trend: SMA with ATR Bands and EMA [Oxyge]Brief introduction:
Easy to use trend indicator to help find entry positions
How it works:
1, short-term trend judgment: EMA is greatly influenced by short-term trends, so it is very good to use it as a tool for judging short-term trends. At the same time, the filtering function has been added:
Long: green
Short: red
No direction: blue
2, the general trend judgment: the use of 30SMA as the default trend line, while increasing the ATR band to increase the scope of judgment.
How do I use (assuming it is now a period of long market):
1, first look at the 30SMA and ATR band, if the slope is positive (> 45 °), then ready to go long!
2. When price comes to the ATR band, the ATR band is my point of interest
3. Wait for a test of the ATR band: the EMA turns green, which means that the short-term trend is already nice and long.
4. Stop Loss Placement: Stop Loss is placed at the most recent low.
Closing
Enjoy it!
——————————————
简单介绍:
简单易用的趋势指标,帮助寻找进场位置
它怎么工作:
1、短期趋势判断:EMA受短期趋势影响很大,因此把它作为判断短期趋势的工具非常好用。同时增加了过滤功能:
多头:绿色
空头:红色
无方向:蓝色
2、大趋势判断:使用30SMA作为默认趋势线,同时增加ATR带增加判断范围。
我是如何使用的(假设是现在是一段多头行情):
1、先看30SMA和ATR带,如果斜率为正(>45°),那么准备做多
2、当价格来到ATR带时,ATR带是我的感兴趣的点
3、等待一次对于ATR带的测试:EMA变成绿色,代表短期已经是不错的多头趋势
4、止损放置:止损放置在最近的低点
结束
请享受它

Trend & atr day & calcHi!
Why for what and how in this script?
At the time of publication the script consists of three modules, it may increase in the future.
1. Bottom left corner : daytime ATR module
(idea and basis of the author's script - ???)
- The size of the daily ATR based on 14 bars;
- intraday ATR progress;
- colour indication of the progress status, for easier visual perception (green < 70%, yellow 70-90 and red over 90% of ATR)
By evaluating the progress of the daily ATR, it is possible to suggest and expedient to enter/exit/hold a trade.
2. Top right: trend module
The trend is calculated based on Bill Williams' alligator indicator
- trend status on specified timeframes for the current ticker;
- colour indication for visual perception (green - growing trend, yellow - alligator is sleeping, red - downtrend)
Do not forget that the alligator is based on moving averages with the resulting consequences.
Its purpose is to assess the state of the trend on other ticker TFs, without additional actions (switching to another screen or TF)
3. In the bottom left corner - risk and position calculator
(based on an idea of the risk calculator by @andrei.bunulu)
It helps to determine the advisability of entering the trade and also what size position to enter into the trade, within money management strategy chosen.
- The calculator works in two directions: long deal and short deal (short deal calculation is enabled by check-box in settings)
- two calculation methods:
a. based on the set stop loss % (default is 0.3%), in this mode the stop and takeout level is automatically calculated (default is 1 / 3).
b. by entering the desired price levels (entry, stop and take profit points)
To make this work correctly please do not forget to choose the type of calculation (% or price) in the settings, and the currency symbol (for visual representation in the results).
The calculator can take into account the set commissions and spreads.
When hovering over the module - tooltips are displayed.
Each module can be enabled / disabled in the settings.
The size and arrangement of the modules is made for joint use with the script - "Abnormal Bar".
/// а по-русски это так ///
Привет!
Зачем для чего и как в этом скрипте?
На момент публикации скрипт состоит из трех модулей, возможно в будущем увеличится.
1. В левом нижнем углу : модуль дневного ATR
(идея и основа скрипт автора - ???)
- размер дневной ATR на основании 14 баров;
- прогресс ATR внутри дня;
- цветовая индикация состояния прогресса, для более простого визуального восприятия (зеленый < 70%, желтый 70-90 и красный более 90% ATR)
Оценивая прогресс дневного ATR, можно предположить и целесообразности входа / выхода / удержания из сделки.
2. В правом верхнем углу: модуль тренда
Тренд рассчитывается на основе индикатора - аллигатор Билла Вильямса
- состояние тренда на указанных таймфреймах для текущего тикера;
- цветовая индикация для визуального восприятия (зеленый - растущий тренд, желтый - аллигатор спит, красный - нисходящий тренд)
Не забываем, что аллигатор построен на основе скользящих средних с вытекающими последствиями.
Назначение - оценить состояние тренда на других ТФ тикера, без дополнительных действий (переключения на другой экран или ТФ)
3. В нижнем левом углу - калькулятор рисков и позиции
(на основе идеи калькулятора аuthor: @andrei.bunulu)
Помогает определить целесообразность входа в сделку, а также каким размером позиции входить в сделку, в рамках выбранной стратегии мани менеджмента.
- калькулятор работает в два направления: длинная и короткая сделка (расчет по короткой включается в настройках чек-боксом)
- два варианта расчета:
а. на основании установленного % стоп лосса (по-умолчанию 0,3%), при этом режиме происходит автоматический расчет уровня стопа и тейка (по умолчанию 1 / 3).
b. путем ввода данных желаемых уровней цены (точки входа, стопа и тейк профита)
Для корректной работы не забываем в настройках выбирать тип расчета (% или цена), а также символ валюты (для визуального отображения в итогах).
Калькулятор может учитывать установленный размер комиссий и спреда.
При наведении на модуль - отображаются подсказки.
Каждый модуль можно включить / выключить в настройках.
Размер и расположение модулей сделано для совместного использования со скриптом - "Abnormal Bar"

4c ATR ThresholdThe 4C ATR Threshold is a simple indicator that paints the chart background red when the ATR goes below the user defined ATR minimum.
Some trading setups have specific criteria that require a minimum ATR on a certain timeframe for the instrument to be playable.
The painting of the chart background based on the ATR value is useful as a quick visual reference.
The minimum ATR value can be adjusted to any specific level for any timeframe.
If the ATR dips below the user defined minimum, the trader can quickly see that the ATR is below the minimum criteria, and should not trade that instrument (based on their personal trade criteria).
If the background is not painted by the indicator, then the ATR is above the user defined minimum.
Parts of this script used the default/stock Tradingview ATR indicator to build from.
Zero-Lag ATR Trend [BackQuant]Zero-Lag ATR Trend
Overview
Zero-Lag ATR Trend is a volatility-adaptive trend-following overlay designed to identify directional market regimes with minimal delay while preserving structural clarity. The indicator combines a zero-lag moving average framework with a zero-lag volatility model to produce a trailing trend line that reacts quickly to meaningful price changes without becoming unstable or overly sensitive.
Unlike conventional ATR-based trend tools that rely on lagging averages and delayed volatility estimates, this indicator applies zero-lag logic to both the trend centerline and the volatility calculation. The result is a trend structure that aligns more closely with real-time price action while still maintaining the discipline required for trend continuation trading.
Core design philosophy
The core idea behind Zero-Lag ATR Trend is simple:
Reduce signal delay without sacrificing trend integrity.
Adapt dynamically to changing volatility regimes.
Provide a single, clean structure that defines trend direction, continuation, and invalidation.
Instead of stacking multiple indicators, the script builds a complete trend framework from two tightly integrated components: a zero-lag trend spine and a zero-lag ATR trailing mechanism.
Zero-lag trend spine
The trend spine is constructed using a zero-lag moving average (ZLMA). This is achieved by applying a corrective step to a traditional moving average, effectively compensating for smoothing delay.
Conceptually, the process works as follows:
A base moving average is calculated from the selected price source.
That moving average is then passed through a zero-lag correction.
The correction pulls the line closer to current price without introducing noise.
This produces a trend line that reacts faster than standard EMA, SMA, or HMA signals, particularly during early trend acceleration phases. Multiple moving-average types can be used inside the zero-lag framework, allowing traders to fine-tune responsiveness based on asset behavior and timeframe.
Zero-lag volatility model
Volatility is measured using True Range, but instead of applying classic ATR smoothing, the indicator uses a zero-lag smoothing pass on the True Range itself.
This approach offers several advantages:
Volatility expands more quickly during impulse moves.
Volatility contracts faster during consolidations.
Band width adjusts in near real-time to changing conditions.
The smoothed zero-lag ATR is multiplied by a user-defined factor to create adaptive upper and lower boundaries around the trend spine. These boundaries define how much counter-movement price is allowed before the trend structure is invalidated.
Volatility-aware trailing structure
The trailing output is the defining feature of the indicator. It behaves as a one-directional trailing structure:
In bullish conditions, the trailing line can only move upward.
In bearish conditions, the trailing line can only move downward.
Minor pullbacks inside the volatility envelope do not flip the trend.
This logic prevents the indicator from reacting to shallow retracements and focuses instead on structural trend changes. Because the trailing behavior is volatility-scaled, the indicator remains stable during high volatility while still responding promptly during regime shifts.
Trend flips and regime transitions
Trend direction is determined by changes in the trailing structure itself rather than raw price crosses. A trend flip occurs only when price movement is strong enough, relative to current volatility, to force the trailing line to reverse direction.
This means:
Bullish flips represent genuine transitions into upward regimes.
Bearish flips represent genuine transitions into downward regimes.
Sideways noise is largely filtered out.
As a result, the indicator is well suited for identifying medium-to-long trend phases rather than short-term oscillations.
Visual structure and chart clarity
The visual design is intentionally minimal and functional:
The main trailing line is color-coded by trend direction.
An optional ribbon or cloud reinforces directional bias.
Optional candle coloring aligns price bars with the active trend.
These elements allow traders to assess trend state instantly without interpreting multiple signals or overlays.
How to use for trend following
Trend bias
Maintain a bullish bias while price holds above the trailing line.
Maintain a bearish bias while price holds below the trailing line.
Entries
Trend flips can be used as initial directional entries.
Pullbacks toward the trailing line often act as continuation opportunities.
Momentum confirmation can be layered on top for additional confluence.
Trend management
The trailing line naturally functions as a dynamic stop reference.
As long as price respects the trailing structure, the trend remains valid.
A flip in direction signals a full regime transition rather than a minor correction.
Why zero-lag matters for trend trading
Traditional trend indicators often react late, especially during fast expansions, resulting in delayed entries and early exits. By reducing lag in both the trend calculation and the volatility model, Zero-Lag ATR Trend aims to capture a larger portion of directional moves while maintaining consistency and discipline.
This makes it particularly effective for momentum-based trend following, breakout continuation strategies, and traders who prioritize staying aligned with dominant market structure rather than predicting reversals.
Summary
Zero-Lag ATR Trend is a complete trend-following framework built around responsiveness, adaptability, and clarity. Its zero-lag architecture allows it to respond earlier to meaningful price changes, while its volatility-aware trailing logic ensures that trends are only invalidated when structure truly breaks. The result is a clean, intuitive tool that supports disciplined trend participation across assets and timeframes.

ATR Display ShorcutATR Value Display - On-Chart Volatility Monitor
Clean ATR display directly on your price chart - no extra panels needed!
This indicator displays the current Average True Range (ATR) value as a clean table overlay on your price chart, eliminating the need for a separate indicator panel below your main chart.
✨ Key Features:
On-chart display: ATR value shown directly on price chart
Customizable positioning: Choose from 4 corner positions
Clean design: Minimal, non-intrusive table format
Real-time updates: Always shows the latest ATR value
Adjustable period: Default 14-period, fully customizable
🎯 Perfect For:
Position sizing calculations
Stop-loss placement (1x, 1.5x, 2x ATR)
Volatility assessment at a glance
Clean chart setups without extra panels
Quick reference during live trading
📊 How to Use:
Add to chart
Select your preferred table position
Adjust ATR period if needed (default: 14)
The current ATR value displays automatically
💡 Pro Tip:
Use this ATR value to:
Set stop-losses at 1.5x or 2x ATR distance
Determine position size based on account risk
Compare current volatility to historical levels
Clean charts, clear data, better trading decisions.
Compatible with all timeframes and instruments. Pine Script v6.
Feel free to adjust this description to match your style or add any specific features you want to highlight!

ADR & ATR OverlayADR & ATR Overlay
This indicator will display the following as an overlay on your chart:
ADR
% of ADR
ADR % of Price
ATR
% of ATR
ATR % of Price
Description:
ADR : Average Day Range
% of ADR : Percentage that the current price move has covered its average.
ADR % of Price : The percentage move implied by the average range.
ATR : Average True Range
% of ATR : Percentage that the current price move has covered its average.
ATR % of Price : The percentage move implied by the average true range.
Options:
Time Frame
Length
Smoothing
Enable or Disable each value
Text Color
Background Color
How to use this indicator:
The ADR and ATR can be used to provide information about average price moves to help set targets, stop losses, entries and exits based on the potential average moves.
Example: If the "% of ADR" is reading 100%, then 100% of the asset's average price range has been covered, suggesting that an additional move beyond the range has a lower probability.
Example: "ADR % of Price" provides potential price movement in percentage which can be used to asses R/R for asset.
Example: ADR (D) reading is 100% at market close but ATR (D) is at 70% at close. This suggests that there is a potential move of 30% in Pre/Post market as suggested by averages.
Notes:
These indicators are available as oscillators to place under your chart through trading view but this indicator will place them on the chart in numerical only format.
Please feel free to modify this script if you like but please acknowledge me, I am only a hobby coder so this takes some time & effort.

Custom ATR Trailing StopThis Script creates a custom ATR (Average True Range) trailing stop. It allows traders to set up automated stop-loss levels based on the ATR, which adjusts dynamically to market volatility. The script is designed to support both long and short trades, offering flexibility and precision in trade management.
When loading the indicator to your chart, simply click to set the trade begining time, confirm various settings and you are set.
Check tooltips for more details in the input settigns menu.
User Inputs
Trade Setup: Allows users to set the trade direction (Long or Short), the signal source for entries, and the specific bar time for the trade setup.
ATR Settings: Configurable ATR lookback period, ATR smoothing period, initial ATR multiplier for setting the stop-loss, breakeven ATR multiplier, and a manual breakeven level.
ATR Calculations
Computes the ATR and its moving average.
Determines initial and breakeven stop levels based on the ATR.
Signal Validation
Validates long or short trade signals based on the specified bar time and trade direction.
Triggers alerts when a valid trade signal is detected.
Trailing Stop Logic
For long trades, adjusts the stop-loss level dynamically based on the ATR.
For short trades, performs similar adjustments in the opposite direction.
Updates the trailing stop level to ensure it follows the price, moving closer as the price moves favorably.
Resets the trade state when the stop-loss is hit, triggering an alert.
Plotting
Plots the trailing stop levels on the chart.
Uses green for stop levels indicating profit and red for stop levels indicating a loss.

Interactive ATR Stop-Loss [TANHEF]This indicator is "Interactive" which means some inputs can are manually added through the first click after adding the indicator to the chart (ATR Trailing Stop-loss start point). See images below for more explanation.
Why use a trailing stop-loss?
A trailing stop-loss provides an exit when price moves against you but also enables you to move the exit point further into profit when price is moving in the desired direction of a trade. The ATR (Average True Range) which is used to measure volatility, is very effective at functioning as a trailing stop loss.
Indicator Explanation
Initially when this indicator is added to the chart, you will be prompted to select where to begin the ATR Trailing Stop-loss.
For a long stop-loss, select below price.
For a short stop-loss, select above price.
After this indicator is placed, it can be modified via dragging or from within the settings by modifying the time and the price input. Or simply re-add the indicator to the chart.
The ATR Stop Loss plotted. Note that the trailing value that is considered as the stop loss value is the value of the ATR from the prior candle. The settings for the ATR calculation can be modified within the settings.
An optional fixed profit target can be added within the settings. This profit target will only actively be plotted when the ATR Trailing Stop-loss has not be hit hit yet or until the profit target has been hit.
Here shows that the profit target was hit, then later on the ATR Trailing Stop-loss was hit.
Note, trailing stop-loss will continue to be plotted until it has been hit regardless of the profit target being hit or not.
Alerts
1. 'Check' alerts to use within indicator settings (trailing stop hit and/or profit target hit).
2. Select 'Create Alert'
3. Set the condition to 'Interactive ATR''
4. Select create.

Bar By Bar ATR [upslidedown]After seeing strategy after strategy refer to calculating ATR values using a "calculator" (how barbaric!), I thought I'd take a stab at one possible solution to the "problem" as an overlay indicator on the main chart that replaces traditional standard ATR bands. This indicator presents ATR within a channel with a slick trick: invisible hover-able tooltips for you to know the ATR value for your strategy from bar to bar. Just zoom in and hover over the high ATR range and you'll see take profit and stop loss values for whatever strategy you might be running. I defaulted the indicator to a 1:1.5 ATR standard setup because that is good for many strategies but this is as configurable as you'd like to make it. One notable improvement for this indicator over standard ATR bands is that many existing ATR bands only use integers and this one uses a float value, so you can endlessly customize based on whatever strategy you might be running.
Note: Because labels are limited by default, the best way to historically see ATR values is to use TV's replay feature. I did this on purpose to limit resource usage. One could certainly print more labels but I felt it unnecessary to go beyond the default number of labels.

Elder Impulse System + ATR BandsDisregard the above chart, I am not sure why it isn't showing the one I want, which is linked below:
This is as far as I can tell the closest representation to Dr. Alexander Elder's updated "Elder Impulse System" that has added ATR-volatility bands up to 3x deviations from price. I got the idea from watching this recent video (www.youtube.com) of Dr. Elder reviewing some recent trades and noticed he had updated his system from his original books. The Impulse System colour coding was inspired by AstralLoverFlow and LazyBear. ATR Bands are pre-programmed Keltner Channels with some modifications such as filing in the ATR Zones with user-selected colour bands and modifying the ATR value to better suit the volatility of the market being traded.
The script has several components, which I will detail below:
Exponential Moving Averages:
1) A 13-period EMA that is used as a staple in all of Dr. Elder's technical analysis. He uses this EMA as the basis for all of his indicators and why it is included here.
2) A 26-period EMA which can be used as a base-line of sorts to filter when to go long or when to go short. For instance, price over the 26-EMA, price is strong and the rally upwards is likely to continue, underneath it, price is weak and likely to continue downwards for a time.
Volatility Bands:
By definition these are nothing more than 3 separate Keltner Channels of a 13-period EMA each set to one additional multiplier from the moving average. This gives us a 1x, 2x, and 3x multiplier of average volatility from the 13-period EMA based on a 14-period Average True Range (ATR) reading. The ATR was chosen as it accommodates price gaps and also is the standard formula calculation in TradingView. The values of the bands cannot be adjusted but the colour coding of them can be.
Elder Impulse System:
These colour-coded bars show you the strength and direction of the current chart resolution, calculated by the slope of a 13-period EMA and the slope of a MACD histogram. These are used not as a buying or selling recommendation alone but as trend filters, as per Dr. Elder's own description of them.
Green Bars = The 13-period EMA is sloping positively and the MACD histogram is rising compared to previous bars. The trader should only consider buying/long opportunities when a green bar is most recent.
Red Bars = The 13-period EMA is sloping negatively and the MACD histogram is falling compared to previous bars. The trader should only consider selling/short opportunities when a red bar is most recent.
Blue Bars = The 13-period EMA and the MACD histogram are not aligned. One of the indicators is sloping opposite to the other indicator. These are known as indecision bars and are typically seen near the end of a previously established trend. The trader can choose to wait for either a green or red bar to shape their trading bias if they are more risk-averse while a counter-trend trader may decide to try opening a position against the currently-established trend.
How To Trade the System:
This system is unique in that it is so versatile and will fit the styles of many traders, be it trend following traders (generally the original Elder Impulse System design) or mean-reversion/counter-trend trading (the original Keltner Channel design). None of the examples below or in the chart above are financial advice and are just there for demonstration purposes only.
1) The most basic signal given would be the moving average cross up or down. A cross of the 13-EMA over the 26-EMA signals upward trend strength and the trader could look for buying opportunities. Conversely, the 13-EMA under the 26-EMA shows downward trend strength and the trader could look for selling opportunities.
2) Following the Elder Impulse system in conjunction with the EMAs. Look for long opportunities when a green bar is printed and price is over both of the 13- and 26-period EMAs. Look for short opportunities when a red bar is printed and price is below both of the 13- and 26-period EMAs. Keep in mind this does not necessarily need a moving average cross to be viable, a green or red bar over both EMAs is a valid signal in this system, usually. Examine price more closely for better entry signals when a blue bar is printed and price is either above or below both EMAs if you are a trend trader. This is how Dr. Elder originally intended the system to be used in conjunction with his famous Triple Screen Trading System. I am not going into detail here as it is a deep subject but I would suggest an interested trader to examine this Triple Screen System further as it is widely accepted as a strong strategy.
3) Mean Reversion and Counter-Trend Trading. Dr. Elder mentions that the zone between the two EMAs is called the Value Zone. A mean reversion trader could look for buying opportunities if price has generally been in an uptrend and falls back to value, conversely, they could look for shorting opportunities if price has generally been in a downtrend and rises back to value. These are your very basic pull backs found in trends that create your higher lows in an uptrend or your lower highs in a downtrend. A mean reversion/scalper trader may also look to use the upper and lower most ATR bands as an indication of price being overbought or oversold and could look to enter a counter-trend trade here once a blue indecision bar is printed and to ride that move back down to the Value Zone.
Taking Profits and Risk Management
This system again is very versatile and will fit a wide range of trading styles. It has built in take profit levels and risk management depending on your style of trading.
1a) In original Triple Screen Trading (and the original Elder Impulse system), a trader was to place a buy order one tick above a newly printed green bar with a stop loss one tick below the most recent 2-day low, and vice-versa for red bars on short selling. as long as other criteria were met, that I will not go into. It is all over YouTube and in his books and on Investopedia if you want more information. The general idea is to continue the trend in the direction if price is strong and you are bought into that move with a close stop, or if price falls back a little bit, you can get in at a better price. This would be a system typically better suited to a scalper.
1b) The updated risk management according to the above video is to place a stop loss at least 2ATR away from price. These bands already have calculated these values so a trader can place a stop one tick below the 2 or even 3ATR zones depending on their risk appetite. This is assuming you have already received a strong buy signal based on the system you follow. This would be a system typically better suited to a trend-trader.
2a) Taking profits if you are a trend trader has several possibilities. The first, as Dr. Elder suggests, is to place a price target 2ATR values away from your entry giving you approximately a 1:1 risk-reward ratio.
2b) The second possibility if the trade is successful is to ride the trend upwards until a blue bar is printed, suggesting indecision in the market. A modified version of this that could let a winning trade run longer is to wait for the price to close under the 13-EMA in fast markets, or close under the 26-EMA in slightly slower markets to maximize potential winnings.
2c) A scalper trader may wish to have a target at either the value zone if they are playing an extended buy/short back to the mean, or if they are being at the mean, to sell or cover when price extends back out to the 2x or 3x zone.
3) Trend traders can additionally use the ATR zones as a sort of safety guidelines for entering a trade. Anything within the 1ATR zone is typically a safer entry as the market is less volatile at this time. Entering when price has gone into the 2ATR zone is signaled as a strong momentum move and can signal a stronger move in the direction of the current closing bar. While not always the case, it is suggested by Dr. Elder to not enter trend trades at the 3ATR zone as this is where you will be likely looking for a counter-trend retracement back to value and a trader entering here in the direction of the trade has a higher chance of being stopped out or not getting in at the best possible price.

ATR Percentile [racer8]ATR Percentile shows you the percentile that the current ATR is at relative to it's previous values.
There are 3 parameters: ATR length, Percentile length, Percentile level.
This is indicator is very interesting because it's based on an indicator that originally doesn't generate signals.
When the current ATR's percentile is higher than the Percentile level, the histogram turns red signalling that the market is more volatile than usual.
For example, ATR len = 10, percentile len = 80, percentile lvl = 70
A signal will be generated when the current ATR(10) is higher than 70% of 80 of it's previous values.
ATR Percentile is range bound between 0 and 100. The histogram's value represents a percentage between that range.
ATR Percentile = ( number of ATR values below current ATR over n periods / n periods ) * 100
Enjoy 🤪

HG Scalpius - ATR Up/Down Tick HighlightHG Scalpius - ATR Up/Down Tick Highlight
This indicator highlights ATR(14) upticks (green) and downticks (red) and has the below application:
- If a new trend closing high (low) is made on a downtick in ATR, decreasing volatility mode turns on
If you come across or think of any other useful scripts for the HG Scalpius system please comment below!
Links to 2 previous HG Scalpius scripts:
-
-
Happy trading!
Code:
study(title="Average True Range", shorttitle="ATR", overlay=false)
length = input(title="Length", defval=14, minval=1)
smoothing = input(title="Smoothing", defval="RMA", options= )
ma_function(source, length) =>
if smoothing == "RMA"
rma(source, length)
else
if smoothing == "SMA"
sma(source, length)
else
if smoothing == "EMA"
ema(source, length)
else
wma(source, length)
ATR = ma_function(tr(true), length)
c = ATR >= ATR ? color.lime : color.red
plot(ATR, title = "ATR", color=c, transp=0)

ATR FX DashboardATR FX Dashboard – Multi-Timeframe Volatility Monitor
Overview:
The ATR FX Dashboard provides a quick, at-a-glance view of market volatility across multiple timeframes for any forex pair. It uses the well-known Average True Range (ATR) indicator to display real-time volatility information in both pips and percentage terms, helping traders assess potential risk, position sizing, and market conditions.
How It Works:
This dashboard displays:
✔ ATR in Pips — The average price movement over a given timeframe, converted to pips for easy interpretation, automatically adjusting for JPY pairs.
✔ ATR as a Percentage of Price — Shows how significant the ATR is relative to the current price. Higher percentages often signal higher volatility or more active markets.
✔ Color-Coded Volatility Highlights — On the daily timeframe, ATR % cells are color-coded:
Green: High volatility
Orange: Moderate volatility
Red: Low volatility
Timeframes Displayed:
15 Minutes
1 Hour
4 Hour
Daily
This gives traders a clear, multi-timeframe view of short-term and broader market volatility conditions, directly on the chart.
Ideal For:
✅ Forex traders seeking quick, reliable volatility reference points
✅ Day traders and swing traders needing help with risk assessment and position sizing
✅ Anyone using ATR-based strategies or simply wanting to stay aware of changing market conditions
Additional Features:
Toggle option to display or hide ATR % relative to price
Automatic pip conversion for JPY pairs
Simple, clean table layout in the bottom-right corner of the chart
Supports all forex symbols
Disclaimer:
This tool is for informational purposes only and is not financial advice. As with all technical indicators, it should be used in conjunction with other tools and proper risk management.

Multifactor Buy/Sell Strategy V2 | RSI, MACD, ATR, EMA, Boll.BITGET:1INCHUSDT
This Pine Script code for TradingView is a multifactor Buy/Sell indicator that combines several technical factors to generate trading signals based on trend, volatility, and volume conditions. Here’s a breakdown of the main components and functionality:
Indicator Name
- Multifactor Buy/Sell Strategy V2 — an overlay indicator applied directly on the price chart.
### Input Parameters
The script includes multiple customizable parameters:
- RSI, EMA, MACD parameters — for setting periods and signals of MACD and RSI.
- ATR and Bollinger Bands — used for volatility analysis and level determination.
- Minimum Volatility Threshold — sets a minimum Bollinger Band width threshold for determining high volatility.
Core Indicators
1. RSI — calculated to identify oversold (below 30) and overbought (above 70) conditions.
2. EMA and MACD — calculates exponential moving averages and MACD histogram to determine trend direction.
3. ATR and Bollinger Bands — used to assess current volatility and establish dynamic upper and lower bands.
Volatility and Volume Analysis
- Determines the current ATR level and Bollinger Band width to evaluate high volatility.
- Calculates the volume moving average to track periods of increased volume during high volatility.
Trend Analysis
The script uses the difference between fast and slow EMAs to define strong trends:
- Uptrend — when the fast EMA is above the slow EMA, the price is above the fast EMA, and the trend is strong.
- Downtrend — when the fast EMA is below the slow EMA, the price is below the fast EMA, and the trend is strong.
Momentum Filter
- Based on the price change over the last three bars and compared against the minimum volatility threshold to identify strong momentum.
Buy and Sell Signal Generation
- Buy Signal: Uptrend with RSI oversold, positive MACD histogram, high volatility and volume, strong momentum, and sufficient Bollinger Band width.
- Sell Signal: Downtrend with RSI overbought, negative MACD histogram, high volatility and volume, strong momentum, and sufficient Bollinger Band width.
Visualization
- Buy and sell signals are displayed as green and red triangles on the chart.
- Plots for fast and slow EMAs, upper and lower bands, and Bollinger Bands.
Alerts
The script includes alert conditions for buy and sell signals, allowing notifications to be sent via email or mobile app.
Information Panel
A small table on the chart displays current volatility dataThis Pine Script code for TradingView is a multifactor Buy/Sell indicator that combines several technical factors to generate trading signals based on trend, volatility, and volume conditions. Here’s a breakdown of the main components and functionality:
Indicator Name
- Multifactor Buy/Sell Strategy V2 — an overlay indicator applied directly on the price chart.
Input Parameters
The script includes multiple customizable parameters:
- **RSI, EMA, MACD parameters** — for setting periods and signals of MACD and RSI.
- **ATR and Bollinger Bands** — used for volatility analysis and level determination.
- **Minimum Volatility Threshold** — sets a minimum Bollinger Band width threshold for determining high volatility.
Core Indicators
1. RSI — calculated to identify oversold (below 30) and overbought (above 70) conditions.
2. EMA and MACD — calculates exponential moving averages and MACD histogram to determine trend direction.
3. ATR and Bollinger Bands — used to assess current volatility and establish dynamic upper and lower bands.
Volatility and Volume Analysis
- Determines the current ATR level and Bollinger Band width to evaluate high volatility.
- Calculates the volume moving average to track periods of increased volume during high volatility.
Trend Analysis
The script uses the difference between fast and slow EMAs to define strong trends:
- Uptrend — when the fast EMA is above the slow EMA, the price is above the fast EMA, and the trend is strong.
- Downtrend — when the fast EMA is below the slow EMA, the price is below the fast EMA, and the trend is strong.
Momentum Filter
- Based on the price change over the last three bars and compared against the minimum volatility threshold to identify strong momentum.
Buy and Sell Signal Generation
- Buy Signal: Uptrend with RSI oversold, positive MACD histogram, high volatility and volume, strong momentum, and sufficient Bollinger Band width.
- Sell Signal: Downtrend with RSI overbought, negative MACD histogram, high volatility and volume, strong momentum, and sufficient Bollinger Band width.
Visualization
- Buy and sell signals are displayed as green and red triangles on the chart.
- Plots for fast and slow EMAs, upper and lower bands, and Bollinger Bands.
Alerts
The script includes alert conditions for buy and sell signals, allowing notifications to be sent via email or mobile app.
Information Panel
A small table on the chart displays current volatility
- Volatility Status — indicates high or low volatility.
- Bollinger Band Width — current width as a percentage.
- ATR Ratio — ratio of current ATR to long-term average ATR.
This script is suitable for trading in high-volatility conditions, combining multiple filters and factors to generate precise buy and sell signals.

(JS) Interchanging ATR & VWAP BandsOkay so this is pretty simple, but I think it's a great tool for day trading especially. I just took the default VWAP and Keltner channel scripts and combined them together.
The top option allows you to choose which one you'd prefer to use, "Use ATR instead of VWAP" .
The next options, "ATR Source", "KC Length", and "ATR Length" are the parameters for the ATR Bands.
"Number of Bands" allows you to choose how many bands you'd like to be on display (you can choose 1-8).
"Use Expoential MA" and "Band Style" are more default parameters from Keltner Channels used to set up the ATR Bands.
The "ATR Bands" are just stacked Keltner Channels separated by 1 ATR each, whereas the "VWAP Bands" are separated by standard deviation just like the default script from Trading View.
In these example chart, you can see the weekly VWAP with 8 deviation bands and 5 ATR bands with Keltner Channels.

ATR Based SL & TP Targets from Entry (Long/Short)ATR-based target helper for manual trade planning.
Plots a single entry level plus ATR-based stop loss and take-profit targets on the price scale. The script uses a standard ATR (default 14) and lets you select the position side (Long or Short). For Long positions, it places the stop loss 1× ATR below the entry and take-profit levels at 1, 2, 3, and 4× ATR above. For Short positions, it mirrors this logic, placing the stop 1× ATR above the entry and targets 1–4× ATR below. You can adjust the entry price and ATR multipliers from the settings, and all levels update instantly, giving a clean visual of your risk and reward targets on the price scale.
-------------------
Tip:
After entry, and after I set my SL & TP levels, I hide the indicator until it's needed again.

Session ATR Progression Tracker📊 Session ATR Progression Tracker - SIYL Regression Trading Tool
Track how much of your instrument's 7-day Average True Range (ATR) has been covered during the current trading session. This indicator is specifically designed for regression traders who follow the "Stay In Your Lane" (SIYL) methodology, helping you identify when the probability of mean reversion significantly increases. If you are interested in more on that check out Rod Casselli and tradersdevgroup.com.
🎯 Key Features:
• Real-time ATR Coverage Percentage - See at a glance what percentage of the 7-day ATR has been covered in the current session
• SIYL-Optimized Thresholds - See at a glance when the instrument has achieved 80% and 100% ATR coverage, the proven thresholds where mean reversion probability increases (customizable)
• Flexible Session Modes:
- Daily: Resets at calendar day change
- Session: Uses exchange-defined trading sessions
- Custom Session: Set your exact session start/end times (perfect for futures traders and international markets)
• Visual Alerts - Color-coded display (gray → orange → red) and optional background highlighting
• Repositionable Display - Choose from 9 screen positions to avoid chart clutter
• Session Markers - Green triangles mark the start of each new session
• Detailed Stats - View current range, ATR value, session high/low, and session status
💡 Why Use This Indicator?
This tool is built around a proven concept: regression trading becomes significantly more effective once a session has achieved at least 80% of its 7-day ATR. At this threshold, the probability of price reverting to mean increases substantially, creating higher-probability trade setups for SIYL practitioners.
Benefits for regression traders:
- Identify optimal entry points when mean reversion probability is highest (≥80% ATR coverage)
- Avoid premature regression entries before adequate range has been established
- Recognize when daily moves have "earned their range" and are ripe for reversal
- Time fade-the-move and counter-trend strategies with statistical backing
- Improve win rates by trading only after proven probability thresholds are met
⚙️ Setup Instructions:
1. Add the indicator to your chart
2. Select your preferred "Reset Mode" (recommend "Custom Session" for futures/international markets)
3. If using Custom Session, enter your session times in 24-hour format (e.g., 0930-1600 for US stocks, 1700-1600 for CME futures)
4. Adjust alert thresholds if desired (default: 80% and 100% - proven SIYL thresholds)
5. Position the display where it's most visible on your chart
📈 Works Across All Markets:
Stocks • Futures • Forex • Indices • Crypto • Commodities
Perfect for regression traders, mean reversion specialists, and SIYL practitioners who want to trade with probability on their side by entering only after the session has "earned its range."
---
Tip: For futures contracts with overnight sessions that span calendar days (like MES, MNQ, MYM), use "Custom Session" mode with your exchange's official session times for accurate tracking.

Anrazzi - EMAs/ATR - 1.0.2Description:
The Anrazzi - EMAs/ATR indicator is a versatile tool for technical traders looking to monitor multiple moving averages alongside the Average True Range (ATR) on any chart. Designed for simplicity and customization, it allows traders to visualize up to six moving averages with configurable type, color, and length, while keeping real-time volatility information via ATR directly on the chart.
This indicator is perfect for spotting trends, identifying support/resistance zones, and gauging market volatility for intraday or swing trading strategies.
Key Features:
Supports up to six independent moving averages (MA1 → MA6)
Each MA is fully customizable:
Enable/disable individually
Type: EMA or SMA
Length
Color
ATR Display:
Custom timeframe
Color and position configurable
Adjustable multiplier
Compact and organized settings for easy configuration
Lightweight and efficient code for smooth chart performance
Watermark
Inputs / Settings:
MA Options: MA1 → MA6 (Enable/Disable, Type, Length, Color)
Additional Settings: ATR (Enable, Timeframe, Color, Multiplier)
How to Use:
Enable the moving averages you want to track
Configure type, length, and color for each MA
Enable ATR if needed and adjust settings
Watch MAs plotted dynamically and ATR in bottom-right corner
Recommended For:
Day traders and swing traders
Trend-following strategies
Volatility analysis and breakout detection
Traders needing a compact multi-MA dashboard
