Liquidity strategy tester [Influxum]This tool is based on the concept of liquidity. It includes 10 methods for identifying liquidity in the market. Although this tool is presented as a strategy, we see it more as a data-gathering instrument.
Warning: This indicator/strategy is not intended to generate profitable strategies. It is designed to identify potential market advantages and help with identifying effective entry points to capitalize on those advantages.
Once again, we have advanced the methods of effectively searching for liquidity in the market. With strategies, defined by various entry methods and risk management, you can find your edge in the market. This tool is backed by thorough testing and development, and we plan to continue improving it.
In its current form, it can also be used to test well-known ICT or Smart Money concepts. Using various methods, you can define market structure and identify areas where liquidity is located.
Fair Value Gaps - one of the entry signal options is fair value gaps, where an imbalance between buyers and sellers in the market can be expected.
Time and Price Theory - you can test this by setting liquidity from a specific session and testing entries as that liquidity is grabbed
Judas Swing - can be tested as a market reversal after a breakout during the first hours of trading.
Power of Three - accumulation can be observed as the market moving within a certain range, identified as cluster liquidity in our tool, manipulation occurs with the break of liquidity, and distribution is the direction of the entry.
🟪 Methods of Identifying Liquidity
Pivot Liquidity
This refers to liquidity formed by local extremes – the highest or lowest prices reached in the market over a certain period. The period is defined by a pivot number and determines how many candles before and after the high/low were higher/lower. Simply put, the pivot number represents the number of adjacent candles to the left and right, with a lower high for a pivot high and a higher low for a pivot low. The higher the number, the more significant the high/low is. Behind these local market extremes, we expect to find orders waiting for breakout as well as stop-losses.
Gann Swing
Similar to pivot liquidity, Gann swing identifies significant market points. However, instead of candle highs and lows, it focuses on the closing prices. A Gann swing is formed when a candle closes above (or below) several previous closes (the number is again defined by a strength parameter).
Percentage Change
Apart from ticks, percentages are also a key unit of market movement. In the search for liquidity, we monitor when a local high or low is formed. For liquidity defined by percentage change, a high must be a certain percentage higher than the last low to confirm a significant high. Similarly, a low must be a defined percentage away from the last significant high to confirm a new low. With the right percentage settings, you can eliminate market noise.
Session Range (3x)
Session range is a popular concept for finding liquidity, especially in smart money concepts (SMC). You can set up liquidity visualization for the Asian, London, or New York sessions – or even all three at once. This tool allows you to work with up to three sessions, so you can easily track how and if the market reacts to liquidity grabs during these sessions.
Tip for traders: If you want to see the reaction to liquidity grab during a specific session at a certain time (e.g., the well-known killzone), you can set the Trading session in this tool to the exact time where you want to look for potential entries.
Unfinished Auction
Based on order flow theory, an unfinished auction occurs when the market reverses sharply without filling all pending orders. In price action terms, this can be seen as two candles at a local high or low with very similar or identical highs/lows. The maximum difference between these values is defined as Tolerance, with the default setting being 3 ticks. This setting is particularly useful for filtering out noise during slower market periods, like the Asian session.
Double Tops and Bottoms
A very popular concept not only from smart money concepts but also among price pattern traders is the double bottom and double top. This occurs when the market stops and reverses at a certain price twice in a row. In the tool, you can set how many candles apart these bottoms/tops can be by adjusting the Length parameter. According to some theories, double bottoms are more effective when there is a significant peak between the two bottoms. You can set this in the tool as the Swing value, which defines how large the movement (expressed in ticks) must be between the two peaks/bottoms. The final parameter you can adjust is Tolerance, which defines the possible price difference between the two peaks/bottoms, also expressed in ticks.
Range or Cluster Liquidity
When the market stays within a certain price range, there’s a chance that breakout orders and stop-losses are accumulating outside of this range. Our tool defines ranges in two ways:
Candle balance calculates the average price within a candle (open, high, low, and close), and it defines consolidation when the centers of candles are within a certain distance from each other.
Overlap confirms consolidation when a candle overlaps with the previous one by a set percentage.
Daily, Weekly, and Monthly Highs or Lows
These options simply define liquidity as the previous day’s, week’s, or month’s highs or lows.
Visual Settings
You can easily adjust how liquidity is displayed on the chart, choosing line style, color, and thickness. To display only uncollected liquidity, select "Delete grabbed liquidity."
Liquidity Duration
This setting allows you to control how long liquidity areas remain valid. You can cancel liquidity at the end of the day, the second day, or after a specific number of candles.
🟪 Strategy
Now we come to the part of working with strategies.
Max # of bars after liquidity grab – This parameter allows you to define how many candles you can search for entry signals from the moment liquidity is grabbed. If you are using engulfing as an entry signal, which consists of 2 candles, keep in mind that this number must be at least 2. In general, if you want to test a quick and sharp reaction, set this number as low as possible. If you want to wait for a structural change after the liquidity grab, which may require more candles, set the number a bit higher.
🟪 Strategy - entries
In this section, we define the signals or situations where we can enter the market after liquidity has been taken out.
Liquidity grab - This setup triggers a trade immediately after liquidity is grabbed, meaning the trade opens as the next candle forms.
Close below, close above - This refers to situations where the price closes below liquidity, but then reverses and closes above liquidity again, suggesting the liquidity grab was a false breakout.
Over bar - This occurs when the entire candle (high and low) passes beyond the liquidity level but then experiences a pullback.
Engulfing - A popular price action pattern that is included in this tool.
2HL - weak, medium, strong - A variation of a popular candlestick pattern.
Strong bar - A strong reactionary candle that forms after a liquidity grab. If liquidity is grabbed at a low, this would be a strong long candle that closes near its high and is significantly larger compared to typical volatility.
Naked bar - A candlestick pattern we’ve tested that serves as a good confirmation of market movement.
FVG (Fair Value Gap) - A currently popular concept. This is the only signal with additional settings. “Pending FVG order valid” means if a fair value gap forms after a liquidity grab, a limit order is placed, which remains valid for a set number of candles. “FVG minimal tick size” allows you to filter based on the gap size, measured in ticks. “GAP entry model” lets you decide whether to place the limit order at the gap close or its edge.
🟪 Strategy - General
Long, short - You can choose whether to focus on long or short trades. It’s interesting to see how long and short trades yield different results across various markets.
Pyramiding - By default, the tool opens only one trade at a time. If a new signal arises while a trade is open, it won’t enter another position unless the pyramiding box is checked. You also need to set the maximum number of open trades in the Properties.
Position size - Simply set the size of the traded position.
🟪 Strategy - Time
In this section, you can set time parameters for the strategy being tested.
Test since year - As the name implies, you can limit the testing to start from a specific year.
Trading session - Define the trading session during which you want to test entries. You can also visualize the background (BG) for confirmation.
Exclude session - You can set a session period during which you prefer not to search for trades. For example, when the New York session opens, volatility can sharply increase, potentially reducing the long-term success rate of the tested setup.
🟪 Strategy - Exits
This section lets you define risk management rules.
PT & SL - Set the profit target (PT) and stop loss (SL) here.
Lowest/highest since grab - This option sets the stop loss at the lowest point after a liquidity grab at a low or at the highest point after a liquidity grab at a high. Since markets usually overshoot during liquidity grabs, it’s good practice to place the stop loss at the furthest point after the grab. You can also set your risk-reward ratio (RRR) here. A value of 1 sets an RRR of 1:1, 2 means 2:1, and so on.
Lowest/highest last # bars - Similar to the previous option, but instead of finding the extreme after a liquidity grab, it identifies the furthest point within the last number of candles. You can set how far back to look using the # bars field (for an engulfing pattern, 2 is optimal since it’s made of two candles, and the stop loss can be placed at the edge of the engulfing pattern). The RRR setting works the same way as in the previous option.
Other side liquidity grab - If this option is checked, the trade will exit when liquidity is grabbed on the opposite side (i.e., if you entered on a liquidity grab at a low, the trade will exit when liquidity is grabbed at a high).
Exit after # bars - A popular exit strategy where you close the position after a set number of candles.
Exit after # bars in profit - This option exits the trade once the position is profitable for a certain number of consecutive candles. For example, if set to 5, the position will close when 5 consecutive candles are profitable. You can also set a maximum number of candles (in the max field), ensuring the trade is closed after a certain time even if the profit condition hasn’t been met.
🟪 Alerts
Alerts are a key tool for traders to ensure they don’t miss trading opportunities. They also allow traders to manage their time effectively. Who would want to sit in front of the computer all day waiting for a trading opportunity when they could be attending to other matters? In our tool, you currently have two options for receiving alerts:
Liquidity grabs alert – if you enable this feature and set an alert, the alert will be triggered every time a candle on the current timeframe closes and intersects with the displayed liquidity line.
Entry signals alert – this feature triggers an alert when a signal for entry is generated based on the option you’ve selected in the Entry type. It’s an ideal way to be notified only when a trading opportunity appears according to your predefined rules.
Tìm kiếm tập lệnh với "Candlestick"

IsAlgo - AI Trend Strategy► Overview:
The AI Trend Strategy employs a combination of technical indicators to guide trading decisions across various markets and timeframes. It uses a custom Super Trend indicator and an Exponential Moving Average (EMA) to analyze market trends and executes trades based on specific candlestick patterns. This strategy includes options for setting stop losses, take profit levels, and features an alert system for trade notifications.
► Description:
This strategy focuses on identifying the optimal "entry candle," which signals either a potential correction within the ongoing trend or the emergence of a new trend. The entry criteria for this candle are highly customizable, allowing traders to specify dimensions such as the candle's minimum and maximum size and body ratio. Additional settings include whether this candle should be the highest or lowest compared to recent candles and if a confirmation candle is necessary to validate the entry.
The Super Trend indicator is central to the strategy’s operation, dictating the direction of trades by identifying bullish or bearish trends. Traders have the option to configure trades to align with the direction of the trend identified by this indicator, or alternatively, to take positions counter to the trend for potential reversal strategies. This flexibility can be crucial during varying market conditions.
Additionally, the strategy incorporates an EMA alongside the Super Trend indicator to further analyze trend directions. This combined approach aims to reduce the occurrence of false signals and improve the strategy's overall trend analysis.
The learning algorithm is a standout feature of the AI Trend Strategy. After accumulating data from a predefined number of trades (e.g., after the first 100 trades), the algorithm begins to analyze past performances to identify patterns in wins and losses. It considers variables such as the distance from the current price to the trend line, the range between the highest and lowest prices during the trend, and the duration of the trend. This data informs the algorithm's predictions for future trades, aiming to improve accuracy and reduce losses by adapting to the evolving market conditions.
► Examples of Trade Execution:
1. In an Uptrend: The strategy might detect a suitable entry candle during a correction phase, which aligns with the continuing uptrend for a potential long trade.
2. In a Downtrend: Alternatively, the strategy might identify an entry candle at the end of a downtrend, suggesting a potential reversal or correction where a long trade could be initiated.
3. In an Uptrend: The strategy may also spot an entry candle at the end of an uptrend and execute a short trade, anticipating a reversal or significant pullback.
4. In a Downtrend: The strategy might find a suitable entry candle during a correction phase, indicating a continuation of the downtrend for a potential short trade.
These examples illustrate how the strategy identifies potential trading opportunities based on trend behavior and candlestick patterns.
► Features and Settings:
⚙︎ Trend: Utilizes a custom Super Trend indicator to identify the direction of the market trend. Users can configure the strategy to execute trades in alignment with this trend, take positions contrary to the trend, or completely ignore the trend information for their trading decisions.
⚙︎ Moving average: Employs an Exponential Moving Average (EMA) to further confirm the trend direction indicated by the Super Trend indicator. This setting can be used in conjunction with the Super Trend or disabled if preferred.
⚙︎ Entry candle: Defines the criteria for the candle that triggers a trade. Users can customize aspects such as the candle's size, body, and its relative position to previous candles to ensure it meets specific trading requirements before initiating a trade.
⚙︎ Learning algorithm: This component uses historical trade data to refine the strategy. It assesses various aspects of past trades, such as price trends and market conditions, to make more informed trading decisions in the future.
⚙︎ Trading session: Users can define specific trading hours during which the strategy should operate, allowing trades to be executed only during preferred market periods.
⚙︎ Trading days: This option enables users to specify which days the strategy should be active, providing the flexibility to avoid trading on certain days of the week if desired.
⚙︎ Backtesting: Enables a period during which the strategy can be tested over a selected start and end date, with an option to deactivate this feature if not needed.
⚙︎ Trades: Detailed configuration options include the direction of trades (long, short, or both), position sizing (fixed or percentage-based), the maximum number of open trades, and limitations on the number of trades per day or based on trend changes.
⚙︎ Trades Exit: Offers various strategies for exiting trades, such as setting limits on profits or losses, specifying the duration a trade should remain open, or closing trades based on trend reversal signals.
⚙︎ Stop loss: Various methods for setting stop losses are available, including fixed pips, based on Average True Range (ATR), or utilizing the highest or lowest price points within a designated number of previous candles. Another option allows for closing the trade after a specific number of candles moving in the opposite direction.
⚙︎ Break even: This feature adjusts the stop loss to a break-even point under certain conditions, such as reaching predefined profit levels, to protect gains.
⚙︎ Trailing stop: The trailing stop feature adjusts the stop loss as the trade moves into profit, aiming to secure gains while potentially capturing further upside.
⚙︎ Take profit: Up to three take profit levels can be established using various methods, such as a fixed amount of pips, risk-to-reward ratios based on the stop loss, ATR, or after a set number of candles that move in the direction of the trade.
⚙︎ Alerts: Includes a comprehensive alert system that informs the user of all significant actions taken by the strategy, such as trade openings and closings. It supports placeholders for dynamic values like take profit levels, stop loss prices, and more.
⚙︎ Dashboard: Provides a visual display of detailed information about ongoing and past trades on the chart, helping users monitor the strategy’s performance and make informed decisions.
► Backtesting Details:
Timeframe: 15-minute BTCUSD chart.
Initial Balance: $10,000.
Order Size: 4% of equity per trade.
Commission: 0.01%.
Slippage: 5 ticks.
Risk Management: Strategic stop loss settings are applied based on the most extreme price points within the last 18 candles.

Open High Low StrategyThis is a very simple, yet effective and to some extend widely followed scalping strategy to capture the underling sentiments of the counter whether it will go up or down.
What is it?
This is Open-High-Low (OLH) strategy.
As you already aware of Candlestick patterns, there is patterns called as Marubozu patterns where the sell wick or buy wick either ceases to exists (or very small). This is exactly in the same principle.
In OLH strategy: The buy signal appears when the Open Price is the Low Price. It means if you draw the candlestick, there is no bottom wick. So after the opening of the candle, the demand drives the price up to the level, some selling may or may not come and closes in green. This indicates a strong upward biasness of the underlying counter.
Similarly, a sell signal appears when the Open price is the High Price. It means there is no upper wick. So there is no buying pressure, since the opening of the candle, sellers are in force and pulls down the price to a closing.
This strategy generates the signal at the close of the candle (technically barstate.isconfirmed). Because until the bar is real-time there is no option to know the final closing or high. So you will see the bar on which it generates the buy or sell signal is actually indicates the previous bar as OLH bar.
To determine the Stop-Loss, it uses the most widely known SL calculation of:
For buy signal, it takes the low of the last 7 candles and substract the ATR (Average True Range) of 14-period.
For sell signal, it takes the high of the last 7 candles and add it to the ATR (Average True Range) of 14-period.
One can plot the SL lines as dotted green and red lines as well to see visually.
Default Risk:Reward is 1:2, Can be customizable.
What is Unique?
Of course the utter simplistic nature of this strategy is it's key point. Very easy and intuitive to understand.
There are awesome strategies in this forum that talks about the various indicators combinations and what not.
Instead of all this, in a 15m NSE:NIFTY chart, it generates a good ~ 47% profit-factor with 1:2 Risk Reward ratio. Means if you loose a trade you will loose 1% of account and if you win you will gain 2%. Means 3 trades (2 profits and 1 loss) in a trading session result 3% overall gain for the day. (Assuming you are ready with 1% draw down of your account per trade, at max).
Disclaimer:
This piece of software does not come up with any warrantee or any rights of not changing it over the future course of time.
We are not responsible for any trading/investment decision you are taking out of the outcome of this indicator.

Bullish Harami Backtest This is a bullish reversal pattern formed by two candlesticks in which a small
real body is contained within the prior session's unusually large real body.
Usually the second real body is the opposite color of the first real body.
The Harami pattern is the reverse of the Engulfing pattern.
WARNING:
- For purpose educate only
- This script to change bars colors.

Bearish Harami Backtest This is a bearish reversal pattern formed by two candlesticks in which a short
real body is contained within the prior session's long real body. Usually the
second real body is the opposite color of the first real body. The Harami pattern
is the reverse of the Engulfing pattern.
WARNING:
- For purpose educate only
- This script to change bars colors.

Wavelet Candlestick Slope Follower-Master Edition Here is a short description of this script:
This is a **Trend Following strategy** that utilizes advanced mathematics—the **Wavelet Transform**—to filter out market noise.
**Key Features:**
1. **Synthetic Candles:** The script does not analyze raw prices. Instead, it constructs "Wavelet Candles"—smoothed candles created through mathematical convolution of prices with a specific wavelet "kernel" (e.g., Mexican Hat, Morlet, Haar).
2. **Auto-Correction (Normalization):** This is the most critical technical feature of this code. The script automatically normalizes the weights. This ensures that even when using complex mathematical shapes (like the Mexican Hat), the output price remains accurate to the real chart scale and is not distorted.
3. **Strategy Logic:** The logic is very straightforward—the system enters a **Long** position when the smoothed closing price (`w_close`) is rising, and closes the position when it starts to fall.
4. **Visualization:** It draws new, cleaner candles (green/red) on the chart, revealing the "true" trend structure after filtering out temporary fluctuations.
This is a example of use idea of wavelet candle

Freedom Candlestick v5.0.5The is a momentum trading strategy for futures. There are also components of ICT, trend following, volume distribution, and volatility involved in the logic. We are currently using it on NQ and GC. We are also in the process of building a set up to work with ES.


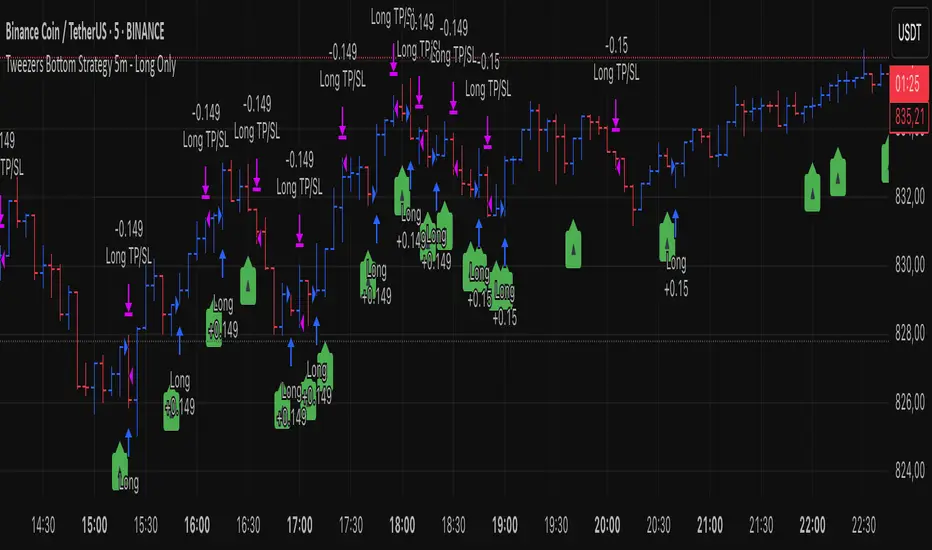
Tweezers Bottom Strategy 5m - Long OnlyTweezers Bottom 5m Strategy – Catch Reversals Like a Pro!
Looking for fast, precise entries on the 5-minute chart? This strategy automatically detects the Tweezers Bottom candlestick pattern and opens long positions at the perfect moment. Signals appear as ▲ arrows on the chart, making it incredibly easy to spot high-probability setups.
Risk and Reward Perfectly Managed: Stop-loss is set just 0.1% below entry, and take-profit at 0.3% above, giving you a clear, controlled trading edge. All levels are visualized on the chart with lines and labels, so you always know where your risk and profit targets are.
Ideal for scalpers and short-term traders across Forex, crypto, and stocks. Enter reversals before the crowd, maximize your winning trades, and automate your trading with minimal risk!
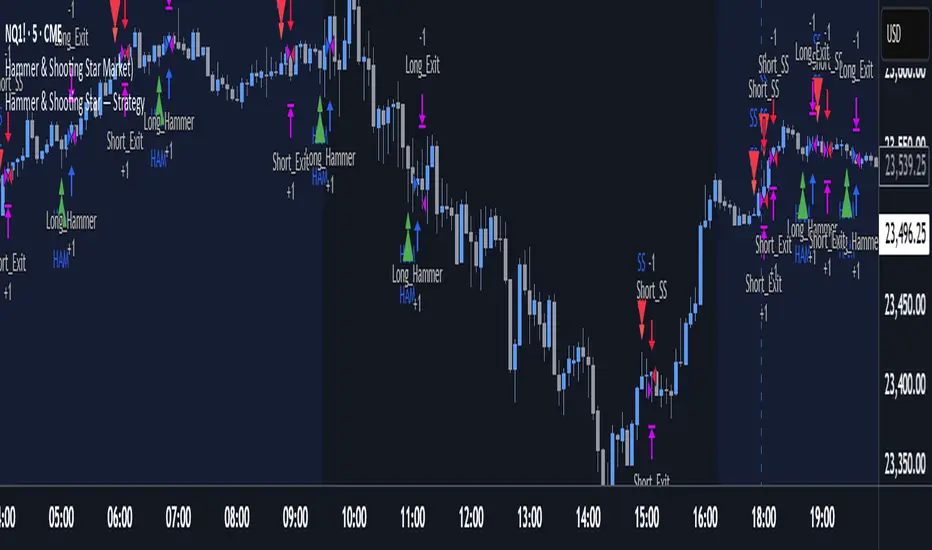
Hammer & Shooting Star — StrategyHammer & Shooting Star Strategy for Intraday Trading
This strategy identifies two candlestick patterns commonly used in technical analysis:
Hammer Candles (a bullish reversal signal):
A hammer candle has a small body at the top with a long lower wick. The strategy goes long on the next bar open when a hammer is detected, with a stop loss at the low of the hammer bar and a target at the high.
Shooting Star Candles (a bearish reversal signal):
A shooting star candle has a small body at the bottom with a long upper wick. The strategy goes short on the next bar open when a shooting star is detected, with a stop loss at the high of the shooting star bar and a target at the low.
Intra Bullish Strategy - Profit Ping v4.0ProfitPing 4.0 is a high-precision intraday swing trading strategy designed for global equity markets, including the US, South Africa, and Australia. The system identifies high-probability BUY and EXIT signals using a confluence of technical indicators and real-time volume dynamics.
🧠 Key Features:
Dual EMA Crossover (7 & 14) for short-term trend confirmation
Volume Spike Detection based on 20-period moving average
RSI Momentum Filter (ideal zone: 55–65) to avoid overbought entries
MACD Histogram & Signal Line Sync for trend momentum validation
Candlestick Pattern Filtering (e.g. bullish engulfing, flags, breakout candles)
Multi-Timeframe Confirmation (optional) for intraday trend alignment
Dynamic Risk-to-Reward Logic built into alert framework
Webhook-compatible JSON alerts for automation to Google Sheets, Power BI, and IBKR
🛠️ Alert System:
BUY alert triggers when all bullish conditions align
EXIT alert triggers only if a previous BUY exists for that ticker
Trade status is updated live in Google Sheets and integrated with Power BI dashboards
Orphaned EXITs (no matched BUY) are tracked separately for accuracy review
🔄 Ideal For:
Traders seeking 1:2 to 1:5 risk/reward setups
Automation-focused workflows (via TradingView → Google Sheets → Power BI)
Swing traders wanting clean visual logs, automated P&L tracking, and optional IBKR execution

CryptoPulse AI### CryptoPulse AI Strategy
This strategy combines Bollinger Bands, multi-timeframe EMAs (200 and 50), and candlestick wick detection for crypto trading signals. Long entries trigger on downward wicks breaking lower BB with upward EMA trend; shorts on upward wicks breaking upper BB with downward EMA trend. Includes ATR-based risk management, position sizing, and R:R targets. Overlay on any chart; supports leverage (100% margin). Visual lines/labels for TP/SL/entries; alerts for webhooks.
- **Account Balance (Default: 10000)**: Initial balance for calculating risk and position size; increase for larger accounts.
- **BB Length (Default: 20)**: Periods for Bollinger Bands basis and deviation; shorter for more signals, longer for smoothing.
- **BB Multiplier (Default: 2.0)**: Std dev factor for band width; higher widens bands, reducing false breakouts.
- **Wick to Body Ratio (Default: 1.1)**: Min wick size vs. body for valid signals (1.1 = 10% larger); higher requires stronger wicks.
- **Risk Per Trade (%) (Default: 2.0)**: Account percentage risked per trade; lower for conservative sizing.
- **Risk:Reward Ratio (Default: 6.0)**: Target profit multiple of risk; higher aims for bigger wins.
- **SL Multiplier (Default: 9.0)**: ATR factor for stop loss distance; adjust based on volatility.
- **Line Length (bars) (Default: 25)**: Bars to extend TP/SL/entry lines; longer for better visibility.
- **Label Position (Default: left)**: Text placement relative to lines (left/right); choose for chart clarity.
- **ATR Period (Default: 14)**: Periods for ATR volatility measure; affects SL and position size.
- **EMA Timeframe (Default: 5 min)**: Resolution for EMA 200/50 calculation; use lower TFs for finer trend confirmation.
- **Visuals**: BB plots (blue basis, green upper, red lower); EMA200 (red), EMA50 (green); red/green lines/labels for sell/buy entries, SL (red), TP (green).
- **Alerts**: Conditions for buy/sell signals with webhook messages for integration (e.g., Bitget).

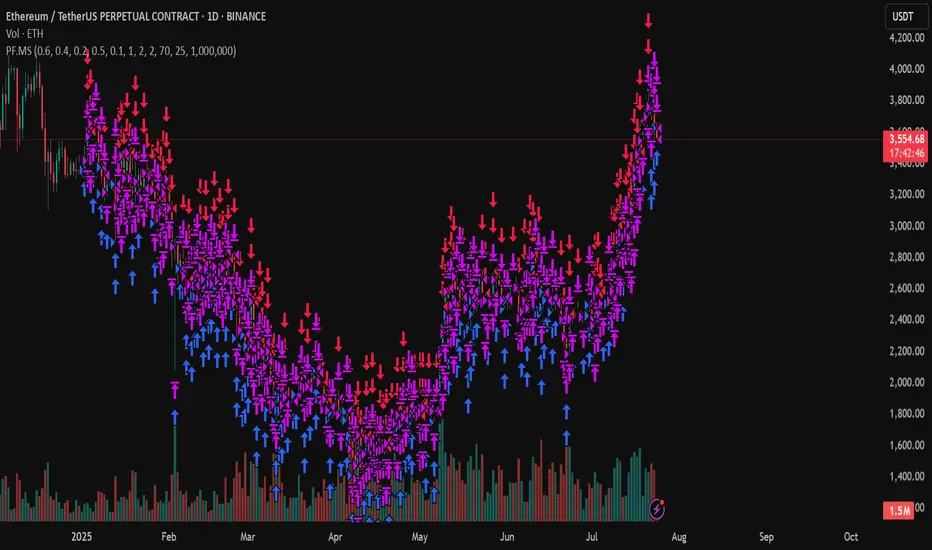
PF.MSThe Pressure & Flow Momentum Strategy (PF.MS) detects market pressure buildup through advanced candlestick analysis and captures momentum flow when conditions align, providing accurate buy and sell signals across cryptocurrencies and stocks—but even sophisticated strategies can be wrong when markets turn brutal without warning. The system reads real-time pressure dynamics (buying vs selling forces, wick patterns, volatility conditions) to identify when smart money is positioning, then captures the resulting momentum flow with precise entry and exit timing. While highly accurate at detecting pressure shifts and momentum changes, the strategy can still face losses during sudden news events or when market sentiment overrides technical patterns. The PF.MS combines intelligent pressure detection with momentum capture, trailing profit protection and strict stop losses
Liquidity + Internal Market Shift StrategyLiquidity + Internal Market Shift Strategy
This strategy combines liquidity zone analysis with the internal market structure, aiming to identify high-probability entry points. It uses key liquidity levels (local highs and lows) to track the price's interaction with significant market levels and then employs internal market shifts to trigger trades.
Key Features:
Internal Shift Logic: Instead of relying on traditional candlestick patterns like engulfing candles, this strategy utilizes internal market shifts. A bullish shift occurs when the price breaks previous bearish levels, and a bearish shift happens when the price breaks previous bullish levels, indicating a change in market direction.
Liquidity Zones: The strategy dynamically identifies key liquidity zones (local highs and lows) to detect potential reversal points and prevent trades in weak market conditions.
Mode Options: You can choose to run the strategy in "Both," "Bullish Only," or "Bearish Only" modes, allowing for flexibility based on market conditions.
Stop-Loss and Take-Profit: Customizable stop-loss and take-profit levels are integrated to manage risk and lock in profits.
Time Range Control: You can specify the time range for trading, ensuring the strategy only operates during the desired period.
This strategy is ideal for traders who want to combine liquidity analysis with internal structure shifts for precise market entries and exits.
This description clearly outlines the strategy's logic, the flexibility it provides, and how it works. You can adjust it further to match your personal trading style or preferences!

Heiken Ashi Supertrend ATR-SL StrategyThis indicator combines Heikin Ashi candle pattern analysis with Supertrend to generate high-probability trading signals with built-in risk management. It identifies potential entries and exits based on specific Heikin Ashi candlestick formations while providing automated ATR-based stop loss management.
Trading Logic:
The system generates long signals when a green Heikin Ashi candle forms with no bottom wick (indicating strong bullish momentum). Short signals appear when a red Heikin Ashi candle forms with no top wick (showing strong bearish momentum). The absence of wicks on these candles signals a high-conviction market move in the respective direction.
Exit signals are triggered when:
1. An opposite pattern forms (red candle with no top wick exits longs; green candle with no bottom wick exits shorts)
2. The ATR-based stop loss is hit
3. The break-even stop is activated and then hit
Technical Approach:
- Select Heiken Ashi Canldes on your Trading View chart. Entried are based on HA prices.
- Supertrend and ATR-based stop losses use real price data (not HA values) for trend determination
- ATR-based stop losses automatically adjust to market volatility
- Break-even functionality moves the stop to entry price once price moves a specified ATR multiple in your favor
Risk Management:
- Default starting capital: 1000 units
- Default risk per trade: 10% of equity (customizable in strategy settings)
- Hard Stop Loss: Set ATR multiplier (default: 2.0) for automatic stop placement
- Break Even: Configure ATR threshold (default: 1.0) to activate break-even stops
- Appropriate position sizing relative to equity and stop distance
Customization Options:
- Supertrend Settings:
- Enable/disable Supertrend filtering (trade only in confirmed trend direction)
- Adjust Factor (default: 3.0) to change sensitivity
- Modify ATR Period (default: 10) to adapt to different timeframes
Visual Elements:
- Green triangles for long entries, blue triangles for short entries
- X-marks for exits and stop loss hits
- Color-coded position background (green for long, blue for short)
- Clearly visible stop loss lines (red for hard stop, white for break-even)
- Comprehensive position information label with entry price and stop details
Implementation Notes:
The indicator tracks positions internally and maintains state across bars to properly manage stop levels. All calculations use confirmed bars only, with no repainting or lookahead bias. The system is designed for swing trading on timeframes from 1-hour and above, where Heikin Ashi patterns tend to be more reliable.
This indicator is best suited for traders looking to combine the pattern recognition strengths of Heikin Ashi candles with the trend-following capabilities of Supertrend, all while maintaining disciplined risk management through automated stops.

3Commas Multicoin Scalper LITE [SwissAlgo]
Introduction
Are you tired of tracking cryptocurrency charts and placing orders manually on your Exchange?
The 3Commas Multicoin Scalper LITE is an automated trading system designed to identify and execute potential trading setups on multiple cryptocurrencies ( simultaneously ) on your preferred Exchange (Binance, Bybit, OKX, Gate.io, Bitget) via 3Commas integration.
It analyzes price action, volume, momentum, volatility, and trend patterns across two categories of USDT Perpetual coins: the 'Top Major Coins' category (11 established cryptocurrencies) and your Custom Category (up to 10 coins of your choice).
The indicator sends real-time trading signals directly to your 3Commas bots for automated execution, identifying both trend-following and contrarian trading opportunities in all market conditions.
Trade automatically all coins of one or more selected categories:
----------------------------------------------
What it Does
The 3Commas Multicoin Scalper LITE is a technical analysis tool that monitors multiple cryptocurrency pairs simultaneously and connects with 3Commas for signal delivery and execution.
Here's how the strategy works:
🔶 Technical Analysis : Analyzes price action, volume, momentum, volatility, and trend patterns across USDT Perpetual Futures contracts simultaneously.
🔶 Pattern Detection : Identifies specific candle patterns and technical confluences that suggest potential trading setups across USDT.P contracts of the selected category.
🔶 Signal Generation : When technical criteria are met at bar close, the indicator creates deal-start signals for the relevant pairs.
🔶 3Commas Integration : Packages these signals and delivers them to 3Commas through TradingView alerts, allowing 3Commas bots to receive specific pair information ('Deal-Start' signals).
🔶 Category Management : Each TradingView alert monitors an entire category, allowing selective activation of different crypto categories.
🔶 Visual Feedback : Provides color-coded candles and backgrounds to visualize technical conditions, with optional pivot points and trend visualization.
Candle types
Signals
----------------------------------------------
Quick Start Guide
1. Setup 3Commas Bots : Configure two DCA bots in 3Commas (All USDT pairs) - one for LONG positions and one for SHORT positions.
2. Define Trading Parameters : Set your budget for each trade and adjust your preferred sensitivity within the indicator settings.
3. Create Category Alerts : Set up one TradingView alert for each crypto category you want to trade.
That's it! Once configured, the system automatically sends signals to your 3Commas bots when predefined trading setups are detected across coins in your selected/activated categories. The indicator scans all coins at bar close (for example, every hour on the 1H timeframe) and triggers trade execution only for those showing technical confluences.
Important : Consider your total capital when enabling categories. More details about the setup process are provided below (see paragraph "Detailed Setup & Configuration").
----------------------------------------------
Built-in Backtesting
The 3Commas Multicoin Scalper LITE includes backtesting visualization for each coin. When viewing any USDT Perpetual pair on your chart, you can visualize how the strategy would have performed historically on that specific asset.
Color-coded candles and signal markers show past trading setups, helping you evaluate which coins responded best to the strategy. This built-in backtesting capability can support your selection of assets/categories to trade before deploying real capital.
As backtesting results are hypothetical and do not guarantee future performance, your research and analysis are essential for selecting the crypto categories/coins to trade.
The default strategy settings are: Start Capital 1,000$, leverage 10X, Commissions 0.1% (average Taker Fee on Exchanges for average users), Order Amount 200$ for Longs/Shorts, Slippage 4
Example of backtesting view
----------------------------------------------
Key Features
🔶 Multi-Exchange Support : Compatible with BINANCE, BYBIT, BITGET, GATEIO, and OKX USDT Perpetual markets (USDT.P)
🔶 Category Options : Analyze cryptocurrencies in the Top Major Coins category or create your custom watchlist
🔶 Custom Category Option : Create your watchlist with up to 10 custom USDT Perpetual pairs
🔶 3Commas Integration : Seamlessly connects with 3Commas bots to automate trade entries and exits
🔶 Dual Strategy Approach : Identifies both "trend following" and "contrarian" potential setups
🔶 Confluence-Based Signals : Uses a combination of multiple technical factors - price spikes, price momentum, volume spikes, volume momentum, trend analysis, and volatility spikes - to generate potential trading setups
🔶 Risk Management : Adjustable sensitivity/risk levels, leverage settings, and budget allocation for each trade
🔶 Visual Indicators : Color-coded candles and trading signals provide visual feedback on market conditions
🔶 Trend Indication : Background colors showing ongoing uptrends/downtrends
🔶 Pivot Points & Daily Open : Optional display of pivot points and daily open price for additional context
🔶 Liquidity Analysis : Optional display of high/low liquidity timeframes throughout the trading week
🔶 Trade Control : Configurable limit for the maximum number of signals sent to 3Commas for execution (per bar close and category)
5 Available Exchanges
Pick coins/tokens and defined your Custom Category
----------------------------------------------
Methodology
The 3Commas Multicoin Scalper LITE utilizes a multi-faceted approach to identify potential trading setups:
1. Price Action Analysis : Detects abnormal price movements by comparing the current candle's range to historical averages and standard deviations, helping identify potential "pump and dump" scenarios or new-trends start
2. Price Momentum : Evaluates the relative strength of bullish vs. bearish price movements over time, indicating the build-up of buying or selling pressure.
3. Volume Analysis: Identifies unusual volume spikes by comparing current volume to historical averages, signaling strong market interest in a particular direction.
4. Volume Momentum : Measures the ratio of bullish to bearish volume, revealing the dominance of buyers or sellers over time.
5. Trend Analysis : Combines EMA slopes, RSI, and Stochastic RSI to determine overall trend direction and strength.
6. Volatility : Monitors the ATR (Average True Range) to detect periods of increased market volatility, which may indicate potential breakouts or reversals
7. Candle Wick Analysis : Evaluates upper and lower wick percentages to detect potential rejection patterns and reversals.
8. Pivot Point Analysis : Uses pivot points (PP, R1-R3, S1-S3) for identifying key support/resistance areas and potential breakout/breakdown levels.
9. Daily Open Reference: Analyzes price action relative to the daily open for potential setups related to price movement vs. the opening price
10. Market Timing/Liquidity : Evaluates high/low liquidity periods, specific days/times of heightened risk, and potential market manipulation timeframes.
11. Boost Factors : Applies additional weight to certain confluence patterns to adjust global scores
These factors are combined into a "Global Score" ranging from -1 to +1 , applied at bar close to the newly formed candles.
Scores above predefined thresholds (configurable via the Sensitivity Settings) indicate strong bullish or bearish conditions and trigger signals based on predefined patterns. The indicator then applies additional filters to generate specific "Trend Following" and "Contrarian" trading signals. The identified signals are packaged and sent to 3Commas for execution.
Pivot Points
Trend Background
----------------------------------------------
Who This Strategy Is For
The 3Commas Multicoin Scalper LITE may benefit:
Crypto Traders seeking to automate their trading across multiple coins simultaneously
3Commas Users looking to enhance their bot performance with technical signals
Busy Traders who want to monitor market opportunities without constant chart-watching
Multi-strategy traders interested in both trend-following and reversal trading approaches
Traders of Various Experience Levels from intermediate traders wanting to save time to advanced traders seeking to optimize their operations
Perpetual Futures Traders on major exchanges (Binance, Bybit, OKX, Gate.io, Bitget)
Swing and Scalp Traders seeking to identify short to medium-term profit opportunities
----------------------------------------------
Visual Indicators
The indicator provides visual feedback through:
1. Candlestick Colors :
* Lime: Strong bullish candle (High positive score)
* Blue: Moderate bullish candle (Medium positive score)
* Red: Strong bearish candle (High negative score)
* Purple: Moderate bearish candle (Medium negative score)
* Pale Green/Red: Mild bullish/bearish candle
2. Signal Markers :
* ↗: Trend following Long signal
* ↘: Trend following Short signal
* ⤴: Contrarian Long signal
* ⤵: Contrarian Short signal
3. Optional Elements :
* Pivot Points: Daily support/resistance levels (R1-R3, S1-S3, PP)
* Daily Open: Reference price level for the current trading day
* Trend Background: Color-coded background suggesting potential ongoing uptrend/downtrend
* Liquidity Highlighting: Background colors indicating typical high/low market liquidity periods
4. TradingView Strategy Plots and Backtesting Data : Standard performance metrics showing entry/exit points, equity curves, and trade statistics, based on the signals generated by the script.
----------------------------------------------
Detailed Setup & Configuration
The indicator features a user-friendly input panel organized in sequential steps to guide you through the complete setup process. Tooltips for each step provide additional information to help you understand the actions required to get the strategy running.
Informative tables provide additional details and instructions for critical setup steps such as 3Commas bot configuration and TradingView alert creation (to activate trading on specific categories).
1. Choose Exchange, Crypto Category & Sensitivity
* Select your USDT Perpetual Exchange (BINANCE, BYBIT, BITGET, GATEIO, or OKX) - i.e. the same Exchange connected in your 3Commas account
* Choose your preferred crypto category, or define your watchlist
* Choose from three sensitivity levels: Default, Aggressive, or Test Mode (test mode is designed to generate more signals, a potentially helpful feature when you are testing the indicator and alerts)
2. Setup 3Commas Bots and integrate them with the algo
* Create both LONG and SHORT DCA Bots in 3Commas
* Configure bots to accept signals for 'All USDT Pairs' with "TradingView Custom Signal" as deal start condition
* Enter your Bot IDs and Email Token in the indicator settings
* Set a maximum budget for LONG and SHORT trades
* Choose whether to allow LONG trades, SHORT trades, or both, according to your preference and market analysis
* Set maximum trades per bar/category (i.e. the max. number of simultaneous signals that the algo may send to your 3Commas bots for execution at every bar close - every hour if you set the 1H timeframe)
* Access the detailed setup guide table for step-by-step 3Commas configuration instructions
3Commas integration
3. Choose Visuals
* Toggle various optional visual elements to add to the chart: category metrics, fired alerts, coin metrics, daily open, pivot points
* Select a color theme: Dark or Light
4. Activate Trading via Alerts
* Create TradingView alerts for each category you want to trade
* Set alert condition to "3Commas Multicoin Scalper" with "Any alert() function call"
* Set the content of the message field to: {{Message}}, deleting the default content shown in this text field, to enable proper 3Commas integration (any other text than {{Message}}, would break the delivery trading signals from Tradingview to 3Commas)
* View the alerts setup instruction table for visual guidance on this critical step
Alerts
Fired Alerts (example at a single bar)
Fired Alerts (frequency)
Important Configuration Notes
Ensure that the TradingView chart's exchange matches your selected exchange in the indicator settings and your 3Commas bot settings.
You must configure the same leverage in both the script and your 3Commas bots
Your 3Commas bots must be configured for All USDT pairs
You must enter the exact Bot IDs and Email Token from 3Commas (these remain confidential - no one, including us, has access to them)
If you activate multiple categories without sufficient capital, 3Commas will display " insufficient funds " errors - align your available capital with the number of categories you activate (each deal will use the budget amount specified in user inputs)
You are free to set your Take Profit % / trailing on 3Commas
We recommend not to use DCA orders (i.e. set the number of DCA orders at zero)
Legend of symbols and plots on the chart
----------------------------------------------
FAQs
General Questions
❓ Q: What features are included in this indicator? A: This indicator provides access to the "Top Major Coins" category and a custom category option where you can define up to 10 pairs of your choice. It includes multi-exchange support, 3Commas integration, a dual strategy approach, visual indicators, trade controls, and comprehensive backtesting capabilities. The indicator is optimized to manage up to 2 trades per hour/category with leverage up to 10x and trade sizes up to 500 USDT - everything needed for traders looking to automate their crypto trading across multiple pairs simultaneously.
❓ Q: What is Global Score? A: The Global Score serves as a foundation for signal generation. When a candle's score exceeds certain thresholds (defined by your Risk Level setting), it becomes a candidate for signal generation. However, not all high-scoring candles generate trading signals - the indicator applies additional pattern recognition and contextual filters. For example, a strongly positive score (lime candle) in an established uptrend may trigger a "Trend Following" signal, while a strongly negative score (red candle) in a downtrend might generate a "Trend following Short" signal. Similarly, contrarian signals are generated when specific reversal patterns occur alongside appropriate Global Score values, often involving wick analysis and pivot point interactions. This multi-layer approach helps filter out false positives and identify higher-probability trading setups.
❓ Q: What's the difference between "Trend following" and "Contrarian" signals in the script? A: "Trend Following" signals follow the identified trends while "Contrarian" signals anticipate potential trend reversals.
❓ Q: Why don't I see any signals on my chart? A: Make sure you're viewing a USDT Perpetual pair from your selected exchange that belongs to the crypto category you've chosen to analyze. For example, if you've selected the "Top Major Coins" category with Binance as your exchange, you need to view a chart of one of those specific pairs (like BINANCE:BTCUSDT.P) to see signals. If you switch exchanges, for example from Binance to Bybit, you need to pull a Bybit pair on the chart to see backtesting data and signals.
❓ Q: Does this indicator guarantee profits? A: No. Trading cryptocurrencies involves significant risk, and past performance is not indicative of future results. This indicator is a tool to help you identify potential trading setups, but it does not and cannot guarantee profits.
❓ Q: Does this indicator repaint or use lookahead bias? A: No. All trading signals generated by this indicator are based only on completed price data and do not repaint. The system is designed to ensure that backtesting results reflect as closely as possible what you should experience in live trading.
While reference levels like pivot points are kept stable throughout the day using lookahead on, the actual buy and sell signals are calculated using only historical data (lookahead off) that would have been available at that moment in time. This ensures reliability and consistency between backtesting and real-time trading performance.
Technical Setup
❓ Q: What exchanges are supported? A: The strategy supports BINANCE, BYBIT, BITGET, GATEIO, and OKX USDT Perpetual markets (i.e. all the Exchanges you can connect to your 3Commas account for USDT Perpetual trading, excluding Coinbase Perpetual that offers USDC pairs, instead of USDT).
❓ Q: What timeframe should I use? A: The indicator is optimized for the 1-hour (1H) timeframe but may run on any timeframe.
❓ Q: How many coins can I trade at once? A: You can trade all coins within the selected category. You can activate categories by setting up alerts.
❓ Q: How many alerts do I need to set up? A: You need to set up one alert for each crypto category you want to trade. We recommend starting with one category, testing the results carefully, monitoring performance daily, and perhaps activating additional categories in a second stage.
❓ Q: Are there any specific risk management features built into the indicator? A: Yes, the indicator includes risk management features: adjustable maximum trades per hour/category, the ability to enable/disable long or short signals depending on market conditions, customizable trade size for both long and short positions, and different sensitivity/risk level settings.
❓ Q: What happens if 3Commas can't execute a signal? A: If 3Commas cannot execute a signal (due to insufficient funds, bot offline, etc.), the trade will be skipped. The indicator will continue sending signals for other valid setups, but it doesn't retry failed signals.
❓ Q: Can I run this indicator on multiple charts at once? A: Yes, but it's not necessary. The indicator analyzes all coins in your selected categories regardless of which chart you apply it to. For optimal resource usage, apply it to a single chart of a USDT Perpetual pair from your selected exchange. To stop trading a category, simply delete the alert created for that category.
❓ Q: How frequently does the indicator scan for new signals? A: The indicator scans all coins in your selected categories at the close of each bar (every hour if you selected the 1H timeframe).
----------------------------------------------
⚠️
Disclaimer
This indicator is for informational and educational purposes only and does not constitute financial advice. Trading cryptocurrencies involves significant risk, including the potential loss of all invested capital, and past performance is not indicative of future results.
Always conduct your own thorough research (DYOR) and understand the risks involved before making any trading decisions. Trading with leverage significantly amplifies both potential profits and losses - exercise extreme caution when using leverage and never risk more than you can afford to lose.
The Bot ID and Email Token information are transmitted directly from TradingView to 3Commas via secure connections. No third party or entity will ever have access to this data (including the Author). Do not share your 3Commas credentials with anyone.
This indicator is not affiliated with, endorsed by, or sponsored by TradingView or 3Commas.

3Commas Multicoin Scalper PRO [SwissAlgo]Introduction
Are you tired of tracking dozens of cryptocurrency charts and placing orders manually on your Exchange?
The 3Commas Multicoin Scalper PRO is an automated trading system designed to simultaneously identify and execute potential trading setups on multiple cryptocurrencies on your preferred Exchange (Binance, Bybit, OKX, Gate.io, Bitget) via 3Commas integration.
It analyzes price action, volume, momentum, volatility, and trend patterns across 180+ USDT Perpetual coins divided into 17 crypto categories , providing real-time signals directly to your 3Commas bots for automated trade execution. This indicator aims to identify potential trend-following and contrarian setups in both bull and bear markets.
-------------------------------------
What it Does
The 3Commas Multicoin Scalper PRO is a technical analysis tool that monitors multiple cryptocurrency pairs simultaneously and connects with 3Commas for signal delivery and execution.
Here's how the strategy works:
🔶 Technical Analysis : Analyzes price action, volume, momentum, volatility, and trend patterns across multiple USDT Perpetual Futures contracts simultaneously.
🔶 Pattern Detection : Identifies specific candle patterns and technical confluences that suggest potential trading setups across all USDT.P contracts of the selected categories
🔶 Signal Generation : When technical criteria are met at bar close, the indicator creates deal-start signals for the relevant pairs.
🔶 3Commas Integration : Packages these signals and delivers them to 3Commas through TradingView alerts, allowing 3Commas bots to receive specific pair information ('Deal-Start' signals).
🔶 Category Management : Each TradingView alert monitors an entire category (approximately 11 pairs), allowing selective activation of different crypto categories.
🔶 Visual Feedback : Provides color-coded candles and backgrounds to visualize technical conditions, with optional pivot points and trend visualization.
Candle types:
Signals:
-------------------------------------
Quick Start Guide
1. Setup 3Commas Bots : Configure two DCA bots in 3Commas (All USDT pairs) - one for LONG positions and one for SHORT positions.
2. Define Trading Parameters : Set your budget for each trade and adjust your preferred sensitivity within the indicator settings.
3. Create Category Alerts : Set up one TradingView alert for each crypto category you want to trade.
That's it! Once configured, the system automatically sends signals to your 3Commas bots when predefined trading setups are detected across coins in your selected/activated categories. The indicator scans all coins at bar close (for example, every hour on the 1H timeframe) and triggers trade execution only for those showing technical confluences.
Important : The more categories you activate by setting TradingView alerts, the more signals your 3Commas bots will receive. Consider your total capital when enabling multiple categories. More details about the setup process are provided below (see paragraph "Detailed Setup & Configuration")
-------------------------------------
Built-in Backtesting
The 3Commas Multicoin Scalper PRO includes backtesting visualization for each coin. When viewing any USDT Perpetual pair on your chart, you can visualize how the strategy would have performed historically on that specific asset.
Color-coded candles and signal markers show past trading setups, helping you evaluate which coins responded best to the strategy. This built-in backtesting capability can support your selection of assets/categories to trade before deploying real capital.
As backtesting results are hypothetical and do not guarantee future performance, your research and analysis are essential for selecting the crypto categories/coins to trade.
The default strategy settings are: Start Capital 1.000$, leverage 25X, Commissions 0.1% (average Taker Fee on Exchanges for average users), Order Amount 200$ for Longs/150$ for Shorts, Slippage 4
-------------------------------------
Key Features
🔶 Multi-Exchange Support : Compatible with BINANCE, BYBIT, BITGET, GATEIO, and OKX USDT Perpetual markets (USDT.P)
🔶 Wide Asset Coverage : Simultaneously analyzes 180+ cryptocurrencies across 17 specialized crypto categories
🔶 Custom Category Option : Create your watchlist with up to 10 custom USDT Perpetual pairs
🔶 3Commas Integration : Seamlessly connects with 3Commas bots to automate trade entries and exits
🔶 Dual Strategy Approach : Identifies both "trend following" and "contrarian" potential setups
🔶 Confluence-Based Signals : Uses a combination of multiple technical factors - price spikes, price momentum, volume spikes, volume momentum, trend analysis, and volatility spikes - to generate potential trading setups
🔶 Risk Management : Adjustable sensitivity/risk levels, leverage settings, and budget allocation for each trade
🔶 Visual Indicators : Color-coded candles and trading signals provide visual feedback on market conditions
🔶 Trend Indication : Background colors showing ongoing uptrends/downtrends
🔶 Pivot Points & Daily Open : Optional display of pivot points and daily open price for additional context
🔶 Liquidity Analysis : Optional display of high/low liquidity timeframes throughout the trading week
🔶 Trade Control : Configurable limit for the maximum number of signals sent to 3Commas for execution (per bar close and category)
Available Exchanges
Categories
Custom Category
Trend following/contrarian signals
-------------------------------------
Methodology
The 3Commas Multicoin Scalper PRO utilizes a multi-faceted approach to identify potential trading setups:
1. Price Action Analysis : Detects abnormal price movements by comparing the current candle's range to historical averages and standard deviations, helping identify potential "pump and dump" scenarios or new-trends start
2. Price Momentum : Evaluates the relative strength of bullish vs. bearish price movements over time, indicating the build-up of buying or selling pressure.
3. Volume Analysis: Identifies unusual volume spikes by comparing current volume to historical averages, signaling strong market interest in a particular direction.
4. Volume Momentum : Measures the ratio of bullish to bearish volume, revealing the dominance of buyers or sellers over time.
5. Trend Analysis : Combines EMA slopes, RSI, and Stochastic RSI to determine overall trend direction and strength.
6. Volatility : Monitors the ATR (Average True Range) to detect periods of increased market volatility, which may indicate potential breakouts or reversals
7. Candle Wick Analysis : Evaluates upper and lower wick percentages to detect potential rejection patterns and reversals.
8. Pivot Point Analysis : Uses pivot points (PP, R1-R3, S1-S3) for identifying key support/resistance areas and potential breakout/breakdown levels.
9. Daily Open Reference: Analyzes price action relative to the daily open for potential setups related to price movement vs. the opening price
10. Market Timing/Liquidity : Evaluates high/low liquidity periods, specific days/times of heightened risk, and potential market manipulation timeframes.
11. Boost Factors : Applies additional weight to certain confluence patterns to adjust global scores
These factors are combined into a "Global Score" ranging from -1 to +1 , applied at bar close to the newly formed candles.
Scores above predefined thresholds (configurable via the Sensitivity Settings) indicate strong bullish or bearish conditions and trigger signals based on predefined patterns. The indicator then applies additional filters to generate specific "Trend Following" and "Contrarian" trading signals. The identified signals are packaged and sent to 3Commas for execution.
Pivot Points
Daily open
Market Trend
Liquidity patterns by weekday
-------------------------------------
Who This Strategy Is For?
The 3Commas Multicoin Scalper PRO may benefit:
Crypto Traders seeking to automate their trading across multiple coins simultaneously
3Commas Users looking to enhance their bot performance with advanced technical signals
Busy Traders who want to monitor many market opportunities without constant chart-watching
Multi-strategy traders interested in both trend-following and reversal trading approaches
Traders of Various Experience Levels from intermediate traders wanting to save time to advanced traders seeking to scale their operations
Perpetual Futures Traders on major exchanges (Binance, Bybit, OKX, Gate.io, Bitget)
Swing and Scalp Traders seeking to identify short to medium-term profit opportunities
-------------------------------------
Visual Indicators
The indicator provides visual feedback through:
1. Candlestick Colors :
* Lime: Strong bullish candle (High positive score)
* Blue: Moderate bullish candle (Medium positive score)
* Red: Strong bearish candle (High negative score)
* Purple: Moderate bearish candle (Medium negative score)
* Pale Green/Red: Mild bullish/bearish candle
2. Signal Markers :
* ↗: Trend Following Long signal
* ↘: Trend Following Short signal
* ⤴: Contrarian Long signal
* ⤵: Contrarian Short signal
3. Optional Elements :
* Pivot Points: Daily support/resistance levels (R1-R3, S1-S3, PP)
* Daily Open: Reference price level for the current trading day
* Trend Background: Color-coded background suggesting potential ongoing uptrend/downtrend
* Liquidity Highlighting: Background colors indicating typical high/low market liquidity periods
4. TradingView Strategy Plots and Backtesting Data : Standard performance metrics showing entry/exit points, equity curves, and trade statistics, based on the signals generated by the script.
-------------------------------------
Detailed Setup & Configuration
The indicator features a user-friendly input panel organized in sequential steps to guide you through the complete setup process. Tooltips for each step provide additional information to help you understand the actions required to get the strategy running.
Informative tables provide additional details and instructions for critical setup steps such as 3Commas bot configuration and TradingView alert creation (to activate trading on specific categories).
1. Choose Exchange, Crypto Category & Sensitivity
* Select your USDT Perpetual Exchange (BINANCE, BYBIT, BITGET, GATEIO, or OKX) - i.e. the same Exchange connected in your 3Commas account
* Browse and choose your preferred crypto category, or define your watchlist
* Choose from three sensitivity levels: Default, Aggressive, or Test Mode (test mode is designed to generate way more signals, a potentially helpful feature when you are testing the indicator and alerts)
2. Setup 3Commas Bots and integrate them with the algo
* Create both LONG and SHORT DCA Bots in 3Commas
* Configure bots to accept signals for 'All USDT Pairs' with "TradingView Custom Signal" as deal start condition
* Enter your Bot IDs and Email Token in the indicator settings
* Set a maximum budget for LONG and SHORT trades
* Choose whether to allow LONG trades, SHORT trades, or both, according to your preference and market analysis
* Set maximum trades per bar/category (i.e. the max. number of simultaneous signals that the algo may send to your 3Commas bots for execution at every bar close - every hour if you set the 1H timeframe)
* Access the detailed setup guide table for step-by-step 3Commas configuration instructions
3Commas integration
3. Choose Visuals
* Toggle various optional visual elements to add to the chart: category metrics, fired alerts, coin metrics, daily open, pivot points
* Select a color theme: Dark or Light
4. Activate Trading via Alerts
* Create TradingView alerts for each category you want to trade
* Set alert condition to "3Commas Multicoin Scalper" with "Any alert() function call"
* Set the content of the message filed to: {{Message}}, deleting the default content shown in this text field, to enable proper 3Commas integration (any other text than {{Message}}, would break the delivery trading signals from Tradingview to 3Commas)
* View the alerts setup instruction table for visual guidance on this critical step
Alerts
Fired Alerts
Important Configuration Notes
Ensure that the TradingView chart's exchange matches your selected exchange in the indicator settings and your 3Commas bot settings.
You must configure the same leverage in both the script and your 3Commas bots
Your 3Commas bots must be configured for All USDT pairs
You must enter the exact Bot IDs and Email Token from 3Commas (these remain confidential - no one, including us, has access to them)
If you activate multiple categories without sufficient capital, 3Commas will display " insufficient funds " errors - align your available capital with the number of categories you activate (each deal will use the budget amount specified in user inputs)
You are free to set your Take Profit % / trailing on 3Commas
We recommend not to use DCA orders (i.e. set the number of DCA orders at zero)
Legend of symbols
-------------------------------------
FAQs
General Questions
❓ Q: What is Global Score? A: The Global Score serves as a foundation for signal generation. When a candle's score exceeds certain thresholds (defined by your Risk Level setting), it becomes a candidate for signal generation. However, not all high-scoring candles generate trading signals - the indicator applies additional pattern recognition and contextual filters. For example, a strongly positive score (lime candle) in an established uptrend may trigger a "Trend Following" signal, while a strongly negative score (red candle) in a downtrend might generate a "Trend Following Short" signal. Similarly, contrarian signals are generated when specific reversal patterns occur alongside appropriate Global Score values, often involving wick analysis and pivot point interactions. This multi-layer approach helps filter out false positives and identify higher-probability trading setups.
❓ Q: What's the difference between "Trend following" and "Contrarian" signals in the script? A: "Trend Following" signals follow the identified trends while "Contrarian" signals anticipate potential trend reversals.
❓ Q: Why can't I configure all the parameters? A: We've designed the solution to be plug-and-play to prevent users from getting lost in endless configurations. The preset values have been tested against their trade-offs in terms of financial performance, average trade duration, and risk levels.
❓ Q: Why don't I see any signals on my chart? A: Make sure you're viewing a USDT Perpetual pair from your selected exchange that belongs to the crypto category you've chosen to analyze. For example, if you've selected the "Top Major Coins" category with Binance as your exchange, you need to view a chart of one of those specific pairs (like BINANCE:BTCUSDT.P) to see signals. If you switch exchanges, for example from Binance to Bybit, you need to pull a Bybit pair on the chart to see backtesting data and signals.
❓ Q: Does this indicator guarantee profits? A: No. Trading cryptocurrencies involves significant risk, and past performance is not indicative of future results. This indicator is a tool to help you identify potential trading setups, but it does not and cannot guarantee profits.
❓ Q: Does this indicator repaint or use lookahead bias? A: No. All trading signals generated by this indicator are based only on completed price data and do not repaint. The system is designed to ensure that backtesting results reflect as closely as possible what you should experience in live trading.
While reference levels like pivot points are kept stable throughout the day using lookahead on, the actual buy and sell signals are calculated using only historical data (lookahead off) that would have been available at that moment in time. This ensures reliability and consistency between backtesting and real-time trading performance.
Technical Setup
❓ Q: What exchanges are supported? A: The strategy supports BINANCE, BYBIT, BITGET, GATEIO, and OKX USDT Perpetual markets (i.e. all the Exchanges you can connect to your 3Commas account for USDT Perpetual trading, excluding Coinbase Perpetual that offers UDSC pairs, instead of USDT).
❓ Q: What timeframe should I use? A: The indicator is optimized for the 1-hour (1H) timeframe but may run on any timeframe.
❓ Q: How many coins can I trade at once? A: You can trade all coins within each selected category (up to 11 coins per category in standard categories). You can activate multiple categories by setting up multiple alerts.
❓ Q: How many alerts do I need to set up? A: You need to set up one alert for each crypto category you want to trade. For example, if you want to trade both the "Top Major Coins" and the "DeFi" categories, you'll need to create two separate alerts, one for each category. We recommend starting with one category, testing the results carefully, monitoring performance daily, and perhaps activating additional categories in a second stage.
❓ Q: Are there any specific risk management features built into the indicator? A: Yes, the indicator includes risk management features: adjustable maximum trades per hour/category, the ability to enable/disable long or short signals depending on market conditions, customizable trade size for both long and short positions, and different sensitivity/risk level settings.
❓ Q: What happens if 3Commas can't execute a signal? A: If 3Commas cannot execute a signal (due to insufficient funds, bot offline, etc.), the trade will be skipped. The indicator will continue sending signals for other valid setups, but it doesn't retry failed signals.
❓ Q: Can I run this indicator on multiple charts at once? A: Yes, but it's not necessary. The indicator analyzes all coins in your selected categories regardless of which chart you apply it to. For optimal resource usage, apply it to a single chart of a USDT Perpetual pair from your selected exchange. To stop trading a category delete the alert created for that category.
❓ Q: How frequently does the indicator scan for new signals? A: The indicator scans all coins in your selected categories at the close of each bar (every hour if you selected the 1H timeframe).
3Commas Integration
❓ Q: Do I need a 3Commas account? A: Yes, a 3Commas account with active DCA bots (both LONG and SHORT) is required for automated trade execution. A paid subscription is needed, as multipair Bots and multiple simultaneous deals are involved.
❓ Q: How do I set the leverage? A: Set the leverage identically in both the indicator settings and your 3Commas DCA bots (the max supported leverage is 50x). Always be careful about leverage, as it amplifies both profits and losses.
❓ Q: Where do I find my 3Commas Bot IDs and Email Token? A: Open your 3Commas DCA bot and scroll to the "Messages" section. You'll find the Bot ID and Email Token within any message (e.g., "Start Deal").
Display Settings
❓ Q: What does the Sensitivity setting do? A: It adjusts the sensitivity of signal generation. "Default" provides a balanced approach with moderate signal frequency. "Aggressive" lowers the thresholds for signal generation, potentially increasing trade frequency but may include more noise. "Test Mode" is the most sensitive setting, useful for testing alert configurations but not recommended for live trading. Higher risk levels may generate more signals but with potentially lower average quality, while lower risk levels produce fewer but potentially better signals.
❓ Q: What does "Show fired alerts" do? A: The "Show fired alerts" option displays a label on your chart showing which signals have been fired and sent to 3Commas during the most recent candle closes. This visual indicator helps you confirm that your alerts are working properly and shows which coins from your selected category have triggered signals. It's useful when setting up and testing the system, allowing you to verify that signals are being sent to 3Commas as expected and their frequency over time.
❓ Q: What does "Show coin/token metrics" do? A: This toggle displays detailed technical metrics for the specific coin/token currently shown on your chart. When enabled, it shows statistics for the last closed candle for that coin.
❓ Q: What does "Show most liquid days/times" do? A: This toggle displays color-coded background highlighting to indicate periods of varying market liquidity throughout the trading week. Green backgrounds show generally higher liquidity periods (typically weekday trading hours), yellow highlights potentially manipulative periods (often Sunday/Monday overnight), and gray indicates low liquidity periods (when major markets are closed or during late hours).
⚠️ Disclaimer
This indicator is for informational and educational purposes only and does not constitute financial advice. Trading cryptocurrencies involves significant risk, including the potential loss of all invested capital, and past performance is not indicative of future results.
Always conduct your own thorough research (DYOR) and understand the risks involved before making any trading decisions. Trading with leverage significantly amplifies both potential profits and losses - exercise extreme caution when using leverage and never risk more than you can afford to lose.
The Bot ID and Email Token information are transmitted directly from TradingView to 3Commas via secure connections. No third party or entity will ever have access to this data (including the Author). Do not share your 3Commas credentials with anyone.
This indicator is not affiliated with, endorsed by, or sponsored by TradingView or 3Commas.

Big Candle Identifier with RSI Divergence and Advanced Stops1. Strategy Objective
The main goal of this strategy is to:
Identify significant price momentum (big candles).
Enter trades at opportune moments based on market signals (candlestick patterns and RSI divergence).
Limit initial risk through a fixed stop loss.
Maximize profits by using a trailing stop that activates only after the trade moves a specified distance in the profitable direction.
2. Components of the Strategy
A. Big Candle Identification
The strategy identifies big candles as indicators of strong momentum.
A big candle is defined as:
The body (absolute difference between close and open) of the current candle (body0) is larger than the bodies of the last five candles.
The candle is:
Bullish Big Candle: If close > open.
Bearish Big Candle: If open > close.
Purpose: Big candles signal potential continuation or reversal of trends, serving as the primary entry trigger.
B. RSI Divergence
Relative Strength Index (RSI): A momentum oscillator used to detect overbought/oversold conditions and divergence.
Fast RSI: A 5-period RSI, which is more sensitive to short-term price movements.
Slow RSI: A 14-period RSI, which smoothens fluctuations over a longer timeframe.
Divergence: The difference between the fast and slow RSIs.
Positive divergence (divergence > 0): Bullish momentum.
Negative divergence (divergence < 0): Bearish momentum.
Visualization: The divergence is plotted on the chart, helping traders confirm momentum shifts.
C. Stop Loss
Initial Stop Loss:
When entering a trade, an immediate stop loss of 200 points is applied.
This stop loss ensures the maximum risk is capped at a predefined level.
Implementation:
Long Trades: Stop loss is set below the entry price at low - 200 points.
Short Trades: Stop loss is set above the entry price at high + 200 points.
Purpose:
Prevents significant losses if the price moves against the trade immediately after entry.
D. Trailing Stop
The trailing stop is a dynamic risk management tool that adjusts with price movements to lock in profits. Here’s how it works:
Activation Condition:
The trailing stop only starts trailing when the trade moves 200 ticks (profit) in the right direction:
Long Position: close - entry_price >= 200 ticks.
Short Position: entry_price - close >= 200 ticks.
Trailing Logic:
Once activated, the trailing stop:
For Long Positions: Trails behind the price by 150 ticks (trail_stop = close - 150 ticks).
For Short Positions: Trails above the price by 150 ticks (trail_stop = close + 150 ticks).
Exit Condition:
The trade exits automatically if the price touches the trailing stop level.
Purpose:
Ensures profits are locked in as the trade progresses while still allowing room for price fluctuations.
E. Trade Entry Logic
Long Entry:
Triggered when a bullish big candle is identified.
Stop loss is set at low - 200 points.
Short Entry:
Triggered when a bearish big candle is identified.
Stop loss is set at high + 200 points.
F. Trade Exit Logic
Trailing Stop: Automatically exits the trade if the price touches the trailing stop level.
Fixed Stop Loss: Exits the trade if the price hits the predefined stop loss level.
G. 21 EMA
The strategy includes a 21-period Exponential Moving Average (EMA), which acts as a trend filter.
EMA helps visualize the overall market direction:
Price above EMA: Indicates an uptrend.
Price below EMA: Indicates a downtrend.
H. Visualization
Big Candle Identification:
The open and close prices of big candles are plotted for easy reference.
Trailing Stop:
Plotted on the chart to visualize its progression during the trade.
Green Line: Indicates the trailing stop for long positions.
Red Line: Indicates the trailing stop for short positions.
RSI Divergence:
Positive divergence is shown in green.
Negative divergence is shown in red.
3. Key Parameters
trail_start_ticks: The number of ticks required before the trailing stop activates (default: 200 ticks).
trail_distance_ticks: The distance between the trailing stop and price once the trailing stop starts (default: 150 ticks).
initial_stop_loss_points: The fixed stop loss in points applied at entry (default: 200 points).
tick_size: Automatically calculates the minimum tick size for the trading instrument.
4. Workflow of the Strategy
Step 1: Entry Signal
The strategy identifies a big candle (bullish or bearish).
If conditions are met, a trade is entered with a fixed stop loss.
Step 2: Initial Risk Management
The trade starts with an initial stop loss of 200 points.
Step 3: Trailing Stop Activation
If the trade moves 200 ticks in the profitable direction:
The trailing stop is activated and follows the price at a distance of 150 ticks.
Step 4: Exit the Trade
The trade is exited if:
The price hits the trailing stop.
The price hits the initial stop loss.
5. Advantages of the Strategy
Risk Management:
The fixed stop loss ensures that losses are capped.
The trailing stop locks in profits after the trade becomes profitable.
Momentum-Based Entries:
The strategy uses big candles as entry triggers, which often indicate strong price momentum.
Divergence Confirmation:
RSI divergence helps validate momentum and avoid false signals.
Dynamic Profit Protection:
The trailing stop adjusts dynamically, allowing the trade to capture larger moves while protecting gains.
6. Ideal Market Conditions
This strategy performs best in:
Trending Markets:
Big candles and momentum signals are more effective in capturing directional moves.
High Volatility:
Larger price swings improve the probability of reaching the trailing stop activation level (200 ticks).

DCA StrategyIntroducing the DCA Strategy, a powerful tool for identifying long entry and exit opportunities in uptrending assets like cryptocurrencies, stocks, and gold. This strategy leverages the Heikin Ashi candlestick pattern and the RSI indicator to navigate potential price swings.
Core Functionality:
Buy Signal : A buy signal is generated when a bullish (green) Heikin Ashi candle appears after a bearish (red) one, indicating a potential reversal in a downtrend. Additionally, the RSI must be below a user-defined threshold (default: 85) to prevent buying overbought assets.
Sell Signal : The strategy exits the trade when the RSI surpasses the user-defined exit level (default: 85), suggesting the asset might be overbought.
Backtesting Flexibility : Users can customize the backtesting period by specifying the start and end years.
Key Advantages:
Trend-Following: Designed specifically for uptrending assets, aiming to capture profitable price movements.
Dynamic RSI Integration: The RSI indicator helps refine entry signals by avoiding overbought situations.
User-Defined Parameters: Allows customization of exit thresholds and backtesting periods to suit individual trading preferences.
Commission and Slippage: The script factors in realistic commission fees (0.1%) and slippage (2%) for a more accurate backtesting experience.
Beats Buy-and-Hold: Backtesting suggests this strategy outperforms a simple buy-and-hold approach in uptrending markets.
Overall, the DCA Strategy offers a valuable approach for traders seeking to capitalize on long opportunities in trending markets with the help of Heikin Ashi candles and RSI confirmation.
Slight Swing Momentum Strategy.Introduction:
The Swing Momentum Strategy is a quantitative trading strategy designed to capture mid-term opportunities in the financial markets by combining swing trading principles with momentum indicators. It utilizes a combination of technical indicators, including moving averages, crossover signals, and volume analysis, to generate buy and sell signals. The strategy aims to identify market trends and capitalize on price momentum for profit generation.
Highlights:
The strategy offers several key highlights that make it unique and potentially attractive to traders:
Swing Trading with Momentum: The strategy combines the principles of swing trading, which aim to capture short-to-medium-term price swings, with momentum indicators that help identify strong price trends and potential breakout opportunities.
Technical Indicator Optimization: The strategy utilizes a selection of optimized technical indicators, including moving averages and crossover signals, to filter out the noise and focus on high-probability trading setups. This optimization enhances the strategy's ability to identify favourable entry and exit points.
Risk Management: The strategy incorporates risk management techniques, such as position sizing based on equity and dynamic stop loss levels, to manage risk exposure and protect capital. This helps to minimize drawdowns and preserve profits.
Buy Condition:
The buy condition in the strategy is determined by a combination of factors, including A1, A2, A3, XG, and weeklySlope. Let's break it down:
A1 Condition: The A1 condition checks for specific price relationships. It verifies that the ratio of the highest price to the closing price is less than 1.03, the ratio of the opening price to the lowest price is less than 1.03, and the ratio of the highest price to the previous day's closing price is greater than 1.06. This condition looks for a specific pattern indicating potential bullish momentum.
A2 Condition: The A2 condition checks for price relationships related to the closing price. It verifies that the ratio of the closing price to the opening price is greater than 1.05 or that the ratio of the closing price to the previous day's closing price is greater than 1.05. This condition looks for signs of upward price movement and momentum.
A3 Condition: The A3 condition focuses on volume. It checks if the current volume crosses above the highest volume over the last 60 periods. This condition aims to identify increased buying interest and potentially confirms the strength of the potential upward price movement.
XG Condition: The XG condition combines the A1 and A2 conditions and checks if they are true for both the current and previous bars. It also verifies that the ratio of the closing price to the 5-period EMA crosses above the 9-period SMA of the same ratio. This condition helps identify potential buy signals when multiple factors align, indicating a strong bullish momentum and potential entry point.
Weekly Trend Factor: The weekly slope condition calculates the slope of the 50-period SMA over a weekly timeframe. It checks if the slope is positive, indicating an overall upward trend on a weekly basis. This condition provides additional confirmation that the stock is in an upward trend.
When all of these conditions align, the buy condition is triggered, indicating a favourable time to enter a long position.
Sell Condition:
The sell condition is relatively straightforward in the strategy:
Sell Signal: The sell condition simply checks if the closing price crosses below the 10-period EMA. When this condition is met, it indicates a potential reversal or weakening of the upward price momentum, and a sell signal is generated.
Backtest Outcome:
The strategy was backtested over the period from January 22nd, 1999 to May 3rd, 2023, using daily candlestick charts for the NASDAQ: NVDA. The strategy used an initial capital of 1,000,000 USD, The order quantity is defined as 10% of the equity. The strategy allows for pyramiding with 1 order, and the transaction fee is set at 0.03% per trade. Here are the key outcomes of the backtest:
Net Profit: 539,595.84 USD, representing a return of 53.96%.
Percent Profitable: 48.82%
Total Closed Trades: 127
Profit Factor: 2.331
Max Drawdown: 68,422.70 USD
Average Trade: 4,248.79 USD
Average Number of Bars in Trades: 11, indicating the average duration of the trades.
Conclusion:
In conclusion, the Swing Momentum Strategy is a quantitative trading approach that combines swing trading principles with momentum indicators to identify and capture mid term trading opportunities. The strategy has demonstrated promising results during backtesting, including a significant net profit and a favourable profit factor.

Optimized Zhaocaijinbao strategyIntroduction:
The Optimized Zhaocaijinbao strategy is a mid and long-term quantitative trading strategy that combines momentum and trend factors. It generates buy and sell signals by using a combination of exponential moving averages, moving averages, volume and slope indicators. It generates buy signals when the stock is above the 35-day moving average, the trading volume is higher than the 20-day moving average, and the stock is in an upward trend on a weekly timeframe."招财进宝" is a Chinese phrase that can be translated to "Attract Wealth and Bring in Treasure" in English. It is a common expression used to wish for good luck and prosperity in various contexts, such as in business or personal finances.
Highlights:
The strategy has several special optimizations that make it unique.
Firstly, the strategy is optimized for T+1 trading in the Chinese stock market and is only suitable for long positions. The optimizations are also applicable to international stock markets.
Secondly, the trend strategy is optimized to only show indicators on the right side and oscillations. This helps to prevent false signals in choppy markets.
Thirdly, the strategy uses a risk factor for dynamic position sizing to ensure position sizes are adjusted according to the current net asset value and risk preferences. This helps to lower drawdown risks.
The strategy has good resilience even without using stop loss modules in backtesting, making it suitable for trading hourly, 2-hourly, and daily K-line charts (depending on the stock being traded). We recommend experimenting with backtesting using SSE 1-hour or 2-hour or daily Kline charts.
Backtesting outcomes:
The strategy was backtested over the period from October 13th, 2005 to April 14th, 2023, using daily candlestick charts for the commodity code SSE:600763, with a currency of CNY and tick size of 0.01. The strategy used an initial capital of 1,000,000 CNY, with order sizes set to 10% equity and a pyramid of 1 order. The strategy also had a Max Position Size of 0.01 and a Risk Factor of 2.
Here is a summary of the performance of the trading strategy:
Total net profit: 288,577.32 CNY, representing a return of 128.86%
Total number of closed trades: 61
Winning trades: 37, representing a win rate of 60.66%
Profit factor: 2.415
Largest losing trade: 222,021.46 CNY, representing a loss of 14.08%
Average trade: 21,124.22 CNY, representing a return of 3.1%
Average holding period for all trades: 12 days
Conclusion:
In conclusion, the Optimized Zhaocaijinbao strategy is a mid and long-term quantitative trading strategy that combines momentum and trend factors. It is suitable for both Chinese stocks and global stocks. While the Optimized Zhaocaijinbao strategy has performed well in backtesting, it is important to note that past performance is not a guarantee of future results. Traders should conduct their own research and analysis and exercise caution when using any trading strategy.

Ichimoku Cloud with MACD and Trailing Stop Loss (by Coinrule)The Ichimoku Cloud is a collection of technical indicators that show support and resistance levels, as well as momentum and trend direction. It does this by taking multiple averages and plotting them on a chart. It also uses these figures to compute a “cloud” that attempts to forecast where the price may find support or resistance in the future.
The Ichimoku Cloud was developed by Goichi Hosoda, a Japanese journalist, and published in the late 1960s. It provides more data points than the standard candlestick chart. While it seems complicated at first glance, those familiar with how to read the charts often find it easy to understand with well-defined trading signals.
The Ichimoku Cloud is composed of five lines or calculations, two of which comprise a cloud where the difference between the two lines is shaded in.
The lines include a nine-period average, a 26-period average, an average of those two averages, a 52-period average, and a lagging closing price line.
The cloud is a key part of the indicator. When the price is below the cloud, the trend is down. When the price is above the cloud, the trend is up.
The above trend signals are strengthened if the cloud is moving in the same direction as the price. For example, during an uptrend, the top of the cloud is moving up, or during a downtrend, the bottom of the cloud is moving down.
The MACD is a trend following momentum indicator and provides identification of short-term trend direction. In this variation it utilises the 12-period as the fast and 26-period as the slow length EMAs, with signal smoothing set at 9.
This strategy combines the Ichimoku Cloud with the MACD indicator to better enter trades.
Long/Exit orders are placed when three basic signals are triggered.
Long Position:
Tenkan-Sen is above the Kijun-Sen
Chikou-Span is above the close of 26 bars ago
Close is above the Kumo Cloud
MACD line crosses over the signal line
Exit Position:
Price increases 3% trailing
Price decreases 3% trailing
The script is backtested from 1 June 2022 and provides good returns.
The strategy assumes each order is using 30% of the available coins to make the results more realistic and to simulate you only ran this strategy on 30% of your holdings. A trading fee of 0.1% is also taken into account and is aligned to the base fee applied on Binance.

Double Inside Bar & Trend Strategy - KaspricciDouble Inside Bar & Trend Strategy - Kaspricci
This strategy combines the Double Inside Bar candlestick pattern with a trend filter. Once the second inside bar closes and price is above trend moving average, a buy stop order is placed at high of the candle. If price is below trend moving average, a sell stop order is placed at the low of the candle.
This strategy is for educational purposes only! It is not meant to be a financial advice.
Settings
Trend source, type of moving average and length for calculating trend
Stop Loss Type - default: ATR. You can switch between stop loss calculation based on Average True Range value or fixed value.
ATR Length / Factor / TP Ratio - default: 14 / 2.0 / 2.0. Used to calculate the Stop Loss as ATR * Factor and Take Profit as Stop Loss * TP Ratio.
FIX Stop Loss / Take Profit - default: 10 pips / 20 pips. In case you select Stop Loss Type = FIX, these value swill be used.
Risk in % - default: 1%, option to adjust the quantity of a trade based on a defined risk percentage. If enabled, it will overwrite the quantity parameter of the strategy settings.
On top you can filter trades by start and end date as well as time of the day.