Bull Momentum GaugeBull Momentum Gauge
The Bull Momentum Gauge is a powerful momentum oscillator designed to identify the underlying strength and sustainability of major market trends. Instead of trying to predict tops and bottoms, this indicator helps traders and investors ride long-term bull markets by signaling when momentum is building and when it is starting to fade.
What it Does
At its core, this tool measures how statistically "stretched" or "compressed" an asset's price is relative to its long-term (1-year) trend. It does this by:
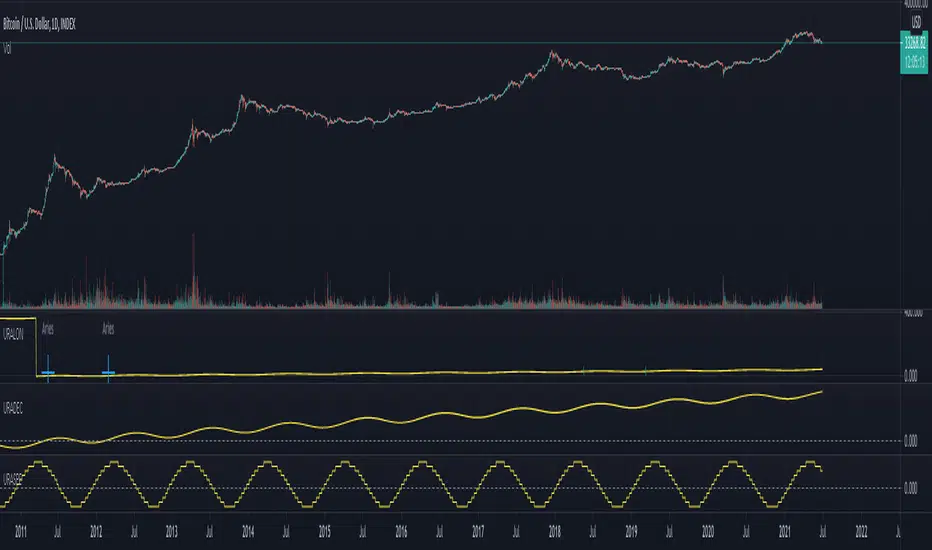
Calculating the price's deviation from its 365-day moving average.
Normalizing this deviation into a Z-score to measure its statistical significance.
Comparing the inverted Z-score to its own 200-day moving average to gauge the momentum of the trend itself.
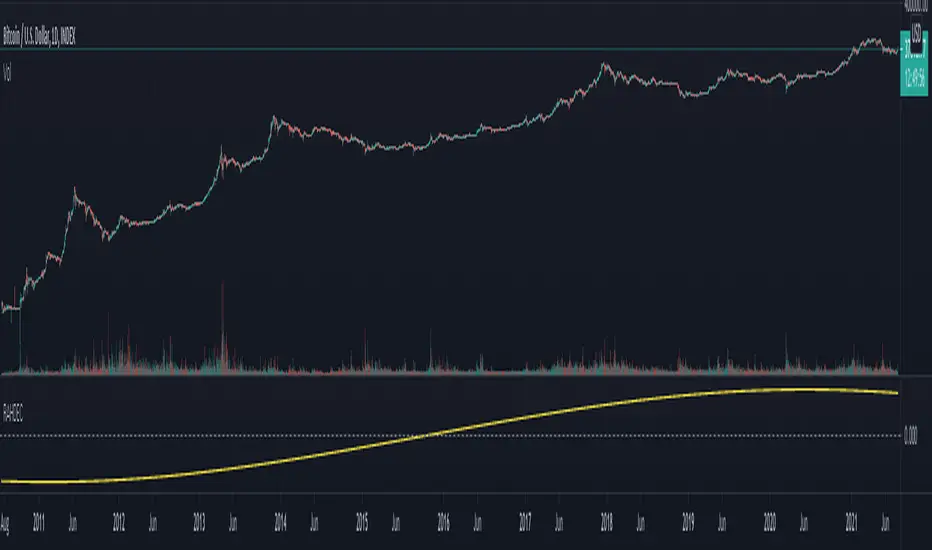
The result is a single, smooth line that oscillates around a zero value.
How to Use It
The signals are simple and based on the indicator's relationship to the zero line:
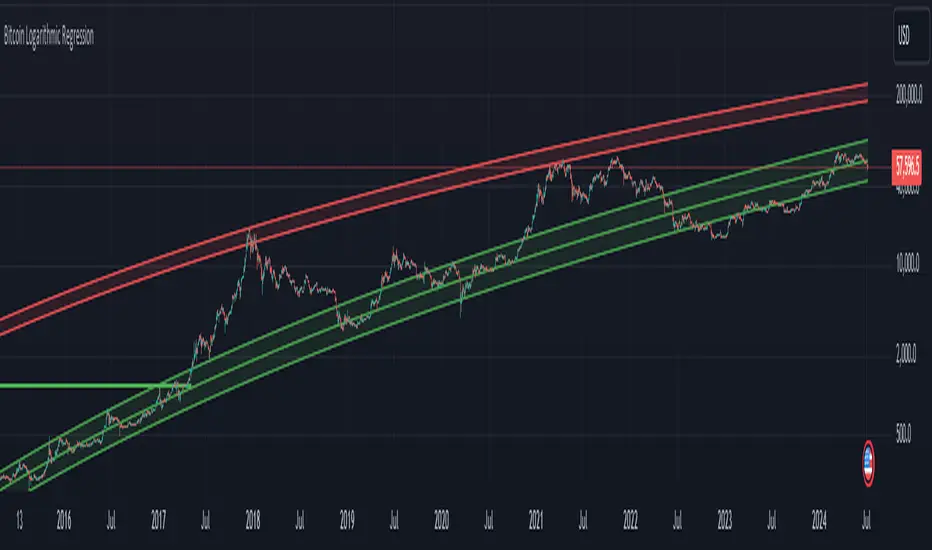
Green Line (Gauge below 0): This indicates that the price has been compressed relative to its long-term trend and is now showing signs of building upward momentum. A cross into the green zone can be interpreted as a potential entry signal for a new bull run.
Red Line (Gauge above 0): This suggests that the price has become over-extended or "stretched" and the upward momentum is beginning to weaken. A cross into the red zone can be used as a potential exit signal, indicating it may be time to take profits and wait for the next cycle.
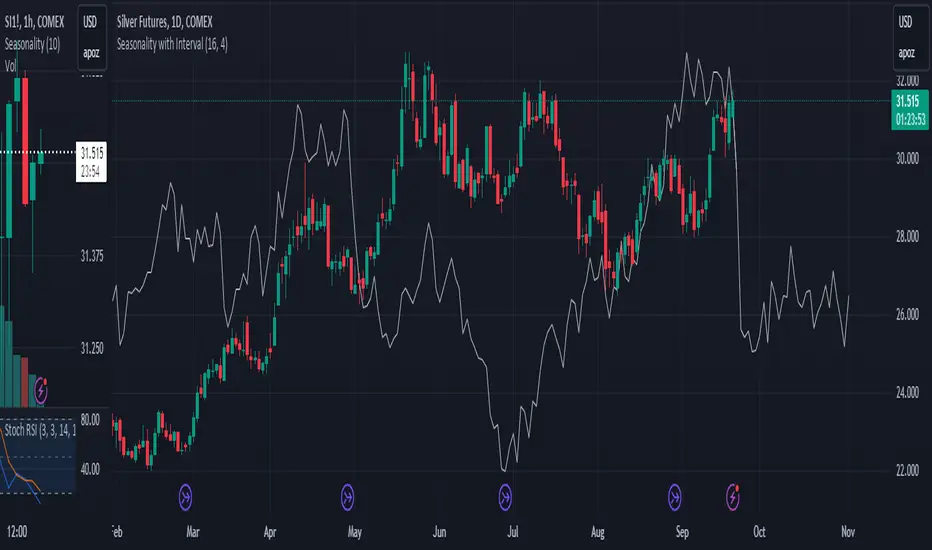
This indicator is designed to work across multiple timeframes (Daily, Weekly, Monthly) and provides a clear, data-driven framework for navigating major market cycles.
Chỉ báo Pine Script®