Impulse Reactor RSI-SMA Trend Indicator [ApexLegion]Impulse Reactor RSI-SMA Trend Indicator
Introduction and Theoretical Background
Design Rationale
Standard indicators frequently generate binary 'BUY' or 'SELL' signals without accounting for the broader market context. This often results in erratic "Flip-Flop" behavior, where signals are triggered indiscriminately regardless of the prevailing volatility regime.
Impulse Reactor was engineered to address this limitation by unifying two critical requirements: Quantitative Rigor and Execution Flexibility.
The Solution
Composite Analytical Framework This script is not a simple visual overlay of existing indicators. It is an algorithmic synthesis designed to function as a unified decision-making engine. The primary objective was to implement rigorous quantitative analysis (Volatility Normalization, Structural Filtering) directly within an alert-enabled framework. This architecture is designed to process signals through strict, multi-factor validation protocols before generating real-time notifications, allowing users to focus on structurally validated setups without manual monitoring.
How It Works
This is not a simple visual mashup. It utilizes a cross-validation algorithm where the Trend Structure acts as a gatekeeper for Momentum signals:
Logic over Lag: Unlike simple moving average crossovers, this script uses a 15-layer Gradient Ribbon to detect "Laminar Flow." If the ribbon is knotted (Compression), the system mathematically suppresses all signals.
Volatility Normalization: The core calculation adapts to ATR (Average True Range). This means the indicator automatically expands in volatile markets and contracts in quiet ones, maintaining accuracy without constant manual tweaking.
Adaptive Signal Thresholding: It incorporates an 'Anti-Greed' algorithm (Dynamic Thresholding) that automatically adjusts entry criteria based on trend duration. This logic aims to mitigate the risk of entering positions during periods of statistical trend exhaustion.
Why Use It?
Market State Decoding: The gradient Ribbon visualizes the underlying trend phase in real-time.
◦ Cyan/Blue Flow: Strong Bullish Trend (Laminar Flow).
◦ Magenta/Pink Flow: Strong Bearish Trend.
◦ Compressed/Knotted: When the ribbon lines are tightly squeezed or overlapping, it signals Consolidation. The system filters signals here to avoid chop.
Noise Reduction: The goal is not to catch every pivot, but to isolate high-confidence setups. The logic explicitly filters out minor fluctuations to help maintain position alignment with the broader trend.
⚖️ Chapter 1: System Architecture
Introduction: Composite Analytical Framework
System Overview
Impulse Reactor serves as a comprehensive technical analysis engine designed to synthesize three distinct market dimensions—Momentum, Volatility, and Trend Structure—into a unified decision-making framework. Unlike traditional methods that analyze these metrics in isolation, this system functions as a central processing unit that integrates disparate data streams to construct a coherent model of market behavior.
Operational Objective
The primary objective is to transition from single-dimensional signal generation to a multi-factor assessment model. By fusing data from the Impulse Core (Volatility), Gradient Oscillator (Momentum), and Structural Baseline (Trend), the system aims to filter out stochastic noise and identify high-probability trade setups grounded in quantitative confluence.
Market Microstructure Analysis: Limitations of Conventional Models
Extensive backtesting and quantitative analysis have identified three critical inefficiencies in standard oscillator-based strategies:
• Bounded Oscillator Limitations (The "Oscillation Trap"): Traditional indicators such as RSI or Stochastics are mathematically constrained between fixed values (0 to 100). In strong trending environments, these metrics often saturate in "overbought" or "oversold" zones. Consequently, traders relying on static thresholds frequently exit structurally valid positions prematurely or initiate counter-trend trades against prevailing momentum, resulting in suboptimal performance.
• Quantitative Blindness to Quality: Standard moving averages and trend indicators often fail to distinguish the qualitative nature of price movement. They treat low-volume drift and high-velocity expansion identically. This inability to account for "Volatility Quality" leads to delayed responsiveness during critical market events.
• Fractal Dissonance (Timeframe Disconnect): Financial markets exhibit fractal characteristics where trends on lower timeframes may contradict higher timeframe structures. Manual integration of multi-timeframe analysis increases cognitive load and susceptibility to human error, often resulting in conflicting biases at the point of execution.
Core Design Principles
To mitigate the aforementioned systemic inefficiencies, Impulse Reactor employs a modular architecture governed by three foundational principles:
Principle A:
Volatility Precursor Analysis Market mechanics demonstrate that volatility expansion often functions as a leading indicator for directional price movement. The system is engineered to detect "Volatility Deviation" — specifically, the divergence between short-term and long-term volatility baselines—prior to its manifestation in price action. This allows for entry timing aligned with the expansion phase of market volatility.
Principle B:
Momentum Density Visualization The system replaces singular momentum lines with a "Momentum Density" model utilizing a 15-layer Simple Moving Average (SMA) Ribbon.
• Concept: This visualization represents the aggregate strength and consistency of the trend.
• Application: A fully aligned and expanded ribbon indicates a robust trend structure ("Laminar Flow") capable of withstanding minor counter-trend noise, whereas a compressed ribbon signals consolidation or structural weakness.
Principle C:
Adaptive Confluence Protocols Signal validity is strictly governed by a multi-dimensional confluence logic. The system suppresses signal generation unless there is synchronized confirmation across all three analytical vectors:
1. Volatility: Confirmed expansion via the Impulse Core.
2. Momentum: Directional alignment via the Hybrid Oscillator.
3. Structure: Trend validation via the Baseline. This strict filtering mechanism significantly reduces false positives in non-trending (choppy) environments while maintaining sensitivity to genuine breakouts.
🔍 Chapter 2: Core Modules & Algorithmic Logic
Module A: Impulse Core (Normalized Volatility Deviation)
Operational Logic The Impulse Core functions as a volatility-normalized momentum gauge rather than a standard oscillator. It is designed to identify "Volatility Contraction" (Squeeze) and "Volatility Expansion" phases by quantifying the divergence between short-term and long-term volatility states.
Volatility Z-Score Normalization
The formula implements a custom normalization algorithm. Unlike standard oscillators that rely on absolute price changes, this logic calculates the Z-Score of the Volatility Spread.
◦ Numerator: (atr_f - atr_s) captures the raw momentum of volatility expansion.
◦ Denominator: (std_f + 1e-6) standardizes this value against historical variance.
◦ Result: This allows the indicator scales consistently across assets (e.g., Bitcoin vs. Euro) without manual recalibration.
f_impulse() =>
atr_f = ta.atr(fastLen) // Fast Volatility Baseline
atr_s = ta.atr(slowLen) // Slow Volatility Baseline
std_f = ta.stdev(atr_f, devLen) // Volatility Standard Deviation
(atr_f - atr_s) / (std_f + 1e-6) // Normalized Differential Calculation
Algorithmic Framework
• Differential Calculation: The system computes the spread between a Fast Volatility Baseline (ATR-10) and a Slow Volatility Baseline (ATR-30).
• Normalization Protocol: To standardize consistency across diverse asset classes (e.g., Forex vs. Crypto), the raw differential is divided by the standard deviation of the volatility itself over a 30-period lookback.
• Signal Generation:
◦ Contraction (Squeeze): When the Fast ATR compresses below the Slow ATR, it registers a potential volatility buildup phase.
◦ Expansion (Release): A rapid divergence of the Fast ATR above the Slow ATR signals a confirmed volatility expansion, validating the strength of the move.
Module B: Gradient Oscillator (RSI-SMA Hybrid)
Design Rationale To mitigate the "noise" and "false reversal" signals common in single-line oscillators (like standard RSI), this module utilizes a 15-Layer Gradient Ribbon to visualize momentum density and persistence.
Technical Architecture
• Ribbon Array: The system generates 15 sequential Simple Moving Averages (SMA) applied to a volatility-adjusted RSI source. The length of each layer increases incrementally.
• State Analysis:
Momentum Alignment (Laminar Flow): When all 15 layers are expanded and parallel, it indicates a robust trend where buying/selling pressure is distributed evenly across multiple timeframes. This state helps filter out premature "overbought/oversold" signals.
• Consolidation (Compression): When the distance between the fastest layer (Layer 1) and the slowest layer (Layer 15) approaches zero or the layers intersect, the system identifies a "Non-Tradable Zone," preventing entries during choppy market conditions.
// Laminar Flow Validation
f_validate_trend() =>
// Calculate spread between Ribbon layers
ribbon_spread = ta.stdev(ribbon_array, 15)
// Only allow signals if Ribbon is expanded (Laminar Flow)
is_flowing = ribbon_spread > min_expansion_threshold
// If compressed (Knotted), force signal to false
is_flowing ? signal : na
Module C: Adaptive Signal Filtering (Behavioral Bias Mitigation)
This subsystem, operating as an algorithmic "Anti-Greed" Mechanism, addresses the statistical tendency for signal degradation following prolonged trends.
Dynamic Threshold Adjustment
• Win Streak Detection: The algorithm internally tracks the outcome of closed trade cycles.
• Sensitivity Multiplier: Upon detecting consecutive successful signals in the same direction, a Penalty_Factor is applied to the entry logic.
• Operational Impact: This effectively raises the Required_Slope threshold for subsequent signals. For example, after three consecutive bullish signals, the system requires a 30% steeper trend angle to validate a fourth entry. This enforces stricter discipline during extended trends to reduce the probability of entering at the point of trend exhaustion.
Anti-Greed Logic: Dynamic Threshold Calculation
f_adjust_threshold(base_slope, win_streak) =>
// Adds a 10% penalty to the difficulty for every consecutive win
penalty_factor = 0.10
risk_scaler = 1 + (win_streak * penalty_factor)
// Returns the new, harder-to-reach threshold
base_slope * risk_scaler
Module D: Trend Baseline (Triple-Smoothed Structure)
The Trend Baseline serves as the structural filter for all signals. It employs a Triple-Smoothed Hybrid Algorithm designed to balance lag reduction with noise filtration.
Smoothing Stages
1. Volatility Banding: Utilizes a SuperTrend-based calculation to establish the upper and lower boundaries of price action.
2. Weighted Filter: Applies a Weighted Moving Average (WMA) to prioritize recent price data.
3. Exponential Smoothing: A final Exponential Moving Average (EMA) pass is applied to create a seamless baseline curve.
Functionality
This "Heavy" baseline resists minor intraday volatility spikes while remaining responsive to sustained structural shifts. A signal is only considered valid if the price action maintains structural integrity relative to this baseline
🚦 Chapter 3: Risk Management & Exit Protocols
Quantitative Risk Management (TP/SL & Trailing)
Foundational Architecture: Volatility-Adjusted Geometry Unlike strategies relying on static nominal values, Impulse Reactor establishes dynamic risk boundaries derived from quantitative volatility metrics. This design aligns trade invalidation levels mathematically with the current market regime.
• ATR-Based Dynamic Bracketing:
The protocol calculates Stop-Loss and Take-Profit levels by applying Fibonacci coefficients (Default: 0.786 for SL / 1.618 for TP) to the Average True Range (ATR).
◦ High Volatility Environments: The risk bands automatically expand to accommodate wider variance, preventing premature exits caused by standard market noise.
◦ Low Volatility Environments: The bands contract to tighten risk parameters, thereby dynamically adjusting the Risk-to-Reward (R:R) geometry.
• Close-Validation Protocol ("Soft Stop"):
Institutional algorithms frequently execute liquidity sweeps—driving prices briefly below key support levels to accumulate inventory.
◦ Mechanism: When the "Soft Stop" feature is enabled, the system filters out intraday volatility spikes. The stop-loss is conditional; execution is triggered only if the candle closes beyond the invalidation threshold.
◦ Strategic Advantage: This logic distinguishes between momentary price wicks and genuine structural breakdowns, preserving positions during transient volatility.
• Step-Function Trailing Mechanism:
To protect unrealized PnL while allowing for normal price breathing, a two-phase trailing methodology is employed:
◦ Phase 1 (Activation): The trailing function remains dormant until the price advances by a pre-defined percentage threshold.
◦ Phase 2 (Dynamic Floor): Once armed, the stop level creates a moving floor, adjusting relative to price action while maintaining a volatility-based (ATR) buffer to systematically protect unrealized PnL.
• Algorithmic Exit Protocols (Dynamic Liquidity Analysis)
◦ Rationale: Inefficiencies of Static Targets Static "Take Profit" levels often result in suboptimal exits. They compel traders to close positions based on arbitrary figures rather than evolving market structure, potentially capping upside during significant trends or retaining positions while the underlying trend structure deteriorates.
◦ Solution: Structural Integrity Assessment The system utilizes a Dynamic Liquidity Engine to continuously audit the validity of the position. Instead of targeting a specific price point, the algorithm evaluates whether the trend remains statistically robust.
Multi-Factor Exit Logic (The Tri-Vector System)
The Smart Exit protocol executes only when specific algorithmic invalidation criteria are met:
• 1. Momentum Exhaustion (Confluence Decay): The system monitors a 168-hour rolling average of the Confluence Score. A significant deviation below this historical baseline indicates momentum exhaustion, signaling that the driving force behind the trend has dissipated prior to a price reversal. This enables preemptive exits before a potential drawdown.
• 2. Statistical Over-Extension (Mean Reversion): Utilizing the core volatility logic, the system identifies instances where price deviates beyond 2.0 standard deviations from the mean. While the trend may be technically bullish, this statistical anomaly suggests a high probability of mean reversion (elastic snap-back), triggering a defensive exit to capitalize on peak valuation.
• 3. Oscillator Rejection (Immediate Pivot): To manage sudden V-shaped volatility, the system monitors RSI pivots. If a sharp "Pivot High" or divergence is detected, the protocol triggers an immediate "Peak Exit," bypassing standard trend filters to secure liquidity during high-velocity reversals.
🎨 Chapter 4: Visualization Guide
Gradient Oscillator Ribbon
The 15-layer SMA ribbon visualized via plot(r1...r15) represents the "Momentum Density" of the market.
• Visuals:
◦ Cyan/Blue Ribbon: Indicates Bullish Momentum.
◦ Pink/Magenta Ribbon: Indicates Bearish Momentum.
• Interpretation:
◦ Laminar Flow: When the ribbon expands widely and flows in parallel, it signifies a robust trend where momentum is distributed evenly across timeframes. This is the ideal state for trend-following.
◦ Compression (Consolidation): If the ribbon becomes narrow, twisted, or knotted, it indicates a "Non-Tradable Zone" where the market lacks a unified direction. Traders are advised to wait for clarity.
◦ Over-Extension: If the top layer crosses the Overbought (85) or Oversold (15) lines, it visually warns of potential market overheating.
Trend Baseline
The thick, color-changing line plotted via plot(baseline) represents the Structural Backbone of the market.
• Visuals: Changes color based on the trend direction (Blue for Bullish, Pink for Bearish).
• Interpretation:
Structural Filter: Long positions are statistically favored only when price action sustains above this baseline, while short positions are favored below it.
Dynamic Support/Resistance: The baseline acts as a dynamic support level during uptrends and resistance during downtrends.
Entry Signals & Labels
Text labels ("Long Entry", "Short Entry") appear when the system detects high-probability setups grounded in quantitative confluence.
• Visuals: Labeled signals appear above/below specific candles.
• Interpretation:
These signals represent moments where Volatility (Expansion), Momentum (Alignment), and Structure (Trend) are synchronized.
Smart Exit: Labels such as "Smart Exit" or "Peak Exit" appear when the system detects momentum exhaustion or structural decay, prompting a defensive exit to preserve capital.
Dynamic TP/SL Boxes
The semi-transparent colored zones drawn via fill() represent the risk management geometry.
• Visuals: Colored boxes extending from the entry point to the Take Profit (TP) and Stop Loss (SL) levels.
• Function:
Volatility-Adjusted Geometry: Unlike static price targets, these boxes expand during high volatility (to prevent wicks from stopping you out) and contract during low volatility (to optimize Risk-to-Reward ratios).
SAR + MACD Glow
Small glowing shapes appearing above or below candles.
• Visuals: Triangle or circle glows near the price bars.
• Interpretation:
This visual indicates a secondary confirmation where Parabolic SAR and MACD align with the main trend direction. It serves as an additional confluence factor to increase confidence in the trade setup.
Support/Resistance Table
A small table located at the bottom-right of the chart.
• Function: Automatically identifies and displays recent Pivot Highs (Resistance) and Pivot Lows (Support).
• Interpretation: These levels can be used as potential targets for Take Profit or invalidation points for manual Stop Loss adjustments.
🖥️ Chapter 5: Dashboard & Operational Guide
Integrated Analytics Panel (Dashboard Overview)
To facilitate rapid decision-making without manual calculation, the system aggregates critical market dimensions into a unified "Heads-Up Display" (HUD). This panel monitors real-time metrics across multiple timeframes and analytical vectors.
A. Intermediate Structure (12H Trend)
• Function: Anchors the intraday analysis to the broader market structure using a 12-hour rolling window.
• Interpretation:
◦ Bullish (> +0.5%): Indicates a positive structural bias. Long setups align with the macro flow.
◦ Bearish (< -0.5%): Indicates structural weakness. Short setups are statistically favored.
◦ Neutral: Represents a ranging environment where the Confluence Score becomes the primary weighting factor.
B. Composite Confluence Score (Signal Confidence)
• Definition: A probability metric derived from the synchronization of Volatility (Impulse Core), Momentum (Ribbon), and Trend (Baseline).
• Grading Scale:
Strong Buy/Sell (> 7.0 / < 3.0): Indicates full alignment across all three vectors. Represents a "Prime Setup" eligible for standard position sizing.
Buy/Sell (5.0–7.0 / 3.0–5.0): Indicates a valid trend but with moderate volatility confirmation.
Neutral: Signals conflicting data (e.g., Bullish Momentum vs. Bearish Structure). Trading is not recommended ("No-Trade Zone").
C. Statistical Deviation Status (Mean Reversion)
• Logic: Utilizes Bollinger Band deviation principles to quantify how far price has stretched from the statistical mean (20 SMA).
• Alert States:
Over-Extended (> 2.0 SD): Warning that price is statistically likely to revert to the mean (Elastic Snap-back), even if the trend remains technically valid. New entries are discouraged in this zone.
Normal: Price is within standard distribution limits, suitable for trend-following entries.
D. Volatility Regime Classification
• Metric: Compares current ATR against a 100-period historical baseline to categorize the market state.
• Regimes:
Low Volatility (Lvl < 1.0): Market Compression. Often precedes volatility expansion events.
Mid Volatility (Lvl 1.0 - 1.5): Standard operating environment.
High Volatility (Lvl > 1.5): Elevated market stress. Risk parameters should be adjusted (e.g., reduced position size) to account for increased variance.
E. Performance Telemetry
• Function: Displays the historical reliability of the Trend Baseline for the current asset and timeframe.
• Operational Threshold: If the displayed Win Rate falls below 40%, it suggests the current market behavior is incoherent (choppy) and does not respect trend logic. In such cases, switching assets or timeframes is recommended.
Operational Protocols & Signal Decoding
Visual Interpretation Standards
• Laminar Flow (Trade Confirmation): A valid trend is visually confirmed when the 15-layer SMA Ribbon is fully expanded and parallel. This indicates distributed momentum across timeframes.
• Consolidation (No-Trade): If the ribbon appears twisted, knotted, or compressed, the market lacks a unified directional vector.
• Baseline Interaction: The Triple-Smoothed Baseline acts as a dynamic support/resistance filter. Long positions remain valid only while price sustains above this structure.
System Calibration (Settings)
• Adaptive Signal Filtering (Prev. Anti-Greed): Enabled by default. This logic automatically raises the required trend slope threshold following consecutive wins to mitigate behavioral bias.
• Impulse Sensitivity: Controls the reactivity of the Volatility Core. Higher settings capture faster moves but may introduce more noise.
⚙️ Chapter 6: System Configuration & Alert Guide
This section provides a complete breakdown of every adjustable setting within Impulse Reactor to assist you in tailoring the engine to your specific needs.
🌐 LANGUAGE SETTINGS (Localization)
◦ Select Language (Default: English):
Function: Instantly translates all chart labels, dashboard texts into your preferred language.
Supported: English, Korean, Chinese, Spanish
⚡ IMPULSE CORE SETTINGS (Volatility Engine)
◦ Deviation Lookback (Default: 30): The period used to calculate the standard deviation of volatility.
Role: Sets the baseline for normalizing momentum. Higher values make the core smoother but slower to react.
◦ Fast Pulse Length (Default: 10): The short-term ATR period.
Role: Detects rapid volatility expansion.
◦ Slow Pulse Length (Default: 30): The long-term ATR baseline.
Role: Establishes the background volatility level. The core signal is derived from the divergence between Fast and Slow pulses.
🎯 TP/SL SETTINGS (Risk Management)
◦ SL/TP Fibonacci (Default: 0.786 / 1.618): Selects the Fibonacci ratio used for risk calculation.
◦ SL/TP Multiplier (Default: 1.5 / 2): Applies a multiplier to the ATR-based bands.
Role: Expands or contracts the Take Profit and Stop Loss boxes. Increase these values for higher volatility assets (like Altcoins) to avoid premature stop-outs.
◦ ATR Length (Default: 14): The lookback period for calculating the Average True Range used in risk geometry.
◦ Use Soft Stop (Close Basis):
Role: If enabled, Stop Loss alerts only trigger if a candle closes beyond the invalidation level. This prevents being stopped out by wick manipulations.
🔊 RIBBON SETTINGS (Momentum Visualization)
◦ Show SMA Ribbon: Toggles the visibility of the 15-layer gradient ribbon.
◦ Ribbon Line Count (Default: 15): The number of SMA lines in the ribbon array.
◦ Ribbon Start Length (Default: 2) & Step (Default: 1): Defines the spread of the ribbon.
Role: Controls the "thickness" of the momentum density visualization. A wider step creates a broader ribbon, useful for higher timeframes.
📎 DISPLAY OPTIONS
◦ Show Entry Lines / TP/SL Box / Position Labels / S/R Levels / Dashboard: Toggles individual visual elements on the chart to reduce clutter.
◦ Show SAR+MACD Glow: Enables the secondary confirmation shapes (triangles/circles) above/below candles.
📈 TREND BASELINE (Structural Filter)
◦ Supertrend Factor (Default: 12) & ATR Period (Default: 90): Controls the sensitivity of the underlying Supertrend algorithm used for the baseline calculation.
◦ WMA Length (40) & EMA Length (14): The smoothing periods for the Triple-Smoothed Baseline.
◦ Min Trend Duration (Default: 10): The minimum number of bars the trend must be established before a signal is considered valid.
🧠 SMART EXIT (Dynamic Liquidity)
◦ Use Smart Exit: Enables the momentum exhaustion logic.
◦ Exit Threshold Score (Default: 3): The sensitivity level for triggering a Smart Exit. Lower values trigger earlier exits.
◦ Average Period (168) & Min Hold Bars (5): Defines the rolling window for momentum decay analysis and the minimum duration a trade must be held before Smart Exit logic activates.
🛡️ TRAILING STOP (Step)
◦ Use Trailing Stop: Activates the step-function trailing mechanism.
◦ Step 1 Activation % (0.5) & Offset % (0.5): The price must move 0.5% in your favor to arm the first trail level, which sets a stop 0.5% behind price.
◦ Step 2 Activation % (1) & Offset % (0.2): Once price moves 1%, the trail tightens to 0.2%, securing the position.
🌀 SAR & MACD SETTINGS (Secondary Confirmation)
◦ SAR Start/Increment/Max: Standard Parabolic SAR parameters.
◦ SAR Score Scaling (ATR): Adjusts how much weight the SAR signal has in the overall confluence score.
◦ MACD Fast/Slow/Signal: Standard MACD parameters used for the "Glow" signals.
🔄 ANTI-GREED LOGIC (Behavioral Bias)
◦ Strict Entry after Win: Enables the negative feedback loop.
◦ Strict Multiplier (Default: 1.1): Increases the entry difficulty by 10% after each win.
Role: Prevents overtrading and entering at the top of an extended trend.
🌍 HTF FILTER (Multi-Timeframe)
◦ Use Auto-Adaptive HTF Filter: Automatically selects a higher timeframe (e.g., 1H -> 4H) to filter signals.
◦ Bypass HTF on Steep Trigger: Allows an entry even against the HTF trend if the local momentum slope is exceptionally steep (catch powerful reversals).
📉 RSI PEAK & CHOPPINESS
◦ RSI Peak Exit (Instant): Triggers an immediate exit if a sharp RSI pivot (V-shape) is detected.
◦ Choppiness Filter: Suppresses signals if the Choppiness Index is above the threshold (Default: 60), indicating a flat market.
📐 SLOPE TRIGGER LOGIC
◦ Force Entry on Steep Slope: Overrides other filters if the price angle is extremely vertical (high velocity).
◦ Slope Sensitivity (1.5): The angle required to trigger this override.
⛔ FLAT MARKET FILTER (ADX & ATR)
◦ Use ADX Filter: Blocks signals if ADX is below the threshold (Default: 20), indicating no trend.
◦ Use ATR Flat Filter: Blocks signals if volatility drops below a critical level (dead market).
🔔 Alert Configuration Guide
Impulse Reactor is designed with a comprehensive suite of alert conditions, allowing you to automate your trading or receive real-time notifications for specific market events.
How to Set Up:
Click the "Alert" (Clock) icon in the TradingView toolbar.
Select "Impulse Reactor " from the Condition dropdown.
Choose one of the specific trigger conditions below:
🚀 Entry Signals (Trend Initiation)
Long Entry:
Trigger: Fires when a confirmed Bullish Setup is detected (Momentum + Volatility + Structure align).
Usage: Use this to enter new Long positions.
Short Entry:
Trigger: Fires when a confirmed Bearish Setup is detected.
Usage: Use this to enter new Short positions.
🎯 Profit Taking (Target Levels)
Long TP:
Trigger: Fires when price hits the calculated Take Profit level for a Long trade.
Usage: Automate partial or full profit taking.
Short TP:
Trigger: Fires when price hits the calculated Take Profit level for a Short trade.
Usage: Automate partial or full profit taking.
🛡️ Defensive Exits (Risk Management)
Smart Exit:
Trigger: Fires when the system detects momentum decay or statistical exhaustion (even if the trend hasn't fully reversed).
Usage: Recommended for tightening stops or closing positions early to preserve gains.
Overbought / Oversold:
Trigger: Fires when the ribbon extends into extreme zones.
Usage: Warning signal to prepare for a potential reversal or pullback.
💡 Secondary Confirmation (Confluence)
SAR+MACD Bullish:
Trigger: Fires when Parabolic SAR and MACD align bullishly with the main trend.
Usage: Ideal for Pyramiding (adding to an existing winning position).
SAR+MACD Bearish:
Trigger: Fires when Parabolic SAR and MACD align bearishly.
Usage: Ideal for adding to short positions.
⚠️ Chapter 7: Conclusion & Risk Disclosure
Methodological Synthesis
Impulse Reactor represents a shift from reactive price tracking to proactive energy analysis. By decomposing market activity into its atomic components — Volatility, Momentum, and Structure — and reconstructing them into a coherent decision model, the system aims to provide a quantitative framework for market engagement. It is designed not to predict the future, but to identify high-probability conditions where kinetic energy and trend structure align.
Disclaimer & Risk Warnings
◦ Educational Purpose Only
This indicator, including all associated code, documentation, and visual outputs, is provided strictly for educational and informational purposes. It does not constitute financial advice, investment recommendations, or a solicitation to buy or sell any financial instruments.
◦ No Guarantee of Performance
Past performance is not indicative of future results. All metrics displayed on the dashboard (including "Win Rate" and "P&L") are theoretical calculations based on historical data. These figures do not account for real-world trading factors such as slippage, liquidity gaps, spread costs, or broker commissions.
◦ High-Risk Warning
Trading cryptocurrencies, futures, and leveraged financial products involves a substantial risk of loss. The use of leverage can amplify both gains and losses. Users acknowledge that they are solely responsible for their trading decisions and should conduct independent due diligence before executing any trades.
◦ Software Limitations
The software is provided "as is" without warranty. Users should be aware that market data feeds on analysis platforms may experience latency or outages, which can affect signal generation accuracy.
Tìm kiếm tập lệnh với "Fractal"

FTPM - Institutional Trend Pressure Suite @darshaksscThis indicator provides an informational view of market trend pressure using fractal-based momentum events, smoothed pressure calculations, higher timeframe confirmation, and divergence analysis. It does not produce buy or sell signals. Instead, it presents market context to help traders interpret trend conditions in a structured and data-driven way.
The indicator includes the following components:
1). Non-repainting Trend Pressure Engine
The pressure line is derived from confirmed fractal events, body-to-range ratios, displacement strength, and a controlled decay factor. The value is normalized to a 0 to 100 scale. A rising pressure value suggests increasing trend strength, while a declining value indicates weakening strength. This is informational only.
2). Pressure Shifts
The tool highlights transitions where pressure crosses above or below key thresholds. These labels do not represent entries or exits, but simply indicate contextual changes in momentum.
3). Higher Timeframe Pressure Confirmation
Users can compare current timeframe pressure to a selected higher timeframe. When both pressures align in similar regions, it may indicate agreement in broader market structure. This feature is informational only and does not generate trading signals.
4). Divergence Detection
Identifies confirmed bullish or bearish divergences between price pivots and pressure pivots. Divergences are simply analytical tools and should not be interpreted as actionable trading signals.
5). Institutional Dashboard
A multi-line dashboard summarizes current pressure, regime classification, higher timeframe regime, pressure direction, divergence status, and alignment conditions. The dashboard is informational only. No part of the dashboard should be interpreted as a trade instruction.
6). Dashboard Size Selector
Users may switch between Full, Medium, or Thin dashboard layouts to match their screen preferences. This affects only display, not indicator logic.
Important Notes
This indicator does not forecast future price movement.
It does not generate buy, sell, long, or short signals.
It does not guarantee profitable outcomes.
It is intended purely for visual analysis and market context.
All information is derived from confirmed historical data.
No part of this script is designed to automate trading decisions.
This tool is suitable for traders who want a clear, non-repainting visualization of pressure conditions and structural behavior without violating TradingView House Rules.
======================================================================
HOW TO USE
The indicator helps traders observe whether pressure is increasing or decreasing, whether higher timeframe conditions agree with the current chart, and whether divergences are present. All outputs are informational and should be combined with the user's preferred strategy or manual analysis. The indicator is not intended to signal trades or provide recommendations.
======================================================================
DISCLAIMERS
This indicator is for educational and informational purposes only.
It does not constitute financial advice.
It does not provide buy, sell, long, or short signals.
It does not predict future price movement.
Past performance does not guarantee future results.
======================================================================

MACD Momentum Structure & Volume Profile Sniper [MTF]**Description and Methodology**
This script offers a unique approach to Market Structure by moving away from traditional fractal-based highs and lows (which can be noisy). Instead, it utilizes **MACD Momentum Swings** to identify significant structural points, combined with an automated Fixed Range Volume Profile to pinpoint high-probability entry zones.
**1. Why MACD Structure? (The Core Concept)**
Traditional "ZigZag" or Fractal indicators rely solely on price action, often leading to fake-outs during low-volume consolidation.
* This script defines a "Swing High" only when the MACD Histogram crosses below zero (Momentum shifts Bearish).
* This script defines a "Swing Low" only when MACD crosses above zero (Momentum shifts Bullish).
By linking structure to momentum, we filter out weak price movements and focus on the true "heartbeat" of the trend.
**2. The "Mashup" Synergy: Structure + Volume + Logic**
This is not a random combination of indicators. Each component serves a specific step in the trading execution sequence:
* **Step 1 (Structure):** The script identifies a Change of Character (CHoCH) based on the MACD peaks described above.
* **Step 2 (Liquidity/Value):** When a CHoCH occurs, the script *automatically* draws a **Fixed Range Volume Profile (FRVP)** specifically covering the impulse leg that caused the break. This reveals the "Point of Control" (POC)—the hidden price level where the most volume occurred during the move.
* **Step 3 (The Sniper Entry):** The script creates a "Zone" around that POC. It then waits for Price to retrace into this zone.
* **Step 4 (Confirmation):** Once the zone is touched, the script monitors a lower timeframe (User selectable, default M1) for a fresh MACD crossover to trigger the final entry signal.
**Features**
* **Multi-Timeframe Dashboard:** Monitor the MACD Trend direction across 4 different timeframes simultaneously.
* **Dynamic Trendlines:** Automatically connects confirmed MACD peaks to visualize trend integrity.
* **Fibo Time Zones:** Projects potential future pivot points based on the duration of the previous swing.
* **Alert System:** Integrated alerts for Zone Touches and "Sniper" entries (Zone Touch + LTF Momentum Confirmation).
**How to Use**
1. **Identify Trend:** Look for the CHoCH labels. Green indicates a shift to Bullish, Red to Bearish.
2. **Wait for Pullback:** Do not chase the break. Wait for price to return to the Yellow POC Zone generated by the Volume Profile.
3. **Entry Trigger:** Watch for the "BUY" or "SELL" marks. These appear only when price hits the zone AND the lower-timeframe momentum aligns with the trade direction.
**Settings & Inputs**
* **Global MACD:** Adjust the sensitivity of the swing detection (Default 12, 26, 9).
* **Sniper Entry:** Select the timeframe used for the final confirmation (e.g., use M1 confirmation for an H1 chart structure).
* **VP Settings:** Customize how the Volume Profile looks on the chart.
*Disclaimer: This script is intended for educational purposes and market analysis. It does not provide financial advice.*

Bappa - Dynamic VWAP Simple Vwap, just dynamic colour Coding added to sense whether VWAP is in uptrend or downtrend. Refer to colour code to enter Call side or Put side, it never disappoints you at any timeframe. Enjoy & happy Trading!!
Better results if used in conjuction with Pivots/ fractals indicator, named as Bappa EMA + BBW (V2) indicator.

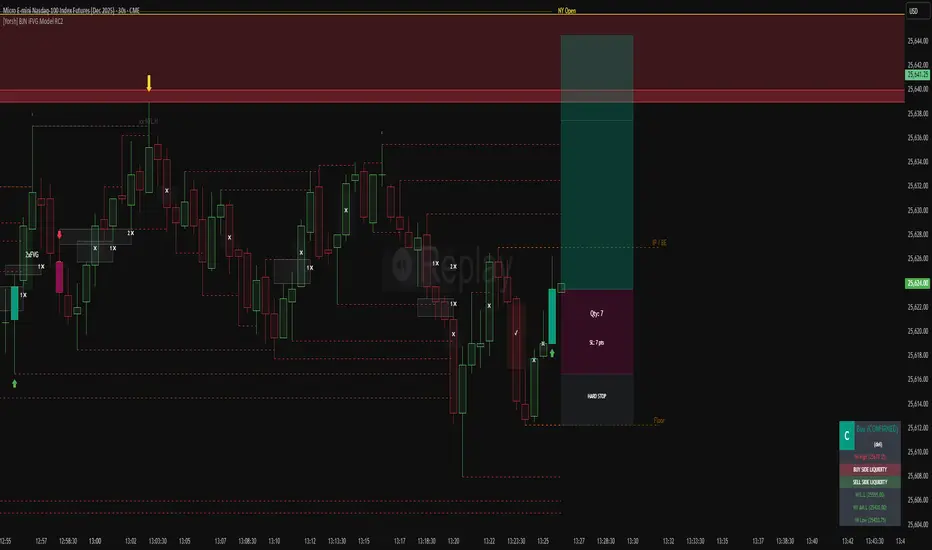
[Yorsh] BJN iFVG Model RC1 BJN iFVG Model - Mechanical Trading System
Description:
The BJN iFVG Model is not just an indicator; it is a full-scale, semi-automated trading architecture designed to mechanically execute the specific "BJN" Inverted FVG strategy.
Designed for precision traders operating on Lower Timeframes (1m to 5m), this script eliminates the cognitive load of manual analysis. It automates every single step of the mechanical model—from Higher Timeframe narrative building to tick-perfect structural validation and risk calculation.
This tool transforms your chart into a professional trading cockpit, split into three intelligent engines:
1. The Matrix (Context Engine)
Before looking for an entry, you must understand the narrative. The Matrix handles the heavy lifting of multi-timeframe analysis without cluttering your chart:
Real-Time Delivery State: Automatically detects if price is reacting from valid HTF PD Arrays (1H, 4H, Daily) to confirm a "Delivery" state.
Liquidity Sweeps: Tracks Fractals across three dimensions (1H, 15m, and Micro-Structure) to identify liquidity raids instantly.
Advanced SMT Divergence: A built-in, multi-mode SMT engine scans for correlation breaks (Pivot SMT, Adjacent Wick SMT, and FVG SMT) between NQ/ES (or custom tickers) in real-time.
Time & Macro Tracking: Automatically visualizes Killzones and highlights high-probability Macro windows.
2. The Executioner (Entry Engine)
Once the context is set, the Executioner handles the specific Inverted FVG (iFVG) entry model with strict mechanical rules:
Structural Integrity: Automatically identifies the Invalidation Point (IP), Floor/Ceiling, and Break-Even levels for every setup.
Hazard Detection: The script proactively scans the "Trading Leg" for opposing unmitigated FVGs (Hazards). If the path isn't clean, the trade is flagged or invalidated.
Composite Logic: Intelligently merges "noisy" price action into Composite FVGs to reduce false signals.
Integrated Position Sizer: When a trade is confirmed, a visual box appears showing your precise Entry, Stop Loss, Hard Stop, and Take Profit levels, along with a calculated Contract Quantity based on your risk tolerance.
3. The Ranking System (Quality Control)
Not all trades are created equal. This system grades every single confirmed setup in real-time based on confluence factors:
Grades: Ranges from A++ (Perfect Confluence) to C (Low Probability).
Confluence Check: Checks for Delivery, Sweeps (HTF/LTF), SMT, and Macro alignment at the exact moment of the trigger.
Live Status Panel: A dashboard on your chart displays the current live trade status (Armed, Triggered, Confirmed) and its Rank, so you never miss a beat.
Optimization & Performance
Trading on the 1-minute timeframe requires speed. This script has been rigorously optimized for high-frequency environments:
Smart Garbage Collection: The script manages its own memory, cleaning up old data arrays to prevent lag, ensuring the chart remains fluid even after days of data accumulation.
Tunnel Vision: Calculations are strictly focused on the relevant trading leg, ignoring historical noise to maximize execution speed.
Zero-Repaint: All historical analysis is strictly non-repainting to ensure backtesting reliability.
How to Use
Timeframes: Optimized for 1m, 2m, 3m, 4m, 5m execution.
Alerts: Configure the robust alert system to notify you only when setups meet your standards (e.g., "Alert only on Rank B+ or higher").
Strategy: Wait for the Status Panel to show a "CONFIRMED" signal. Use the on-screen Position Sizer to execute the trade with the displayed risk parameters.
Stop analyzing; start executing. Welcome to mechanical trading.
----------------------------------------------------------------------------------------------------------------
RISK DISCLAIMER:
The content, tools, and signals generated by this script are strictly for educational and informational purposes only. This script does not constitute financial advice, investment recommendations, or a solicitation to buy or sell any securities, futures, or other financial instruments.
Trading financial markets involves a high degree of risk and is not suitable for all investors. The "Position Sizer" and "Trade Setups" displayed are hypothetical simulations designed to demonstrate the mechanics of the BJN methodology; they do not guarantee future performance.
Use this tool at your own risk. The author assumes no responsibility or liability for any trading losses or damages incurred in connection with the use of this script. Always consult with a qualified financial advisor and practice proper risk management.
Exhaustion Zone [by rukich]🟠 OVERVIEW
The indicator shows asset exhaustion — an area of interest where potential buying opportunities can be considered.
🟠 COMPONENTS
The indicator is based on a combination of fundamental tools designed to properly react to price movement and volatility.
It is displayed on the chart as a green line. When the price touches the indicator line, the candle lights up and is highlighted in green.
🟠 HOW TO USE
The best timeframes for using the indicator: 1D and 3D.
Since the indicator is used on higher timeframes, the price rarely reaches the indicator line, but it often shows a strong reaction when it does, which suggests that the indicator can be used for investment purposes.
Since the zone suggests potential buying opportunities, it’s best to act from the zone only when a reaction is confirmed. Confirmation may include a candle close beyond nearby fractals or the invalidation of the nearest resistance zone.
🟠 CONCLUSION
The indicator highlights an area of interest where, upon confirmation of a reaction, buying opportunities may be considered.

Monitor Posición Bollinger Multi-TFThis indicator provides a comprehensive dashboard that allows you to monitor the price position relative to Bollinger Bands across 7 different timeframes simultaneously, without the need to switch charts.
It uses the %B (Percent B) logic to normalize the price position, giving you an instant "Heatmap" view of the market state (Overbought/Oversold) from the 1-minute chart up to the Weekly chart.
Key Features:
Multi-Timeframe Monitoring: Watch 1m, 5m, 15m, 1h, 4h, Daily, and Weekly timeframes in a single panel.
Dynamic Color Coding:
Dark Red: Price breaking above the Upper Band (>100%).
Light Red: Price near the Upper Band (Resistance zone).
Gray: Price in the neutral middle zone.
Light Green: Price near the Lower Band (Support zone).
Dark Green: Price breaking below the Lower Band (<0%).
Trend Arrows: Indicates momentum (▲ or ▼) based on the previous candle's position.
Current Timeframe Highlight: Automatically highlights the row corresponding to your current chart view in orange.
Fully Customizable: Adjust Bollinger settings (Length, Mult), choose your preferred timeframes, and change the table position/size.
Movable Panel: Includes X/Y offset settings to prevent the table from blocking price action or menu buttons.
How to Use:
Add the indicator to your chart.
Use the dashboard to spot confluence across timeframes.
Example: If 15m, 1H, and 4H are all showing Red, the asset is likely overextended to the upside.
Example: If the lower timeframes are turning Green while the higher timeframes remain Gray/Bullish, it might indicate a pullback opportunity.
Settings:
Bollinger Config: Length (20) and Multiplier (2.0) by default.
Timeframes: Select the 7 specific TFs you want to track.
Visuals: Change table position, text size, and offset coordinates.
This tool is essential for scalpers and day traders who need situational awareness across multiple fractals instantly.

SLAW TRADING SCALP-XSLAW TRADING SCALP-X – Multi-Filter Scalping Suite
SLAW TRADING SCALP-X is an intraday scalping tool designed for fast markets (crypto, FX, indices) on lower timeframes such as 1m–5m charts. It combines multiple classic concepts into a single, rule-based framework and only prints signals when several conditions agree.
The script uses:
Heikin Ashi structure to smooth noise and detect bullish/bearish candle bias.
Dual EMAs (fast & slow) to define the main trend and to filter trades in the direction of that trend.
Stochastic and MACD as momentum filters. Both can vote for long/short, contributing to a combined momentum score.
Swing / pivot detection (local highs/lows and fractals) to locate potential exhaustion zones and entries near short-term reversals.
ATR-based volatility filter that ignores “dead” low-volatility periods and overly explosive candles, adapting automatically across different markets.
Candle-quality filter that checks body/wick ratios to avoid extreme wick manipulation and very small bodies.
A momentum score is built from Stochastic, MACD and swing conditions. Long or short signals are only allowed when the score reaches a configurable minimum, the trend filter agrees, price is close to the fast EMA, volatility is inside a healthy range, and the candle passes the body/wick quality checks.
The script also contains signal-management logic:
Maximum number of consecutive signals in the same direction (to avoid endless buying or selling in trends).
Minimum bar distance between two signals (to reduce over-trading and clustering).
When all filters line up, the indicator plots “L” and “S” labels on the chart and exposes corresponding alertconditions (“LONG” and “SHORT”) so traders can connect it to webhooks or bots.
This script is intended as a tool for discretionary traders, not an automatic profit guarantee. It works best when combined with your own risk management, session filters and higher-timeframe analysis. Nothing in this indicator is financial advice; always test on a demo account and adapt the parameters to your market and timeframe.

Enhanced ML-FRAMA with HTFCore Concept
FRAMA (Fractal Adaptive Moving Average) is an adaptive moving average that automatically adjusts its sensitivity based on market volatility using fractal geometry. This indicator enhances it with Machine Learning predictions and multi-timeframe analysis.
Key Components:
1. ML-Enhanced FRAMA
ML Enhancement: Uses machine learning to adjust FRAMA's sensitivity
Dynamic Adaptation: ML predictions modify the smoothing constant based on market conditions
2. Machine Learning System
Three ML Models Combined:
K-Nearest Neighbors (KNN): Finds similar historical patterns
Trend Model: Uses EMA crossovers for trend detection
Momentum Model: Combines RSI, ROC, and volume for momentum
Features Used:
RSI, MACD, ATR, Rate of Change
Volume ratio and momentum
VWAP deviation
Higher timeframe RSI
Daily EMA trend
3. Higher Timeframe Integration
HTF1: 1-hour timeframe
HTF2: 4-hour timeframe
Confluence Trading: Requires agreement across multiple timeframes
4. Visual Features
Support/Resistance Circles: Dynamic levels based on ATR volatility
Color Coding:
Green: Bullish signals
Red: Bearish signals
Purple/Orange: HTF indicators
Trend Detection: Colors change based on direction
Requirements for Bullish Signal:
Price crosses above ML-FRAMA
ML prediction > 60% bullish
High confidence (>30%)
Volume 20% above average
Both HTF timeframes bullish
Performance Tracking:
Adaptive Weights: Automatically adjusts model weights based on recent accuracy
Dynamic K: Adjusts KNN neighbors based on market volatility
Outlier Detection: Filters unusual bars from training data
Trading Philosophy:
Multi-Timeframe Confirmation
Avoids false signals by requiring HTF agreement
Reduces noise by focusing on higher probability setups
Volume Confirmation
Requires above-average volume for valid signals
Volume momentum adds conviction
Machine Learning Edge
Learns from historical patterns
Adapts to changing market conditions
Combines multiple analysis techniques
Use Cases:
Trend Following: ML-FRAMA as dynamic support/resistance
Breakout Trading: Price crosses with volume and HTF confirmation
Mean Reversion: Support/resistance circles as reversal zones
Swing Trading: HTF confluence for higher probability setups
Strengths:
Adaptive: Adjusts to market volatility
Multi-timeframe: Reduces false signals
Volume-confirmed: Adds conviction
ML-enhanced: Learns from market behavior
Visual: Clear support/resistance levels
Ideal For:
Swing traders looking for high-probability entries
Trend followers wanting adaptive moving averages
Technical analysts who value multi-timeframe confirmation
Traders who want machine learning without complexity
The indicator essentially creates a "smart" adaptive moving average that learns from the market and only provides signals when multiple timeframes and technical factors align.

BaH4iK_StaategyThis indicator is a flexible strategy builder for TradingView, allowing traders to combine and customize popular entry/exit signals, filters, and overlays into a single tool. The indicator supports a wide range of technical methods and provides modular configuration for advanced strategy design.
How it works:
The user can select from dozens of entry types (trend, breakout, oscillator signals), confirmation filters (EMA, SMA, MA crosses, volatility, custom range filters), overlays, dashboards, and risk settings.
Key logic includes conditional sampling for EMAs and SMAs, multiple range and trend-detection systems (Range Filter, Supertrend, Half Trend, Rational Quadratic Kernel), and integration of classic confirmation indicators (TSI, VWAP, RSI, MACD, CCI, Ichimoku, Donchian, Bollinger Bands, etc.).
Signal expiry features, alternate signals, and dashboard visualization are built-in. Filters can be stacked/combined or toggled via the settings panel.
Features:
Entry/exit signals: LONG/SHORT labels, arrows, dashboard summary
Signal confirmation: EMA/SMA/MA crosses, trend, range, oscillator filters
Custom overlays: supply/demand zones, pivot levels, ranges, fractals, volume bands
Modular configuration: choose methods, combine signals, tune sensitivity and cooldown
Advanced filters: trend alignment, volatility breakout, multiple timeframe signals
Risk management: automate signal expiry, stop-loss, TP projections, risk/reward display
Dashboard panel: flexible position, size, session overlays, instant summary of conditions
UI: All interactive controls and outputs (labels, tooltips, dashboard text) default to English; if other language is used in UI, translation is provided in this description.
How to use:
Add the indicator to your chart, then use the settings panel to select entry type, confirmation logic, overlays, and dash display. Combine filters to custom-build rules. Use labels/arrows and dashboard to monitor entries and manage risk. Designed for manual, semi-automatic and automated strategy development.
Originality:
This tool is not just a mashup of popular methods but provides a true framework for custom strategy creation directly on TradingView, with unique stacking, dynamic dashboard, and advanced filter/expiry management.

ZS Master Vision Pro - Advanced Multi-Timeframe Trading SystemZS MASTER VISION PRO - PROFESSIONAL TRADING SUITE
Created by Zakaria Safri
A comprehensive, all-in-one trading system combining multiple proven technical analysis methods into a single, powerful indicator. Designed for traders who demand precision, clarity, and actionable signals across all timeframes.
KEY FEATURES
CORE TREND ALGORITHM
Adaptive ATR-based trend detection with dynamic support and resistance zones. Features Type A and Type B signal modes for different trading styles, strong signal detection in key reversal zones, and optional EMA source smoothing for noise reduction.
MULTI-LAYER EMA CLOUD SYSTEM
Five customizable EMA cloud layers for multi-timeframe analysis with theme-adaptive color coding across five professional themes. Optional line display for detailed MA tracking with configurable periods from scalping to position trading.
WAVE TREND OSCILLATOR
Advanced momentum oscillator with channel-based calculations featuring smart reversal detection at extreme overbought and oversold levels. Includes directional strength confirmation and customizable sensitivity with adjustable reaction periods.
DIVERGENCE SCANNER
Detects four types of divergence automatically:
- Regular Bullish: Price making lower lows while oscillator making higher lows
- Regular Bearish: Price making higher highs while oscillator making lower highs
- Hidden Bullish: Trend continuation signals in uptrends
- Hidden Bearish: Trend continuation signals in downtrends
Automatic fractal-based detection with clear visual labels on chart.
MARKET BIAS INDICATOR
Heikin Ashi-based trend strength analysis with real-time bias calculation showing Bullish or Bearish combined with Strong or Weak conditions. Smoothed for cleaner signals and perfect for trend confirmation.
MOMENTUM SYSTEM
Proprietary momentum calculation using adaptive smoothing with growing and falling state detection. Normalized values for consistent interpretation and responsive to rapid market changes.
DYNAMIC SUPPORT AND RESISTANCE
Automatic pivot-based support and resistance level detection with adjustable left and right bar lookback. Non-repainting levels with visual clarity through color-coded lines.
LIVE INFORMATION DASHBOARD
Real-time market analysis panel displaying current trend direction, market bias based on Heikin Ashi, Wave Trend status and value, and momentum trend with state. Customizable display options with theme-adaptive colors.
VISUAL CUSTOMIZATION
FIVE PROFESSIONAL COLOR THEMES:
Pro - Modern green and red color scheme (default)
Classic - Traditional teal and red combination
Cyberpunk - Neon cyan and magenta contrast
Ocean - Blue and orange contrast
Sunset - Gold and red warmth
SIGNAL STYLES:
Labels with emoji indicators (BUY with rocket, SELL with bear, STRONG with lightning)
Arrows for clean minimal appearance
Triangles for classic approach
DISPLAY OPTIONS:
Color-coded candles following trend direction
Trend background highlighting for instant trend recognition
Optional EMA line display for detailed analysis
Adjustable transparency levels for personal preference
SMART ALERTS
Pre-configured alert conditions for all major signals:
Buy signals for standard entry opportunities
Sell signals for standard exit or short opportunities
Strong buy signals for high-confidence long entries
Strong sell signals for high-confidence short entries
Bullish divergence detection alerts
Bearish divergence detection alerts
Alert messages automatically include ticker symbol, current price, and specific signal type for quick decision making.
HOW TO USE
FOR TREND TRADERS:
Enable EMA Clouds with focus on Cloud 5 featuring 50 and 200 period moving averages. Wait for trend background color change to confirm direction. Enter on STRONG signals aligned with higher timeframe trend direction. Use support and resistance levels for strategic exits.
FOR SWING TRADERS:
Enable Wave Trend Oscillator information display. Look for oversold and overbought reversal setups. Confirm potential reversals with divergence scanner. Enter on smart reversal signals with proper risk management.
FOR SCALPERS:
Use Type B signal mode for more frequent trading signals. Enable Cloud 1 with 5 and 13 periods for quick trend confirmation. Focus on momentum growing and falling states for entry timing. Take quick entries on regular buy and sell signals.
FOR POSITION TRADERS:
Use Type A mode with higher ATR multiplier set to 3.0 or above. Enable only Cloud 5 with 50 and 200 periods for major trend confirmation. Only take STRONG signals for highest probability setups. Hold positions through minor pullbacks and noise.
RECOMMENDED SETTINGS
STOCKS ON DAILY TIMEFRAME:
Trend Period: 180
ATR Period: 155
ATR Multiplier: 2.1
Signal Mode: Type A
FOREX ON HOURLY AND 4-HOUR TIMEFRAMES:
Trend Period: 150
ATR Period: 120
ATR Multiplier: 2.5
Signal Mode: Type A
CRYPTOCURRENCY ON 15-MINUTE AND 1-HOUR TIMEFRAMES:
Trend Period: 100
ATR Period: 80
ATR Multiplier: 3.0
Signal Mode: Type B
SCALPING ON 1-MINUTE AND 5-MINUTE TIMEFRAMES:
Trend Period: 50
ATR Period: 40
ATR Multiplier: 2.0
Signal Mode: Type B
WHAT IS INCLUDED
Trend Analysis using ATR-based adaptive algorithm
Five EMA Cloud Layers for multi-timeframe confluence
Wave Trend Oscillator for momentum and reversal detection
Divergence Scanner detecting four types of divergence
Market Bias using Heikin Ashi-based trend strength
Momentum System with advanced momentum tracking
Support and Resistance Levels with automatic pivot detection
Live Dashboard showing real-time market analysis
Smart Alerts featuring six pre-configured alert types
Five Color Themes offering professional visual options
TECHNICAL DETAILS
CALCULATION METHODS:
Average True Range (ATR) for volatility adaptation
Exponential Moving Average (EMA) and Simple Moving Average (SMA) for trend smoothing
Wave Trend channel oscillator for momentum analysis
Fractal-based divergence detection algorithm
Heikin Ashi transformation for bias calculation
Logarithmic momentum calculation for precision
PERFORMANCE CHARACTERISTICS:
Optimized for maximum speed and efficiency
No repainting signals ensuring reliability
Works on all timeframes from 1 minute to monthly
Compatible with all instruments including stocks, forex, crypto, and futures
RISK DISCLAIMER
This indicator is a technical analysis tool and should not be used as the sole basis for trading decisions. Always use proper risk management and never risk more than you can afford to lose. Combine with other analysis methods and practice on demo accounts first. Past performance does not guarantee future results. Trading carries substantial risk and is not suitable for all investors.
SUPPORT AND UPDATES
Regular updates and continuous improvements
Based on proven technical analysis principles
Developed following Pine Coders best practices and standards
Clean, well-documented, and optimized code structure
WHY CHOOSE ZS MASTER VISION PRO
All-in-one solution eliminating the need for multiple indicators
Highly customizable to adapt to your specific trading style
Professional grade analysis with institutional-quality standards
Clean interface that is not cluttered or confusing
Works everywhere across all markets and all timeframes
Smart signals filtered for quality over quantity
Beautiful design featuring five professional color themes
Active development with regular improvements and updates
Transform your trading with ZS Master Vision Pro today.
Version 2.0 | Created by Zakaria Safri | Pine Script Version 5

Binary Options Fast Scalping [TradingFinder] M1 & M5 Signals🔵 Introduction
In the structure of financial markets, spiky moments and sudden price movements play a key role in Liquidity Grabs and Market Structure Resets. These movements usually occur after the accumulation of orders in Buy Side or Sell Side Liquidity zones and are accompanied by rapid breaks in the form of Break of Structure (BoS) or Change of Character (CHoCH).
At this stage, the market temporarily moves in the direction of liquidity to trigger counter orders and then enters a Retracement or Pullback phase, a point where professional traders using the Smart Money Concept (SMC) look for candle confirmation to enter with precision.
This strategy is built upon the same logic : an initial spiky move as a signal of institutional or liquidity driven algorithms, followed by a controlled pullback toward areas such as the Order Block, Fair Value Gap (FVG), or Imbalance Zone, and finally an entry based on a strong confirmation candle (Engulf, Rejection, Breaker) that defines the true direction of order flow.
This combination of price behavior, especially on lower timeframes such as M1 or M5, provides an ideal setup for fast Scalping, Micro Structure Trading, and even short term directional prediction in Binary Options Trading.
Since the main focus of this method is on identifying liquidity phases, structural confirmations, and momentum confirmation candles, the trader can design entries with high probability and logical stop loss placement using the concepts of Fractal Market Structure and Multi Timeframe Confirmation.
In the scalping version, the main objective is to capture the move toward the next liquidity pool or opposite demand and supply zone, while in the binary version, only the prediction of the next candle’s direction matters. This strategy inherently operates based on Smart Money Behavior, Liquidity Engineering, and Order Flow Dynamics, allowing the extraction of fast and profitable moves from the internal logic of market structure.
🔵 How to Use
The operational logic of this strategy is based on Liquidity Sweep, Pullback, and Confirmation Candle. The trader should first identify the initial Impulse Move, which is often accompanied by liquidity absorption around Buy Side or Sell Side Liquidity areas. After that, the market enters the Retracement phase and returns to structural zones such as the Order Block or the Fair Value Gap (FVG).
At this point, a position is taken only when a confirmation candle (Engulf, Breaker, or Rejection Candle) closes in the direction of continuation and aligns with the new structure (BOS or CHoCH). Applying this model on lower timeframes offers the highest precision for fast Scalping or for predicting the next candle’s direction in Binary Option trading.
🟣 Bullish Setup
In the bullish setup, the market first forms a spiky upward move with a sudden increase in momentum, indicating the activation of liquidity flow in the Buy Side Liquidity zone. This movement is usually accompanied by a Break of Structure (BOS) to the upside and marks the beginning of the Impulse Move phase. After this move, the price enters the Pullback phase and returns to structural areas such as the Bullish Order Block, Fair Value Gap (FVG), or Mitigation zone.
At this stage, the trader waits for a bullish confirmation candle (Bullish Engulf or Breaker Candle) to validate the end of the retracement. Entry is made at the close of the confirmation candle or on a minor pullback, with the stop loss placed below the Swing Low or below the pullback zone. The target is set at the next Buy Side Liquidity or Equal Highs. In the binary version, only the direction of the next candle matters and the entry takes place immediately after the confirmation candle.
🟣 Bearish Setup
In the bearish setup, the market first forms a spiky downward move, signaling increased selling pressure and liquidity absorption at the Sell Side Liquidity zone. This movement is accompanied by a Break of Structure (BOS) to the downside and represents the beginning of a bearish momentum phase. After the spike, the price enters the Retracement phase and returns to the Bearish Order Block or bearish Fair Value Gap zone. Within these areas, the formation of a bearish confirmation candle (Bearish Engulf, Breaker, or Rejection Candle) validates the continuation of the downtrend.
The entry is taken at the close of the confirmation candle, with the stop loss placed above the Swing High or above the pullback zone, and the target set toward the next Sell Side Liquidity or Equal Lows. In binary applications, only the direction of the next candle is considered and the confirmation candle serves as the entry trigger.
🔵 Conclusion
This strategy, by combining the principles of the Smart Money Concept, Liquidity Dynamics, and Candle Confirmation Logic, offers a precise and multi functional approach to market entry. Its core structure, identifying the initial spiky movement, waiting for a structural pullback, and entering based on a confirmation candle allows quick interpretation of institutional liquidity behavior and provides trading opportunities with high accuracy and controlled risk.
On lower timeframes, this logic becomes a powerful tool for Scalping and Micro Structure Trading, while in binary markets it delivers high success rates due to its focus on predicting the next candle’s direction. Built upon the foundations of Order Flow, Market Structure, and Fractal Liquidity Behavior, this strategy demonstrates that even in the fastest and noisiest market conditions, the order of Smart Money remains observable and exploitable.

Market Structure ICT Screener [TradingFinder] BoS ChoCh🔵 Introduction
Market Structure is the foundation of every Smart Money and ICT based trading model. It describes how price moves through a sequence of highs and lows, forming clear phases of expansion, retracement and reversal. Understanding this structure allows traders to read institutional order flow and align their positions with the true direction of liquidity.
Two of the most critical components in Market Structure are the Break of Structure (BOS) and Change of Character (CHOCH). A BOS represents trend continuation, confirming strength within the current direction. In contrast, CHOCH also known as a Market Structure Shift (MSS) signals the first sign of a trend reversal or liquidity shift where order flow begins to change from bullish to bearish or vice versa.
Because the market is fractal, structure can exist at multiple levels known as Major (External) and Minor (Internal). Major structure defines the overall trend on higher timeframes while minor or internal structure reveals short term swings and early reversals within that larger move.
🔵 How to Use
Understanding Market Structure starts with identifying how price interacts with previous swing highs and swing lows. Every trend in the market, whether bullish or bearish, is built from a sequence of impulsive and corrective moves. Impulsive legs show strong displacement in the direction of liquidity flow, while corrective legs represent temporary pullbacks as the market rebalances before the next expansion. Recognizing these sequences is essential for reading the story of price and anticipating what may happen next.
A Break of Structure (BOS) occurs when price decisively moves beyond a previous structural point by breaking above the last high in an uptrend or falling below the last low in a downtrend. This event confirms that the current trend remains intact and that liquidity has been successfully taken from one side of the market. A BOS acts as confirmation of continuation and reflects strength within the existing directional bias.
A Change of Character (CHOCH) appears when price violates structure in the opposite direction of the prevailing trend. This is the first signal that market sentiment and order flow may be shifting. For example, during a downtrend if price breaks above a previous high, it indicates that sellers are losing control and a potential bullish reversal may be developing. In an uptrend, when price drops below a recent low, it suggests a possible bearish transition.
Because the market is fractal, structure exists across multiple layers. Major structure reflects the dominant movement visible on higher timeframes and defines the broader directional bias. Minor or internal structure represents smaller swings within that move and helps identify early transitions before they appear on the higher timeframe. When internal and external structures align, they offer a high probability signal for trend continuation or reversal.
By observing BOS and CHOCH across both internal and external structures, traders can clearly visualize when the market is expanding, contracting or preparing to shift direction. This structured understanding of price movement forms the foundation for precise trend analysis and high quality decision making in any Smart Money or ICT based trading approach.
🔵 Settings
🟣 Display Settings
Table on Chart : Allows users to choose the position of the signal dashboard either directly on the chart or below it, depending on their layout preference.
Number of Symbols : Enables users to control how many symbols are displayed in the screener table, from 10 to 20, adjustable in increments of 2 symbols for flexible screening depth.
Table Mode : This setting offers two layout styles for the signal table :
Basic : Mode displays symbols in a single column, using more vertical space.
Extended : Mode arranges symbols in pairs side-by-side, optimizing screen space with a more compact view.
Table Size : Lets you adjust the table’s visual size with options such as: auto, tiny, small, normal, large, huge.
Table Position : Sets the screen location of the table. Choose from 9 possible positions, combining vertical (top, middle, bottom) and horizontal (left, center, right) alignments.
🟣 Symbol Settings
Each of the 20 symbol slots comes with a full set of customizable parameters :
Symbol : Define or select the asset (e.g., XAUUSD, BTCUSD, EURUSD, etc.).
Timeframe : Set your desired timeframe for each symbol (e.g., 15, 60, 240, 1D).
Pivot Period : Set the length used to detect swing highs and lows. Shorter values increase sensitivity, longer ones focus on major structures.
🔵 Conclusion
Mastering Market Structure and understanding the relationship between BOS and CHOCH allows traders to see the market with greater clarity and confidence. These two elements reveal how liquidity moves through different phases of expansion and retracement and how institutional order flow shifts between accumulation and distribution.
By analyzing both internal and external structures, traders can align short term and long term perspectives and anticipate where price is most likely to react. The ability to read these structural shifts helps identify continuation points, reversals and areas where liquidity is engineered or collected.
Incorporating Market Structure into a consistent trading process transforms the way a trader views the chart. Instead of reacting to random movements, each swing, break and shift becomes part of a logical framework that reflects the true behavior of the market. Understanding BOS and CHOCH is not just a concept but a complete language of price that guides every professional decision in Smart Money and ICT based trading.

MM-Auto SQ9 V1.0MM-Auto SQ9 V1.0 — Automatic Square-of-9 levels from a selected pivot (Bottom/Top). Choose base shape or Custom Angle, optional half-angles, cycles, and full color/style control.
Disclaimer: Educational purposes only — not financial advice.
**What it is**
A visual Gann Square-of-9 level engine. It projects horizontal SQ9 price levels from a single pivot using root/square transforms, with selectable geometric bases (90°/60°/72°/120°/45°) or a **Custom Angle**, optional **Sub-Angles (half-angles)**, multi-cycle expansion, full styling control, and a **draggable 0-line** pivot.
**Key features**
* **Draggable 0-line:** Drag the pivot line on the chart and drop it on any swing high/low — no need to type the reference price. Levels recalc instantly.
* **Bottom/Top modes** for projection direction.
* **Shapes or Custom Angle** (Square/Octagon/Hexagon/Triangle/Pentagon or your own).
* **Sub-Angles (½)** with separate style/color.
* **Cycles** to extend the grid.
* **Clean UI**: labels (size/distance), line thickness/style/colors, pivot line style.
**Inputs (quick guide)**
Pivot Price • Pivot Type (Bottom/Top) • Space Multiplier • Geometric Shape / Custom Angle Value • Number of Cycles • Show Sub-Angles & Line Style • Colors & Line Thickness • Labels (on/size/distance).
**Workflow**
1. Drag the **0-line** to your pivot (any swing high/low) or set **Pivot Price** and **Bottom/Top**.
2. Pick shape or **Custom Angle**; increase **Cycles** if needed.
3. Tune **Space Multiplier** to align levels with historical reactions.
4. (Optional) Enable **Sub-Angles** for finer structure.
5. Observe **bounce / break / retest** around levels and combine with your system.
**Pro tips**
* Use a **structural swing** as pivot.
* Reduce clutter by lowering cycles or disabling sub-angles.
* Pair with **market structure / volume / ATR / fractals** for decision support.
* Adjust label size/distance to keep charts clean.
**Troubleshooting (dragging)**
If the 0-line doesn’t move, ensure drawings are **unlocked** and “Move drawings” is enabled in chart settings.
**Disclaimer & Rights**
Educational purposes only — **not financial advice**.
Script programmed by **Mohammad Murad (MM)**.
© 2025 **Mohammad Murad**. **All rights reserved.** No unauthorized copying, distribution, or resale.
## 🇸🇦/🇸🇾 الوصف العربي
**ما هو المؤشّر؟**
محرّك مستويات جان **Square-of-9** يعرض مستويات سعرية أفقية من **Pivot** واحد باستخدام تحويل الجذر/التربيع، مع اختيار شكل زاوي جاهز (90°/60°/72°/120°/45°) أو **زاوية مخصّصة**، وخيار **أنصاف الزوايا**، ودورات متعددة، وتحكّم كامل بالمظهر، وميزة **سحب خط الصفر** لتغيير المحور بسرعة.
**أهم الميزات**
* **سحب خط الصفر:** اسحب خط الـ0 (Pivot) وضعه على أي قاع/قمة — بدون إدخال السعر يدويًا. تُعاد الحسابات فورًا.
* وضعا **Bottom/Top** لتحديد اتجاه الإسقاط.
* **أشكال جاهزة أو زاوية مخصّصة**.
* **أنصاف الزوايا (½)** بنمط/لون مستقلين.
* **الدورات (Cycles)** لتوسعة الشبكة.
* **تحكّم بصري كامل**: عناوين بحجم/مسافة، سماكة/نمط/ألوان الخطوط، ونمط خط المحور.
**الإعدادات باختصار**
Pivot Price • Pivot Type (Bottom/Top) • Space Multiplier • Geometric Shape / Custom Angle • Number of Cycles • Sub-Angles & Line Style • الألوان والسماكات • إعدادات العناوين (إظهار/حجم/مسافة).
**طريقة الاستخدام**
1. اسحب **خط الصفر** إلى القاع/القمة المطلوبة أو حدّد **Pivot Price** واختر **Bottom/Top**.
2. اختر الشكل أو **زاوية مخصّصة**؛ وفعّل **Cycles** إذا لزم.
3. عدّل **Space Multiplier** حتى ترى احتراماً تاريخياً للمستويات.
4. (اختياري) فعّل **أنصاف الزوايا** للدقة.
5. راقب **الارتداد/الاختراق/إعادة الاختبار** وادمجها مع نظامك.
**نصائح**
* اختر Pivot بنيوي واضح (Swing).
* لتقليل الزحمة: خفّض الدورات أو عطّل أنصاف الزوايا.
* دمجها مع **بنية السوق/الفوليوم/ATR/الفراكتلات** يدعم القرار.
* تحكّم بحجم/مسافة العناوين للحفاظ على نظافة الشارت.
**حلّ مشكلة السحب**
إذا ما تحرّك خط الصفر: تأكّد أن الرسومات **غير مقفولة** وأن خيار تحريك الرسومات مفعّل في إعدادات الشارت.
**إخلاء مسؤولية وحقوق**
لأغراض تعليمية فقط — **ليست نصيحة مالية**.
السكربت مبرمج بواسطة **Mohammad Murad (MM)**.
© 2025 **Mohammad Murad**. **جميع الحقوق محفوظة.** يُمنع النسخ/التوزيع/البيع دون إذن.
#Gann #SquareOf9 #SQ9 #Angles #CustomAngle #SupportResistance #PineScript #TradingView


APO Channel // SuperTrend Optimized📌 Complete Long Description (Final Version)
APO Channel – Adaptive Breakout Detection
🔹 How it works
The originality of this script lies in the combination of two complementary approaches:
An adaptive channel, whose responsiveness is based on fractal dimension and volatility.
A breakout & candle confirmation system, providing clear visual trade signals.
Unlike standard channels (e.g., Bollinger Bands), which use a fixed deviation or multiplier, the APO Channel dynamically adjusts its baseline (Filt) and bands (Filt1, Filt2) in real time. This ensures that signals are not only adaptive to market conditions but also reinforced when both indicators align simultaneously, filtering out false moves and highlighting stronger trade opportunities.
🔹 Why this combination matters
By merging an adaptive volatility channel with a breakout confirmation system, the script provides traders with a more reliable view of momentum shifts.
The channel identifies when markets are consolidating versus expanding.
The breakout signals confirm actual momentum surges.
When both conditions trigger together, the likelihood of a meaningful move increases, making signals clearer and more robust than using either tool alone.
🔹 Visual signals
The script offers optional candle coloring and breakout labels:
Bullish signals are shown when price breaks above the adaptive upper band.
Bearish signals appear when price breaks below the adaptive lower band.
For clearer visualization, traders can activate the blue, green, and gray candles by clicking on the channel bands.
👉 This makes simultaneous signals and the prevailing trend much more visible, helping traders quickly spot alignment between the adaptive channel and breakout confirmation.
🔹 Optimized Default Settings
Channel Length: 26
Bands Distance: 1
ATR Period: 1
Source: (High + Low)/2
ATR Multiplier: 2
These parameters have been optimized for balanced responsiveness across assets.
👉 Signals are particularly relevant for scalping entries on the 3-minute timeframe, where quick detection of breakouts provides a trading edge.
The indicator works seamlessly on futures, crypto, forex, stocks, and most other instruments, making it a versatile tool for traders across markets.
🔹 How to use
Use breakouts above the channel as a potential entry signal for bullish momentum trades.
Use breakouts below the channel as a potential entry signal for bearish momentum trades.
When both the breakout signal and candle confirmation occur simultaneously, consider it a stronger trading signal.
Activate candle coloring on the channel bands to make signals and trend more visible.
Combine with other tools (volume, higher timeframe bias) for additional confirmation.
✅ Why this script adds value
Most breakout tools rely on static measures (fixed standard deviation, moving average envelopes, etc.). The APO Channel introduces an adaptive filter based on fractal dimension analysis, while also reinforcing signals through dual confirmation (channel breakouts + candle regime).
This makes it a versatile tool for traders seeking adaptive, visually clear, and reliable breakout detection across multiple markets and timeframes.

Silent Trigger Silent Trigger combines widely used concepts under one scoring engine. Each module adds weight only when its conditions are met:
1. Higher-Timeframe (HTF) context
• Requests 1H and the next HTF up (e.g., 4H/D) with request.security(...) on confirmed bars only.
• Uses RSI(14) and a MACD line (EMA12–EMA26 difference) for bias.
• By default HTF weights the score. There is an option to require HTF alignment if you prefer a hard filter.
2. Market regime
• ADX for trend strength.
• Bollinger Band width and a fractal-energy proxy to detect squeeze/coiling vs expansion.
3. Smart-money / Wyckoff structure
• High-volume narrow bars, absorption, spring/upthrust, and liquidity grabs past recent swing highs/lows.
4. Momentum & divergences
• RSI and MACD-line divergences (regular + hidden) and simple exhaustion checks.
5. Fair Value Gaps (FVG)
• 3-bar gap with mid-gap revisit confirmation.
6. Volume context
• Relative volume and a compact 10-bin rolling volume profile to locate HVN proximity.
7. Sessions / time filter
• Optional London/NY “kill zone” participation filter.
8. Correlation (optional)
• Simple BTC trend check for USD-quoted markets.
Pre-Move (yellow) logic:
Triggers only when the market is compressed (squeeze/low fractal energy), ADX is rising, the MACD histogram is near zero (pressure building), and there is a money-flow impulse (MFI slope and/or OBV Z-score spike).
The yellow diamond is plotted on the side of the expected move:
• Below for bullish reversals / Above for bullish breakouts.
• Above for bearish reversals / Below for bearish breakouts.
A built-in cooldown keeps yellows from spamming.
⸻
What appears on the chart
• Bull diamond (green): Total score ≥ your threshold and > bear score.
• Bear diamond (magenta): Mirror of the above.
• Pre-move (yellow): Early heads-up; use it with HTF context and structure.
All diamonds are intentionally tiny to minimize clutter.
⸻
Key settings
• Signal Mode & Min Probability – tighten/loosen confirmations.
• Use Higher TF in Scoring – soft weighting (default).
• Require HTF Alignment – optional hard gate.
• Module toggles – Smart Money, Wyckoff, FVG, Correlation, Sessions.
• Pre-Move – enable, cooldown bars, MFI levels, OBV Z-score threshold.
⸻
How to use (practical)
1. Choose a TF that matches your style (5–15m intraday, 1H–4H swing).
2. Read HTF bias first; trade in that direction unless structure clearly supports a reversal.
3. Treat yellow as “get ready.” Act only when a green/magenta prints with structure (S/R, FVG, HVN) and acceptable risk.
4. Place stops beyond the liquidity level or FVG midpoint; size positions conservatively.
⸻
Repainting & HTF policy
• No lookahead is used anywhere.
• request.security is called on confirmed bars; the HTF MACD line is computed inside the HTF context (single series), not by indexing a tuple.
• Signals are designed for bar-close confirmation. Intra-bar alerts can change until the bar closes.
⸻
Limitations (honest)
• Money-flow features depend on volume quality; thin/synthetic volume reduces reliability.
• Pre-moves can fail during unscheduled news shocks or when HTF trend is dominant.
• This is not financial advice. You are responsible for entries, exits, and risk.
⸻
Alerts
Built-in bull/bear alerts include direction and a probability bucket (Basic/Moderate/Strong/Extreme).
Pre-move yellows are primarily visual; you can still set an alert on their plot condition if desired.
⸻
Why this isn’t a “mashup”
• A single probability engine blends HTF bias, structure (liquidity/Wyckoff/FVG), regime, and volume into a score, rather than stacking unrelated indicators.
• A pre-move detector that requires compression + rising trend energy + money-flow impulse, and places the marker on the side of the expected move, with cooldown control.
• A lightweight rolling HVN check to bias continuation vs mean-reversion near key nodes.
⸻
Changelog (summary)
• Current release: pre-move module, HTF hard-gate option, tiny diamonds, clarified HTF/no-repaint policy, session filter tidy-up.

SM - 1 v6SM-1 v6 is a technical analysis tool that detects and visualizes Support/Resistance levels, fractals, and Fair Value Gaps. It provides real-time plotting of key price levels, highlights active zones, and issues customizable alerts. Includes options for showing/hiding visuals, adjusting strength/lookback, and limiting alerts to once per event.
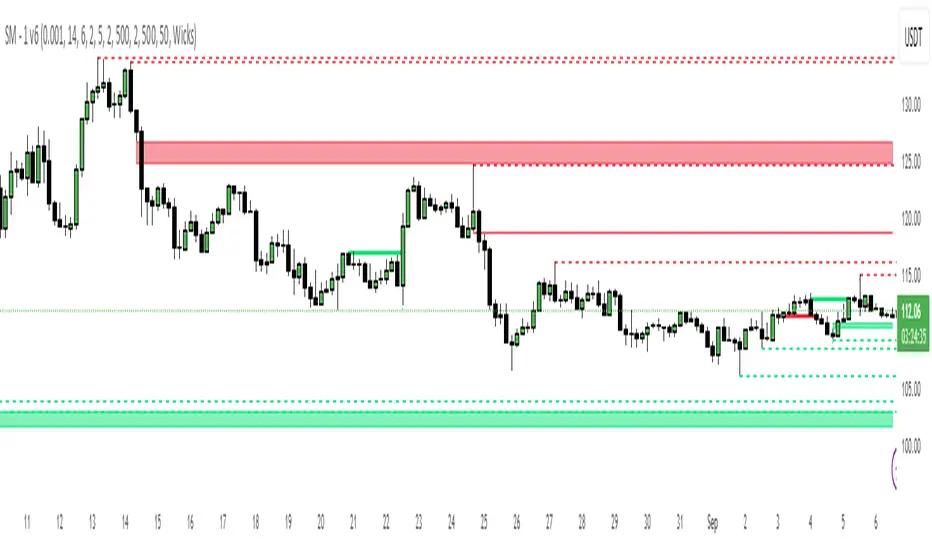
On-Balance Volume with Multiple MA TypesOn-Balance Volume with Multiple MA Types
English Description
Overview
This is the first version of the "On-Balance Volume with Multiple MA Types" indicator designed to overlay directly on the price chart, a significant evolution from its previous iterations, which functioned solely as an oscillator in a separate window. The indicator calculates On-Balance Volume (OBV) and applies various smoothing methods to provide a clear view of volume dynamics in relation to price movements. It is pinned to the price scale for seamless integration with the chart.
Interpretation Recommendations
Price Pushing the OBV Line from Below: When the price chart pushes the OBV line upward and remains below it, this indicates rising volume, suggesting strong buying pressure.
Price Above the OBV Line: When the price chart is above the OBV line, it signals falling volume, indicating weakening momentum or selling pressure.
OBV Line Crossings: When the price crosses the OBV line, it represents a balance point in volume dynamics. The price level at the current crossing can be compared to the previous crossing to assess changes in market sentiment or momentum.
Moving Average Types
The indicator offers eight smoothing options for the OBV line, each with unique characteristics:
EMA (Exponential Moving Average): A weighted average that prioritizes recent data, providing a smooth yet responsive line.
DEMA (Double Exponential Moving Average): Uses two EMAs to reduce lag, offering faster response to volume changes.
HMA (Hull Moving Average): Combines weighted moving averages to minimize lag while maintaining smoothness.
WMA (Weighted Moving Average): Assigns more weight to recent data, balancing responsiveness and noise reduction.
TMA (Triangular Moving Average): A double-smoothed simple moving average, emphasizing central data points for smoother output.
VIDYA (Variable Index Dynamic Average): Adapts smoothing based on market volatility, using a CMO (Chande Momentum Oscillator) for dynamic weighting. Controlled by the VIDYA Alpha parameter (default: 0.2, range: 0–1), which adjusts sensitivity to volatility.
FRAMA (Fractal Adaptive Moving Average): Adjusts smoothing based on fractal dimensions of the OBV data, adapting to market conditions.
JMA (Jurik Moving Average): A proprietary adaptive average designed for minimal lag and high smoothness. Controlled by two parameters:
JMA Phase (default: 50, range: -100 to 100): Adjusts the balance between responsiveness and smoothness.
JMA Power (default: 1, range: 0.1+): Controls the strength of smoothing.
Input Parameters
OBV MA Length (default: 10): The lookback period for smoothing the OBV. Higher values produce smoother results but increase lag.
OBV MA Type (default: JMA): Selects the moving average type from the eight options listed above.
Line Width (default: 2): Thickness of the OBV line on the chart.
Bullish Color (default: Blue): Color of the OBV line when rising (indicating increasing volume).
Bearish Color (default: Red): Color of the OBV line when falling (indicating decreasing volume).
JMA Phase (default: 50): Adjusts the JMA’s responsiveness (used only when JMA is selected).
JMA Power (default: 1): Adjusts the JMA’s smoothing strength (used only when JMA is selected).
VIDYA Alpha (default: 0.2): Controls the sensitivity of VIDYA to market volatility (used only when VIDYA is selected).
How to Use
Add the indicator to your TradingView chart. It will overlay directly on the price chart, aligned with the price scale.
Adjust the OBV MA Type to select your preferred smoothing method based on your trading style (e.g., JMA for low lag, TMA for smoothness).
Modify the OBV MA Length to balance responsiveness and noise reduction. Shorter periods (e.g., 5–10) are better for short-term trading, while longer periods (e.g., 20–50) suit longer-term analysis.
Use the Bullish Color and Bearish Color to visually distinguish rising and falling volume trends.
For JMA or VIDYA, fine-tune the JMA Phase, JMA Power, or VIDYA Alpha to optimize the indicator for specific market conditions.
Interpret the OBV line in relation to price:
Watch for price pushing the OBV line upward (rising volume) or moving above it (falling volume).
Note crossings of the OBV line to identify balance points and compare with prior crossings to gauge momentum shifts.
Combine with other technical tools (e.g., support/resistance levels, trendlines) for a comprehensive trading strategy.
Notes
This indicator is designed to work on any timeframe and market, but its effectiveness depends on the chosen moving average type and parameters.
Experiment with different MA types and lengths to find the best fit for your trading approach.
The indicator is licensed under the Mozilla Public License 2.0 and copyrighted by TradingStrategyCourses © 2025.

3D Surface Modeling [PhenLabs]📊 3D Surface Modeling
Version: PineScript™ v6
📌 Description
The 3D Surface Modeling indicator revolutionizes technical analysis by generating three-dimensional visualizations of multiple technical indicators across various timeframes. This advanced analytical tool processes and renders complex indicator data through a sophisticated matrix-based calculation system, creating an intuitive 3D surface representation of market dynamics.
The indicator employs array-based computations to simultaneously analyze multiple instances of selected technical indicators, mapping their behavior patterns across different temporal dimensions. This unique approach enables traders to identify complex market patterns and relationships that may be invisible in traditional 2D charts.
🚀 Points of Innovation
Matrix-Based Computation Engine: Processes up to 500 concurrent indicator calculations in real-time
Dynamic 3D Rendering System: Creates depth perception through sophisticated line arrays and color gradients
Multi-Indicator Integration: Seamlessly combines VWAP, Hurst, RSI, Stochastic, CCI, MFI, and Fractal Dimension analyses
Adaptive Scaling Algorithm: Automatically adjusts visualization parameters based on indicator type and market conditions
🔧 Core Components
Indicator Processing Module: Handles real-time calculation of multiple technical indicators using array-based mathematics
3D Visualization Engine: Converts indicator data into three-dimensional surfaces using line arrays and color mapping
Dynamic Scaling System: Implements custom normalization algorithms for different indicator types
Color Gradient Generator: Creates depth perception through programmatic color transitions
🔥 Key Features
Multi-Indicator Support: Comprehensive analysis across seven different technical indicators
Customizable Visualization: User-defined color schemes and line width parameters
Real-time Processing: Continuous calculation and rendering of 3D surfaces
Cross-Timeframe Analysis: Simultaneous visualization of indicator behavior across multiple periods
🎨 Visualization
Surface Plot: Three-dimensional representation using up to 500 lines with dynamic color gradients
Depth Indicators: Color intensity variations showing indicator value magnitude
Pattern Recognition: Visual identification of market structures across multiple timeframes
📖 Usage Guidelines
Indicator Selection
Type: VWAP, Hurst, RSI, Stochastic, CCI, MFI, Fractal Dimension
Default: VWAP
Starting Length: Minimum 5 periods
Default: 10
Step Size: Interval between calculations
Range: 1-10
Visualization Parameters
Color Scheme: Green, Red, Blue options
Line Width: 1-5 pixels
Surface Resolution: Up to 500 lines
✅ Best Use Cases
Multi-timeframe market analysis
Pattern recognition across different technical indicators
Trend strength assessment through 3D visualization
Market behavior study across multiple periods
⚠️ Limitations
High computational resource requirements
Maximum 500 line restriction
Requires substantial historical data
Complex visualization learning curve
🔬 How It Works
1. Data Processing:
Calculates selected indicator values across multiple timeframes
Stores results in multi-dimensional arrays
Applies custom scaling algorithms
2. Visualization Generation:
Creates line arrays for 3D surface representation
Applies color gradients based on value magnitude
Renders real-time updates to surface plot
3. Display Integration:
Synchronizes with chart timeframe
Updates surface plot dynamically
Maintains visual consistency across updates
🌟 Credits:
Inspired by LonesomeTheBlue (modified for multiple indicator types with scaling fixes and additional unique mappings)
💡 Note:
Optimal performance requires sufficient computing resources and historical data. Users should start with default settings and gradually adjust parameters based on their analysis requirements and system capabilities.

Valid Pullbacks [keypoems]Valid Pullbacks
This indicator marks Valid Pullbacks on a chart. The core of the script is designed to find significant swing points by maintaining and validating candidate highs and lows.
Notice this is very different than other swing marker (fractals or otherwise). This is the base used to draw DTFX/Supply and Demand Zones. I am starting a full rewrite of all the components of my market structure indicator and this is part 1.
Core Concepts
The script operates in a stateful manner, alternating between searching for a Valid Pullback High and a Valid Pullback Low.
Initial State: At the beginning, the script assumes it is searching for the first Valid Pullback High.
Alternating Search: Once a Valid Pullback High is confirmed, the script switches its state to search for a Valid Pullback Low. Conversely, after a Valid Pullback Low is confirmed, it begins searching for a Valid Pullback High. This ensures a proper sequence of alternating swing points.
Defining a Swing Point
The script uses two primary ways to define a swing point, depending on user settings:
Wick-Based Swing (Default):
A Swing High occurs when the high of a candle is higher than the high of the candle immediately before and after it. (high > high and high > high )
A Swing Low occurs when the low of a candle is lower than the low of the candle immediately before and after it. (low < low and low < low )
Close-Based Swing:
A Swing High is identified based on a more complex relationship involving the closes and highs/opens of the three most recent candles, requiring the swing point to be formed by an "up-close" candle.
A Swing Low is identified similarly, requiring the swing point to be formed by a "down-close" candle.
* The Logic
This logic to update the internal state runs on every bar of the chart to update the status of candidate highs and lows.
1. Candidate Selection
The script continuously searches for the best possible candidate for the next valid swing.
Searching for a Candidate High:
This happens only if the last confirmed swing was a Valid Pullback Low (or at the very start).
On every new bar, the script checks if the previous bar represents a better candidate than the current one.
A "better" candidate is one with a higher price. The specific price checked (high or close) depends on whether the close-based or wick-based definition of a swing is being used.
If a better candidate is found, it replaces the existing candidateHigh. The candidate's price is always recorded as the high of that bar.
Searching for a Candidate Low:
This happens only if the last confirmed swing was a Valid Pullback High.
The logic is the mirror opposite of the high search. It looks for a "better" candidate with a lower price on every new bar.
If a better candidate is found, it replaces the existing candidateLow. The candidate's price is always recorded as the low of that bar.
2. Candidate Confirmation
Once a candidate is being tracked, the script waits for a specific market action to confirm it as a Valid swing.
Confirming a Valid Pullback High:
A candidateHigh is confirmed and becomes a Valid Pullback High if the price breaks below the low of the candidate bar.
When this happens:
The candidateHigh is stored in the validHighs array.
Both the candidateHigh and candidateLow are completely reset.
The script's state switches to now search for a Valid Pullback Low.
Confirming a Valid Pullback Low:
A candidateLow is confirmed and becomes a Valid Pullback Low if the price breaks above the high of the candidate bar.
When this happens:
The candidateLow is stored in the validLows array.
Both the candidateLow and candidateHigh are completely reset.
The script's state switches to now search for a Valid Pullback High.
This continuous process of searching, updating, and confirming candidates allows the script to dynamically identify and plot the most recent and relevant valid swing points on the chart.

Feigenbaum Projection Zones [ALLDYN]🔷 Feigenbaum Projection Zones
This tool visualizes non-overlapping projection zones above and below a manually defined price range (C.E. – Center Equilibrium) using Feigenbaum constants as spacing multipliers. It’s ideal for traders who prefer structured, mathematically grounded projection layers over standard Fibonacci tools.
📌 Features:
Manual high/low range input (C.E. zone)
Feigenbaum-based zone scaling with interleaved gaps
Color-coded zones (🟥 below CE, 🟩 above CE, 🟨 CE range)
Dotted midlines through each zone
Timeframe-restricted to 15m and below for clarity
Clean label/box/line management for minimal clutter
🔒 Source code is protected to preserve custom zone spacing logic.
🧠 Designed for advanced technical analysts who want mathematical projection zones based on deterministic scaling constants.
🔍 Feigenbaum Projections: Overview
Feigenbaum Projections are derived from chaos theory, specifically Mitchell Feigenbaum’s work on bifurcations and the universality of nonlinear systems. In market terms, they attempt to map fractal or recursive structures in price movements, especially those that might echo repeating patterns in chaotic systems.
✅ Benefits:
Captures fractal and nonlinear dynamics better than Fibonacci.
Self-similarity and scaling laws can offer insights into repeating structures not seen with classical tools.
Can help model transitions between trend and consolidation through bifurcation patterns.
Tied to mathematical constants (Feigenbaum constants), offering theoretical rigor in modeling chaotic price movement.
***Compact chart view to show the full range of the FGBZ Calculations***
