Liquidity Swap Detector Ultimate - Cedric JeanjeanAdvanced Smart Money Concepts indicator designed to detect high-probability liquidity sweeps and institutional order flow reversals. This professional-grade tool combines multiple ICT (Inner Circle Trader) strategies to identify optimal entry points.
═══════════════════════════════════════════════════════
📊 KEY FEATURES:
✅ Smart Swing Detection
- Identifies confirmed swing highs and lows using adaptive lookback periods
- Eliminates false signals through double-confirmation logic
- Detects liquidity grabs at key market structure points
✅ Fair Value Gap (FVG) Analysis
- Multi-timeframe FVG detection for enhanced accuracy
- Filters imbalances by minimum size threshold
- Combines current timeframe and higher timeframe FVGs
✅ Advanced Volatility Filter
- ATR-based volatility analysis to avoid low-quality setups
- Adjustable volatility threshold (default 0.35%)
- Ensures entries during optimal market conditions
✅ Precision Signal Generation
- LONG signals: Confirmed swing lows + FVG + volatility confirmation
- SHORT signals: Confirmed swing highs + FVG + volatility confirmation
- Clear visual markers with price labels
✅ Comprehensive Alert System
- Three alert types: Simple, Detailed, JSON (for webhooks)
- Separate LONG/SHORT alert controls
- Compatible with MT5 integration via webhooks
- TradingView native alertcondition support
✅ Professional Dashboard
- Real-time ATR monitoring
- Volatility percentage display
- FVG status indicator
- Alert status tracker
═══════════════════════════════════════════════════════
⚙️ CUSTOMIZABLE PARAMETERS:
🔹 Lookback Swing (1-50): Defines swing detection sensitivity
🔹 ATR Multiplier: Controls wick filter strength
🔹 Volatility Filter: Minimum required market volatility (%)
🔹 FVG Filter: Minimum fair value gap size (%)
🔹 FVG Timeframe: Higher timeframe for multi-TF analysis
🔹 Visual Options: Toggle swing marks, FVG zones, labels
🔹 Alert Controls: Enable/disable LONG/SHORT notifications
═══════════════════════════════════════════════════════
📈 HOW IT WORKS:
1. The indicator scans for confirmed swing points using a robust double-confirmation algorithm
2. Simultaneously analyzes Fair Value Gaps on both current and higher timeframes
3. Validates market volatility to ensure sufficient price movement
4. Generates precise entry signals when all conditions align
5. Triggers customizable alerts for instant notification
═══════════════════════════════════════════════════════
🎯 BEST PRACTICES:
- Use on liquid markets (Forex majors, indices, crypto)
- Recommended timeframes: 15m, 1H, 4H
- Combine with support/resistance for confirmation
- Adjust lookback period based on market volatility
- Test alert settings before live trading
- Use JSON alerts for automated trading integration
═══════════════════════════════════════════════════════
⚡ ALERT CONFIGURATION:
1. Click the Alert icon (bell) in TradingView
2. Select "Liquidity Swap Detector Ultimate - TITAN v6"
3. Choose your preferred alert condition:
- LONG Signal: Only bullish setups
- SHORT Signal: Only bearish setups
- ANY Signal: All trading opportunities
4. Set expiration and notification preferences
5. For MT5 integration: Select "JSON" message type and configure webhook URL
Tìm kiếm tập lệnh với "Inner circle trader "

ICT Liquidity Sweep Asia/London 1 Trade per High & Low🧠 ICT Liquidity Sweep Asia/London — 1 Trade per High & Low
This strategy is inspired by the ICT (Inner Circle Trader) concepts of liquidity sweeps and market structure, focusing on the Asia and London sessions.
It automatically identifies liquidity grabs (sweeps) above or below key session highs/lows and enters trades with a fixed risk/reward ratio (RR).
----------------------------------------------------------------------------------
----------------------------------------------------------------------------------
⚙️ Core Logic
-Asia Session: 8:00 PM – 11:59 PM (New York time)
-London Session: 2:00 AM – 5:00 AM (New York time)
-The script marks the Asia High/Low and London High/Low ranges for each day.
-When the market sweeps above a session high → potential Short setup
-When the market sweeps below a session low → potential Long setup
-A trade is triggered when the confirmation candle closes in the opposite direction of the sweep (bearish after a high sweep, bullish after a low sweep).
-Only one trade per sweep type (1 per High, 1 per Low) is allowed per session.
----------------------------------------------------------------------------------
----------------------------------------------------------------------------------
📈 Risk Management
-Configurable Risk/Reward Target (default = 2:1)
-Configurable Position Size (number of contracts)
-Each trade uses a fixed Stop Loss (beyond the wick of the sweep) and a Take Profit calculated from the RR setting.
-All trades are automatically logged in the Strategy Tester with performance metrics.
----------------------------------------------------------------------------------
----------------------------------------------------------------------------------
💡 Features
✅ Visual session highlighting (Asia = Aqua, London = Orange)
✅ Automatic liquidity line plotting (session highs/lows)
✅ Entry & exit labels (optional visual display)
✅ Customizable RR and contract size
✅ Works on any instrument (ideal for indices, futures, or forex)
✅ Compatible with all timeframes (optimized for 1M–15M)
----------------------------------------------------------------------------------
----------------------------------------------------------------------------------
⚠️ Notes
-Best used on New York time-based charts.
-Designed for educational and backtesting purposes — not financial advice.
-Use as a foundation for further optimization (e.g., SMT confirmation, FVG filter, or time-based restrictions).
----------------------------------------------------------------------------------
----------------------------------------------------------------------------------
🧩 Recommended Use
Pair this with:
-ICT’s concepts like CISD (Change in State of Delivery) and FVGs (Fair Value Gaps)
-Higher timeframe liquidity maps
-Session bias or daily narrative filters
----------------------------------------------------------------------------------
----------------------------------------------------------------------------------
Author: jygirouard
Strategy Version: 1.3
Type: ICT Liquidity Sweep Automation
Timezone: America/New_York

ICT Levels Breach Scanner (12M Timeframe)Detects and scans for breaches of key Inner Circle Trader (ICT) concepts on the yearly (12M) chart: Swing Lows (3-bar wick pivots), Rejection Blocks (3-bar body pivots), Fair Value Gaps (3-bar inefficiencies), and Volume Imbalances (bullish body gaps ≥0.15%, unmitigated).
Features:
Tracks active levels with arrays for real-time breach detection (price low below any level triggers alert).
Visuals: Blue solid lines (Swing Lows), orange dashed (Rejection Blocks), purple dotted (FVGs), green boxes (VIs)—all extending right.
Red triangle + bgcolor alert on breach bar; built-in alertcondition for notifications.
Optimized for Pine Screener: Filter stocks (e.g., US exchanges) showing symbols where price has traded below these levels on the latest 12M bar.
Usage: Apply to a 12M chart for viz, or add to Screener > Pine tab for multi-symbol scans. Customize gap % or add bearish variants via inputs. Ideal for spotting potential support in long-term trends.
ICT-inspired; test on liquid stocks like AAPL/TSLA. Not financial advice.

ICT FVG Buy/Sell SignalsThis bot is built on ICT (Inner Circle Trader) concepts such as:
Fair Value Gaps (FVGs) – imbalance zones between candles.
Consequent Encroachment (CE) – the midpoint of a gap.
Premium / Discount Arrays – dealing ranges split into premium (sell-side) and discount (buy-side) zones.
Displacement candles – strong impulsive moves that confirm intent.
The bot scans for FVGs, marks CE levels, and waits for price to return to these levels.
When price revisits a valid FVG zone with displacement confirmation and in the correct PD array, the bot generates a BUY or SELL signal.
✅ Signal Rules
Buy Signal
Price trades back into a Bullish FVG.
Current bar shows bullish displacement (large bullish body relative to ATR).
Price is in discount territory of the current dealing range (if PD filter is enabled).
Close is above the CE line of the FVG.
Sell Signal
Price trades back into a Bearish FVG.
Current bar shows bearish displacement.
Price is in premium territory of the current dealing range.
Close is below the CE line of the FVG.
🎯 What You’ll See on the Chart
Green “BUY” labels below candles when long signals trigger.
Red “SELL” labels above candles when short signals trigger.
Shaded background:
Red = Premium zone (sell side).
Teal = Discount zone (buy side).
Yellow line = dealing range midpoint (equilibrium).
Dots on CE lines = midpoints of the latest bullish/bearish FVG.
🔔 Alerts
ICT Buy → Triggers when a bullish setup confirms.
ICT Sell → Triggers when a bearish setup confirms.
You can connect these alerts to:
TradingView notifications.
Webhooks (for brokers or bots like MetaTrader, NinjaTrader, or Discord).
⚙️ Settings
Swing length – how many bars to use when detecting swing highs/lows for the dealing range.
Use PD filter – toggle ON/OFF for requiring discount/premium alignment.
Displacement ATR multiple – how strong the candle body must be compared to ATR to count as a displacement.
ATR length – used for displacement filter.
📈 Supported Markets
Works on all symbols and timeframes.
Commonly applied to:
NASDAQ (NQ, QQQ)
S&P500 (ES, SPX, SPY)
Forex pairs
Crypto (BTC, ETH, etc.)
⚠️ Disclaimer
This bot is for educational purposes only. It does not guarantee profits and should be tested on demo accounts first.
Always apply proper risk management before trading live.

SMT for Time-Based Sessions [ufo]SMT for Time-Based Sessions identifies when one asset breaks a session’s high/low while another correlated asset fails to do so. This imbalance often signals engineered liquidity grabs, reversals, or continuation setups. By focusing on divergences within specific trading sessions (London, New York AM, Lunch, New York PM, Asia, Daily or your own custom windows), the tool filters out noise and pinpoints only the most meaningful SMT divergences across multiple symbols in real-time.
Core Concept:
SMT (Smart Money Technique/Tool/Time) is a concept popularized by Inner Circle Trader (ICT) that suggests that when correlated or inversely correlated instruments fail to confirm each other's price movements (e.g., one breaks a high/low while the other doesn’t), it often indicates:
Liquidity manipulation by institutional players
Potential reversal points in the market
Weakness or strength in the current trend
Stop hunt operations before significant moves
This indicator identifies these divergences by comparing your chart symbol against up to two comparison symbols across different sessions and timeframes.
How Time-Based SMT Works:
Unlike basic divergence tools, this indicator is built specifically for Session-Based and Timeframe-Based SMT tracking. It continuously monitors intraday sessions and higher timeframes, then plots divergences the moment they occur.
Time-Based Session SMT
Session Tracking: Monitors highs and lows during each session
Post-Session Analysis: After a session ends, tracks whether price breaks session levels
Divergence Detection: When the main symbol breaks a high/low but comparison symbols don’t (or vice versa), an SMT signal is triggered
(e.g. Nasdaq traded above London high while S&P500 does not)
Visual Confirmation: Lines connect the session reference to the current extreme, with labels showing the diverging session, high/low, and symbol, this information is also displayed in the Info Panel
This will update if a new high/low extreme is made while the SMT is still valid, if invalidated these will be removed from the chart
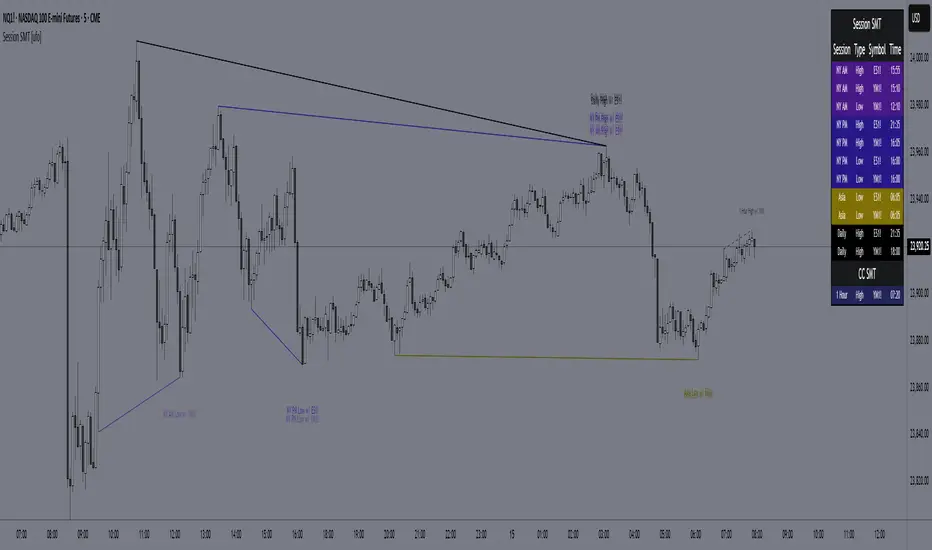
Example:
This NQ chart includes ES and YM as comparison symbols. At 03:20 AM New York time, both ES and YM broke the Asia session low (20:00 – 00:00), while NQ did not. This creates a bullish session divergence , which the indicator immediately detects and plots.
Although the chart shows three symbols for illustration, you don’t need to manually monitor comparison charts when using this indicator, the SMT divergence will be plotted automatically as soon as it occurs
Consecutive Candle SMT (CC SMT)
Previous Candle Reference: Uses the previous candle's high/low from the selected timeframe
Real-Time Comparison: Monitors if current price breaks these levels across all symbols
Instant Detection: Triggers SMT immediately when divergence occurs
Dynamic Updates: Lines and labels update in real-time as new extremes form and are automatically removed if invalidated
Example:
Here I configured CC SMT Timeframe 1 to monitor the previous 4-hour candle’s high/low. On this NQ chart with ES as a comparison symbol, ES broke above the prior 4-hour high at 14:00 New York time, while NQ did not, showing relative weakness creating a bearish CC SMT divergence
This chart is just an illustration. The indicator will automatically plot SMT divergences on your main chart, regardless of the timeframe you’re viewing
How To Use:
This indicator is not a buy/sell signal on its own. Instead, it is designed to highlight Time-Based SMT divergences so you can combine them with your existing trading strategy or model. It should be used as an extra layer of confluence, helping you confirm trade ideas.
Select your comparison symbols
For example:
Futures: NQ vs ES/YM
Forex: EURUSD vs GBPUSD/DXY(inversely)
Crypto: BTC vs ETH
Commodities: Gold vs Silver
Choose which sessions or candle timeframes you want the indicator to monitor
Watch for divergences the indicator plots when one symbol breaks a high/low while the other does not
Use these divergences as confluence, alongside your own strategy and risk management rules
Key Features:
Multiple Comparison Symbols
Symbol 1 & Symbol 2: Compare your main chart against up to 2 correlated instruments
Symbol Inversion: Perfect for inversely correlated pairs (e.g., EURUSD vs DXY)
Session-Based SMT Tracking
Monitors 7 fully customizable trading sessions with the default being:
London Session (2:00-5:00 NY time)
NY AM Session (9:30-12:00 NY time)
Lunch Session (12:00-13:00 NY time)
NY PM Session (13:00-16:00 NY time)
Asia Session (20:00-00:00 NY time)
Custom Session 6 (if you want to add an extra session)
Daily Session (18:00-18:00 NY time)
Fully customizable session times and names
Automatically detects when the main symbol breaks a session high/low while comparison symbols don't (and vice versa)
Consecutive Candle SMT (CC SMT)
Monitors 3 customizable timeframes
Tracking of divergences based on specific timeframe candles (15min, 60min, 4 hour, weekly, etc.)
Identifies when the current price breaks the previous candle's high/low differently than comparison symbols
Maintains history of past SMTs (configurable)
Timeframe 3 supports custom time shifts for non-standard candle boundaries
Example: 90min timeframe with a +60 shift changes the candle range from:
00:00-01:30, 01:30-03:00 etc
to:
01:00-02:30, 02:30-04:00 etc
Visual Customization
Line Styles: Customize the line styles for different symbols
Colors: Unique color schemes for instant session identification
Adjustable Offsets: Fine-tune label positions with multiplier settings
Show/Hide Controls: Complete control over visual elements
Custom Labels: Customize the SMT labels for highs and lows
Information Panel
Active SMT Conditions: Live tracking of all current divergences
Session Names: Clear identification of which session created the SMT
Symbol Information: Shows which comparison symbol is diverging
Timestamps: Optional time display showing when SMT was first detected
Flexible Positioning: 8 different panel positions
Smart Display Modes: Options to hide inactive sessions/timeframes
Alert System
Configurable alerts for specific sessions or timeframes
Get notified when new divergences appear instantly
Clear, informative alert descriptions
How To Setup Alerts:
Enable the "Enable Alerts" in the settings
Choose which sessions/timeframes to receive alerts for by choosing it in the setting below
(If you select "All Sessions" you will only be alerted for all the sessions you have enabled in the indicator settings)
Create an alert (ALT+A shortcut) or click the the 3 dots on the indicator "Add alert on Session SMT "
- Condition = Session SMT
- Function = Any alert() function call
- Alert name (Message) = Anything you prefer (e.g. SMT Alert)
If you want to create another alert for different settings, first input the new settings in the indicator, then create a new alert.
Note: Previous alerts will continue to notify you based on the settings they were originally set for, even if you change the indicator setting.
How This Helps Your Trading:
This tool automates the heavy lifting of tracking divergences across multiple markets and sessions, continuously monitoring highs and lows in real time and plotting only the most meaningful SMT signals so you can focus on execution, not chart-watching.
SmartWave ProA SmartWave Pro egy prémium kereskedési indikátor, amely a legfejlettebb piaci elemzési módszereket ötvözi egyetlen rendszerben. A jelzéseket a Smart Money Concepts (SMC), ICT (Inner Circle Trader), Pivot zónák, Elliott-hullám elmélet, Engulfing gyertyák, valamint a belső trend- és volatilitásszűrés kombinációja adja.

ICT Confirmed FVG Indicator ICT FVG Indicator (Confirmed by Swings)
Summary
This indicator is designed to identify high-probability Fair Value Gaps (FVGs) by confirming them with market structure. It filters out random imbalances and only highlights the FVGs that are created at the same time as a confirmed ICT Swing High or Swing Low.
The core principle is to connect price imbalances directly to significant shifts in market structure, providing a cleaner and more powerful signal.
What It Does
Identifies Swing Points: Automatically detects and draws confirmed swing highs (resistance) and swing lows (support) on your chart based on the settings you choose.
Finds Fair Value Gaps: It scans the chart for the classic 3-candle FVG pattern (also known as a BISI or SIBI).
Confirms FVGs with Swings: This is the most important feature. The indicator will only draw an FVG box if one of the three candles that created the FVG is also a confirmed swing point. This ensures you are only seeing imbalances that are directly related to a break in market structure.
Invalidates Old FVGs: To keep the chart clean, the indicator will automatically remove an FVG box after the price has fully passed through it a certain number of times (customizable in the settings).
Settings Explained
ICT Swings Settings
Left/Right Strength: Controls the sensitivity of the swing detection. Higher numbers require a more significant, obvious swing point to be confirmed. Lower numbers will identify more minor swings.
Max Swing Lines: Sets the maximum number of swing high and swing low lines to display on the chart at one time.
Swing High/Low Color: Customize the color of the swing point lines.
FVG Settings
Show Bullish/Bearish FVG: Use these checkboxes to turn the bullish (green) or bearish (red) FVG boxes on or off.
Bullish/Bearish FVG Color: Customize the color of the FVG boxes.
FVG Invalidation Threshold: This sets how many times the price can fully close on the other side of an FVG before the box is automatically removed.
Max Active FVGs to Show: Sets the maximum number of FVG boxes to keep on the chart to prevent clutter.
Key Features
High-Probability Signals: Filters out noise by focusing only on FVGs that are confirmed by a shift in market structure.
Clean Visuals: Automatically draws and removes swing lines and FVG boxes to keep your chart uncluttered.
Fully Customizable: Adjust the sensitivity of the swing detection and the appearance of the FVGs to fit your trading style.
Pure ICT Concepts: Built strictly on the principles of Inner Circle Trader for a method-consistent analysis.

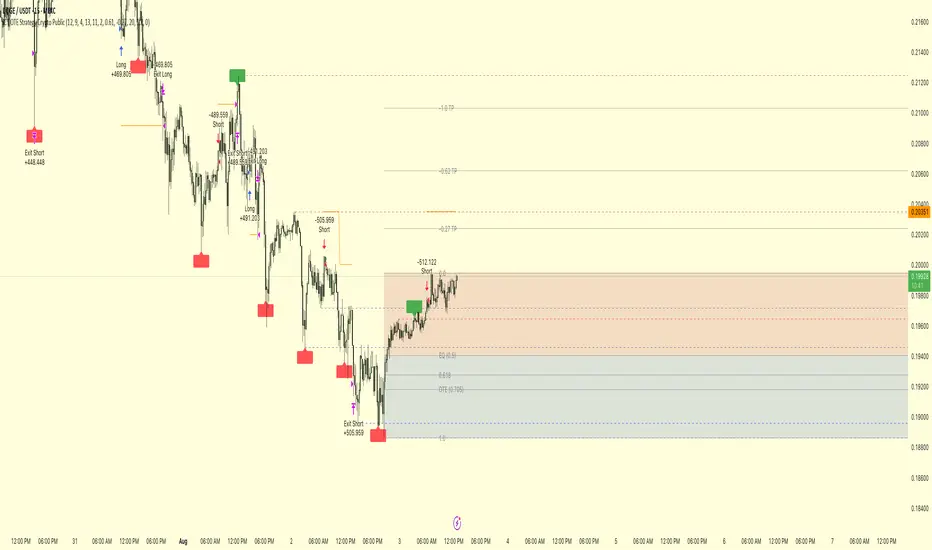
ICT OTE Strategy Crypto PublicICT OTE Strategy Crypto Public
This strategy automates a classic ICT (Inner Circle Trader) setup specifically tailored for the high-volatility nature of cryptocurrency markets. It aims to enter a trade on a retracement after a confirmed Break of Structure (BOS), using a dual-swing detection method to validate the market's direction before looking for an entry.
The entire process is automated, from identifying the market structure to managing the trade with advanced risk management options. This version uses a percentage of equity for its order sizing, which is ideal for crypto trading.
How It Works
Dual Swing Detection: The strategy uses two different sets of swing strengths to analyze market structure for higher accuracy:
Entry Swings: Weaker, more sensitive swings used to define the immediate dealing range for a potential trade.
Validator Swings: Stronger, more significant swings used to confirm a true Break of Structure.
Break of Structure (BOS): A trade setup is only considered valid after a strong "Validator" swing breaks through a previous "Entry" swing. This confirms the market's intended direction and filters out weak or false moves.
Identify Retracement Leg: After a confirmed BOS, the strategy identifies the most recent "Entry Swing" price leg that led to the break.
Auto-Fibonacci: It automatically draws a Fibonacci retracement over this leg, from the start of the move (1.0) to the end (0.0).
Trade Entry: A limit order is placed at a user-defined Fibonacci level (defaulting to 0.618), anticipating a price pullback into a discount or premium array.
After a bullish BOS, it looks to BUY the retracement.
After a bearish BOS, it looks to SELL the retracement.
Risk Management:
Stop Loss is placed at the start of the leg (the 1.0 level).
Take Profit is placed at a user-defined level (defaulting to the 0.0 level, with extension options).
Includes an option to move the stop loss to break-even after the trade has moved a certain distance in profit.
How to Use
Asset Selection: This strategy is designed for cryptocurrency markets. Its use of percentage-based order sizing is not suitable for tick-based markets like futures.
Swing Settings: Adjust the "Entry Swing" and "Validator" strengths to match the volatility and timeframe of the asset you are trading. Higher numbers will result in fewer, more significant setups.
Backtest: Use the Strategy Tester to optimize the "FIB Entry Level," "Take Profit Level," and "Swing Sensitivity" to find the best settings for your specific market and timeframe.
ICT OTE Strategy Futures PublicICT OTE Strategy
This strategy automates a classic ICT (Inner Circle Trader) setup that aims to enter a trade on a retracement after a confirmed Break of Structure (BOS). It is designed to identify high-probability setups by waiting for the market to show its hand before looking for an entry within a "discount" or "premium" array.
The entire process is automated, from identifying the market structure to managing the trade with a dynamic stop loss.
How It Works
Break of Structure (BOS): The strategy first waits for a strong, validated swing to break a previous, weaker swing high or low. This confirms the market's intended direction.
Identify Retracement Leg: After a BOS, the strategy identifies the most recent price leg that led to the break.
Auto-Fibonacci: It automatically draws a Fibonacci retracement over this leg, from the start of the move (1.0) to the end (0.0).
Trade Entry: A limit order is placed at a user-defined Fibonacci level (defaulting to 0.508), anticipating a price pullback.
After a bullish BOS, it looks to BUY the retracement.
After a bearish BOS, it looks to SELL the retracement.
Risk Management:
Stop Loss is placed at the start of the leg (the 1.0 level).
Take Profit is placed at a user-defined level (defaulting to the 0.0 level).
Includes an option to move the stop loss to break-even after the trade has moved a certain distance in profit.
How to Use
Swing Settings: Adjust the "Entry Swing" and "Validator" strengths to match the volatility and timeframe of the asset you are trading. Higher numbers will result in fewer, more significant setups.
Session Filter: Use the "Trading Sessions" filter to align the strategy with ICT's "killzone" concept, ensuring trades are only taken during high-volume periods like the New York session.
Backtest: Use the Strategy Tester to optimize the "FIB Entry Level," "Take Profit Level," and "Min Trade Range" to find the best settings for your specific market and timeframe.

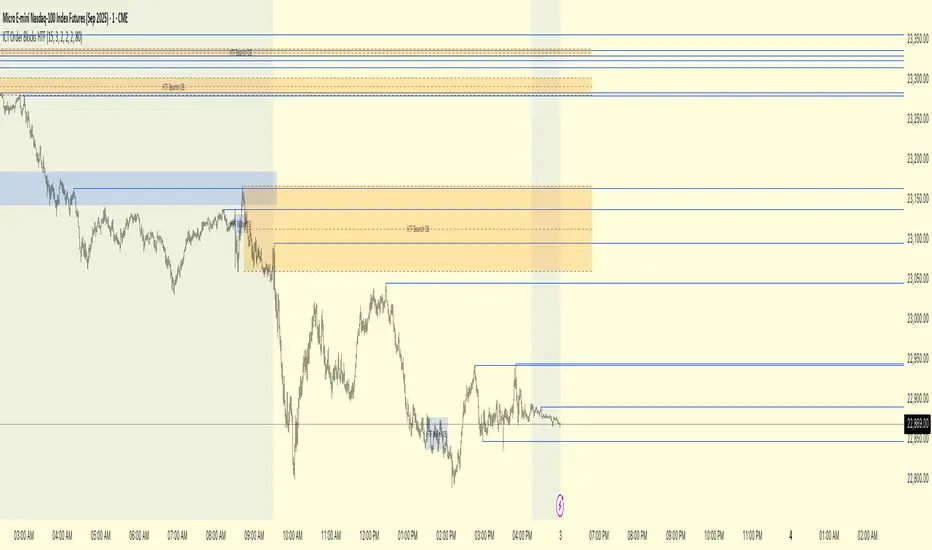
ICT Order Blocks HTFICT Order Blocks HTF (with Parent Swing Confirmation)
This indicator is a powerful tool designed to identify high-probability Higher-Timeframe (HTF) Order Blocks by confirming them with significant liquidity sweeps on your trading chart. It combines two core ICT (Inner Circle Trader) concepts to filter out noise and highlight only the most sensitive areas.
The Core Concept: A High-Probability Model
The most powerful trading setups often occur when a significant event on a lower timeframe happens at a key area on a higher timeframe. This indicator automates that analysis by looking for a specific confluence:
A Liquidity Sweep (LTF): First, it identifies a "Parent Swing" on your current chart. This is a significant swing high (BSL - Buy Side Liquidity) or swing low (SSL - Sell Side Liquidity) that has been validated by a market structure shift. These are the key liquidity pools the market targets.
An Order Block (HTF): Separately, it looks at a higher timeframe of your choice (e.g., 15m, 1H) to find institutional order blocks—the last up or down candle before a strong move.
The Confluence: The magic happens here. The indicator will only draw an HTF order block on your chart if it forms at the exact moment the price is interacting with one of the BSL or SSL liquidity pools from your current chart.
This dual confirmation provides a refined, high-probability signal, indicating that a major liquidity event is fueling a reaction from a significant HTF level.
What the Indicator Does
Identifies Parent Swings: In the background, it constantly tracks and identifies BSL (red lines) and SSL (green lines) on your chart.
Finds HTF Order Blocks: It looks for bullish (last down-candle) and bearish (last up-candle) order blocks on the higher timeframe you select.
Draws Confirmed Zones: It draws a Bullish OB (Blue Box) only when an HTF bullish order block forms at an SSL level. It draws a Bearish OB (Orange Box) only when an HTF bearish order block forms at a BSL level.
Marks Key Levels: Each order block is automatically drawn with dashed lines marking its high, low, and midpoint (50% level) for precise entry and risk management.
Real-Time Invalidation: The order blocks extend into the future and are tracked in real-time. If price closes through a block a specified number of times, the zone is considered invalid and will be dimmed, keeping your chart clean.
How to Use This Indicator
The primary use for this indicator is to identify high-probability entry zones.
When a Bullish Order Block (Blue) appears, it signals a potential area of demand where you might look for long entries.
When a Bearish Order Block (Orange) appears, it signals a potential area of supply where you might look for short entries.
The internal lines (high, low, midpoint) can be used for more precise entries or for setting stop-loss levels.
Settings
Higher Timeframe for Order Blocks: Choose the HTF you want the indicator to analyze for order blocks (e.g., 15m, 1H, 4H).
OB Invalidation Threshold: Set how many times price must close fully through an order block before it is considered invalid.
Parent Swing Settings: You can adjust the lookback periods and invalidation threshold for the BSL/SSL detection to match your trading style. A larger lookback will find more significant liquidity pools.
Disclaimer: This indicator is a tool to assist in technical analysis. It is not a standalone trading system and does not provide financial advice. Always use proper risk management and combine this tool with your own analysis and trading strategy.
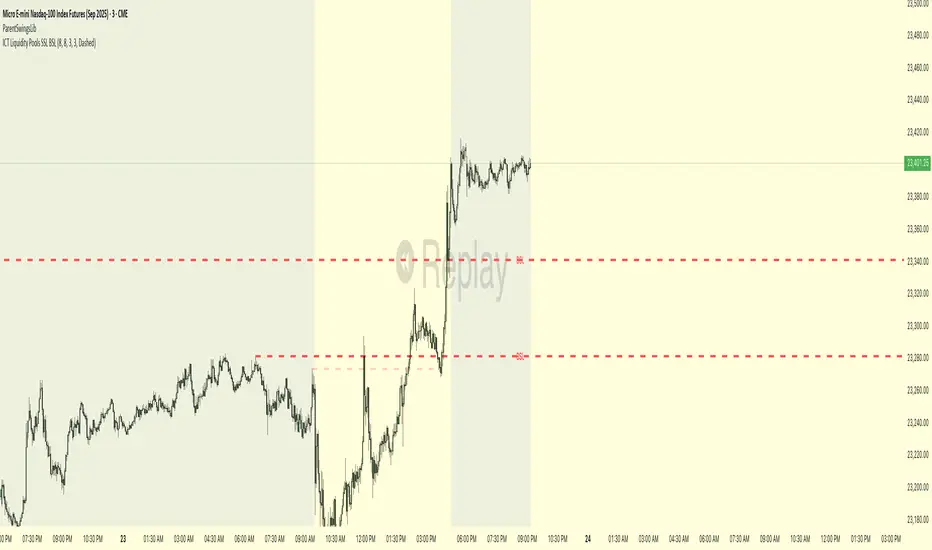
ICT Liquidity Pools SSL BSLParent Swings - ICT Liquidity Pools (BSL & SSL)
This indicator is designed to cut through the noise of the market and identify truly significant swing points. Instead of marking every minor high and low, it uses the powerful logic of ICT (Inner Circle Trader) breaker patterns to validate and draw only the "Parent Swings" that matter. These are the key liquidity pools that often act as the market's next target.
The Concept: Price Moves from Pool to Pool
A core concept taught by ICT is that price doesn't move randomly; it moves with purpose. The market is engineered to move from one pool of liquidity to the next.
Buy Side Liquidity (BSL): This is a pool of stop-loss orders resting just above a significant swing high. The market is often drawn upwards to "sweep" this liquidity.
Sell Side Liquidity (SSL): This is a pool of stop-loss orders resting just below a significant swing low. The market is often drawn downwards to sweep this liquidity.
This indicator identifies these key BSL and SSL levels after they have been confirmed by a shift in market structure, giving you a clear map of potential targets.
How It Works
The indicator doesn't just look for any swing high or low. It waits for a specific sequence of events to confirm that a swing is a "Parent Swing" and a valid liquidity pool:
Liquidity Sweep: First, it looks for a classic liquidity raid. For a significant high (BSL), it needs to see a swing high get taken out by a higher high. For a significant low (SSL), it needs to see a swing low get taken out by a lower low.
Market Structure Shift (MSS): After the liquidity sweep, the indicator waits for confirmation that the market's intention has changed. This happens when price breaks aggressively in the opposite direction, creating a breaker block pattern.
Confirmation: Only when both the liquidity sweep and the market structure shift are confirmed does the indicator draw the line, marking the swing as a valid BSL or SSL level.
How to Use This Indicator
The primary use for this indicator is to identify targets. Once a BSL (red line) or SSL (green line) is established, you can anticipate that the market will eventually make a run for that level.
If you are in a long position, the next BSL line above you can serve as a logical take-profit target.
If you are in a short position, the next SSL line below you can serve as a logical take-profit target.
The labels (BSL/SSL) will always stay with the current price action for active levels, making it easy to see your targets at a glance.
Settings
Pivot Lookback: Controls the sensitivity of the swing detection. A higher number will find larger, more significant liquidity pools.
Invalidation Threshold (Crossings): This is a key feature. It sets how many times the price must cross through a liquidity level before it's considered "used up" or invalidated. Once invalidated, the line will dim and the label will disappear, keeping your chart clean.
Disclaimer: This is a tool for technical analysis and should not be considered financial advice. Always use proper risk management and integrate this indicator with your own trading strategy.
ICT OTE StrategyStrategy Overview
This strategy is designed to automate a specific trading setup based on the concepts of Inner Circle Trader (ICT). Its primary goal is to identify significant market structure swings, frame a Fibonacci retracement over the most recent price leg, and execute a trade when the price pulls back to a key user-defined level. It is a counter-trend entry strategy, meaning it looks to enter a trade during a pullback within an established trend.
How It Works: Step-by-Step
1. Swing Detection:
The strategy first identifies significant swing highs and swing lows.
A swing high is confirmed only if it's higher than a specific number of bars to its left and right (defined by "Left Strength" and "Right Strength" in the settings).
The same logic applies to swing lows, which must be lower than the bars around them. This filtering ensures only structurally important turning points are considered.
2. Defining the Trading Range:
Once a new swing is confirmed, the strategy defines the most recent dealing range.
If a new swing high forms, the range is drawn from the previous swing low up to this new high. This is considered a bullish leg.
If a new swing low forms, the range is drawn from the previous swing high down to this new low. This is considered a bearish leg.
3. Fibonacci Retracement & Trade Setup:
An automatic Fibonacci retracement tool is drawn over this newly defined dealing range. The 0.0 level is placed at the end of the move, and the 1.0 level is at the beginning.
The strategy then prepares to enter a trade based on this range.
4. Trade Execution:
Entry: A limit order is placed at a specific Fibonacci level within the range, waiting for the price to retrace. The default entry is the 0.618 level, but this can be changed in the settings.
For a bullish leg, it places a LONG (Buy) order, anticipating that the price will bounce from the retracement level.
For a bearish leg, it places a SHORT (Sell) order, anticipating that the price will be rejected from the retracement level.
Stop Loss: The Stop Loss is automatically placed at the 1.0 level of the Fibonacci range. This is the point where the original trade idea is invalidated.
Take Profit: The Take Profit is automatically placed at the 0.0 level of the Fibonacci range. This is the target at the end of the price leg.
Key Features & Customization
Automated Trade Logic: The entire process, from identifying the setup to placing the entry, stop loss, and take profit, is fully automated.
Visual Aid: The script draws the swing points and the Fibonacci retracement on the chart, so you can visually confirm the setups the strategy is taking.
Customizable Entry: You can change the "Entry Level" in the settings to test different Fibonacci levels, such as the Optimal Trade Entry (OTE) at 0.705.
Toggle Visuals: You can turn the Fibonacci drawing on or off to keep your chart clean while still allowing the strategy to run in the background.

GTrader-ICT All In One-Comumnity VersionMeet the **GTrader-ICT All In One **, a comprehensive toolkit designed to integrate key Inner Circle Trader (ICT) concepts directly onto your chart. This powerful overlay indicator consolidates multiple essential tools, streamlining your technical analysis and helping you identify key temporal and price-based events.
📚 References & Inspiration
This indicator stands on the shoulders of giants. With the help of **tradeforopp** and **LuxAlgo**. The concepts and some implementation details were referenced from the following excellent, publicly available scripts:
ICT Killzones: The session drawing and pivot logic is adapted from tradeforopp
ICT Macros: The macro detection and plotting functionality is inspired by the work of Lux Algo , particularly their widely-used indicators covering ICT concepts.
🎯 Core Features
* **ICT Killzones:** Visualize critical trading sessions with customizable boxes. You can easily toggle and style the **Asia**, **London**, and **New York (AM, Lunch, PM)** sessions to focus on the liquidity and volatility that matter most to your strategy.
* Fully customizable session times and colors.
* Timezone support to align sessions with your local or preferred trading time (defaults to `America/New_York`).
* **ICT Macros:** Automatically identify and plot specific, short-duration time windows where institutional algorithms are known to be active (e.g., `09:50-10:10`, `14:50-15:10`, etc.).
* Plots the high/low range of the macro, providing clear levels of interest.
* Utilizes 1-minute data for precision, even when viewing on 3-minute or 5-minute charts.
📚 Optimization over the other original indicators
We add the custom input for macros session, users just need to input the from/to hour: minute format, and they will be converted into session objects in pinescript
The macro draws function is optimized, removing redundant draws, leading to better performance
Add "Distance from Macro Line to Chart" option
Add "Session Drawings Limit" for better performance
⚠️ Notes on TradingView Warnings
You may encounter some warnings from TradingView when using this script. These are generally expected due to the script's advanced, event-driven nature:
1. **Function Call Consistency:** The function 'box.new' should be called on each calculation for consistency, which may appear. This happens because drawing elements (like session boxes) are intentionally created only on the *first bar* of a new session, not on every single bar. This is a necessary design choice for performance and to prevent duplicate drawings.
2. **Potential for Repainting/Slow Load:** The **Macro** feature uses the `request.security_lower_tf()` function to get accurate 1-minute data. This can trigger warnings about performance or slow loading times. This is a known trade-off for achieving the precision required for the feature.

Multi-Timeframe PivotDescription:
This script provides an advanced tool for multi-timeframe pivot point
analysis. It identifies swing points based on a candle's relationship to
its neighbors. The default strength settings of 1 align with the Inner
Circle Trader (ICT) concept of market structure.
The ICT concept defines a swing point based on a simple 3-candle pattern:
- A swing high is a candle where the candles to the immediate left and right
both have lower highs.
- A swing low is a candle where the candles to the immediate left and right
both have higher lows.
A key feature is its ability to accurately calculate and translate pivot
points from up to five higher timeframes (HTFs) and display them
precisely on a lower timeframe (LTF) chart.
NOTE: This indicator is designed to show HTF data on an LTF chart.
If you select a timeframe in the settings that is lower than your
current chart's timeframe, it will show pivots for the chart's
timeframe instead.
Core Features:
- Up to five independent higher timeframes.
- Per-timeframe customization for pivot strength (left/right bars) and color.
- Optional "Watchlines" that project the price of each pivot forward,
complete with a text label identifying the timeframe.
- An optional "Alignment Model" that colors the background when price is
aligned across all active timeframes (requires at least 2 TFs to be enabled).
Default State:
For a clean initial application, the Watchlines and Alignment Model features
are disabled by default but can be enabled in the settings.

Rapid HTF Price Action DashboardRapid HTF Price Action Dashboard V2.0
Overview
Stop the constant switching between timeframes. The Rapid HTF Price Action Dashboard is an all-in-one analysis suite designed to give you a crystal-clear view of the market's true intent by projecting critical higher-timeframe (HTF) data directly onto your trading chart.
This tool is more than just a pattern indicator; it's a complete dashboard that provides institutional-grade insights into price action. It helps you anticipate market moves by showing you where liquidity lies and how the bigger players are positioning themselves, all from the comfort of your lower-timeframe chart.
Key Features
Multi-Timeframe Dashboard: A clean, intuitive panel on the right of your chart displays the last two closed higher-timeframe candles (Candle A & B) and the live, developing one (Candle C).
Projected HTF Levels: Automatically draws and projects the previous HTF candle's high and low across your chart, acting as critical dynamic support and resistance levels.
Advanced Pattern Recognition: Identifies seven high-conviction candlestick patterns based on our proprietary filtering system, designed to eliminate noise and pinpoint only the most potent signals.
The Logic: Why Our Signals Are More Accurate
This indicator goes far beyond textbook definitions. We don't just look for shapes; we look for the story behind the price action. Each pattern is filtered through a rigorous set of conditions to ensure it represents true market conviction.
Hammers & Inverted Hammers: The Liquidity Grab
Classic Hammer/IH patterns are often misleading. Ours are different. We identify them as true liquidity grab signals, a core concept used in ICT (Inner Circle Trader) methodologies.
A Hammer (H) is only valid if its low wick has pierced below the low of the previous candle (low < low ). This signifies a "stop hunt" where liquidity was absorbed below a key level before buyers aggressively pushed the price up.
An Inverted Hammer (IH) is only valid if its high wick has pierced above the high of the previous candle (high > high ). This shows liquidity was taken above a prior high before sellers took control and suppressed the price.
Harami: Filtering for Conviction
A classic Harami (an inside bar) can often just be a weak doji, signaling indecision. We filter this noise out.
Our Harami signal (BeH, BuH) requires the inside candle to have a meaningful body (defaulting to 30% of its own range, but fully customizable).
Furthermore, we have enhanced the logic to ensure the body of the inside candle is strictly contained within the body of the previous candle, making it a more precise and reliable signal of consolidation before a potential expansion.
Power Engulfing: A Signal of Overwhelming Force
We don't flag just any engulfing candle. We look for true displacement and momentum.
Our Power Engulfing pattern (BE, BuE) requires the body of the current candle to completely engulf the body of the previous candle.
Crucially, it must also close decisively beyond the entire range (including the wick) of the previous candle. A Bullish Engulfing must close above the previous high, and a Bearish Engulfing must close below the previous low. This confirms overwhelming force has entered the market and a reversal is highly probable.
How to Use the Dashboard
Set Your Reference Timeframe (refTF): Choose the higher timeframe you want to analyze (e.g., "240" for 4-Hour).
Identify the Narrative: Use the projected High/Low lines as your key support and resistance zones. A primary strategy is to wait for price to interact with these levels.
Anticipate the Draw on Liquidity: Watch as price approaches the previous HTF high or low. The dashboard helps you predict the market's next move. For example, if price is trading below the previous HTF low, you can anticipate a potential sweep of that level.
Confirm with a Signal: When a signal like a Hammer (H) appears on the dashboard after sweeping the previous low, it provides high-conviction confirmation that liquidity has been taken and price is ready to reverse.

CandelaCharts - 1st Presented FVG 📝 Overview
The ICT 1st Presented Fair Value Gap refers to the first FVG that forms after the market opens at 9:30 AM New York local time. In a sideways market, it often acts as a catalyst for price movement in either direction, while in trending conditions, it tends to support and reinforce the prevailing trend.
This indicator automatically identifies the first Fair Value Gap (FVG) that forms after the New York session opens at 9:30 AM local time. Based on concepts taught by Inner Circle Trader (ICT), the 1st Presented FVG is a key institutional price imbalance that often sets the tone for the trading day.
📦 Features
Customize FVG session time (e.g. 09:30 – 10:00)
Show/hide session dividers
FVG visibility filter (e.g. Bullish / Bearish)
Advanced styling
Hide overlapping FVGs
Extend FVGs
Opening prices
⚙️ Settings
Show: Controls whether all, bullish only, or bearish only FVGs are displayed on the chart.
Session: Sets a specific time window (e.g. 09:30–10:00) to filter which FVGs are displayed.
Dividers: Toggles vertical session divider on the chart for visual separation.
Midline: Displays a midpoint (CE) line through the FVG; customizable color and thickness.
Border: Adds a border around each FVG zone.
Labels: Toggles label display for FVGs.
Hide Overlap: Hides overlapping FVGs to reduce visual clutter.
Extend: Extends each FVG forward in time.
Alerts: Enables alerts when price interacts with an FVG zone.
Opening Prices: Allows defining custom time-based levels (e.g. 00:00–00:01 and 18:00–18:01) with color and style options.
⚡️ Showcase
Simple
Labels
Bordered
Consequent Encroachment
Extended
Dividers
📒 Usage
How to Use the ICT 1st Presented Fair Value Gap in Trading
To apply the ICT 1st Presented Fair Value Gap (FVG), identify the first fair value gap of the day and extend it across the chart until 3:45 PM New York time.
You’ll often notice that some of the best trade setups form around this level. It tends to act as a key reference point for price action during the day—especially on trending days, where price frequently returns to this gap before continuing in its direction.
This level can also serve as an inverse fair value gap, offering opportunities in the opposite direction under the right conditions.
How to Disqualify the 1st Presented Fair Value Gap?
When the first fair value gap forms after 9:30 AM New York time, check the candles that came just before it.
If the candlestick that creates the FVG doesn’t break above or below the range of those previous candles, then it’s not a true inefficiency. In that case, it’s considered a disqualified 1st Presented Fair Value Gap—meaning it shouldn’t be used as a key reference level.
Refer to the example below to see what this looks like on the chart.
🚨 Alerts
This script provides alert options for all signals.
Bearish Signal
A bearish signal is triggered when the bearish 1st P.FVG is formed in interval 09:30 - 10:00.
Bullish Signal
A bullish signal is triggered when the bullish 1st P.FVG is formed in interval 09:30 - 10:00.
⚠️ Disclaimer
Trading involves significant risk, and many participants may incur losses. The content on this site is not intended as financial advice and should not be interpreted as such. Decisions to buy, sell, hold, or trade securities, commodities, or other financial instruments carry inherent risks and are best made with guidance from qualified financial professionals. Past performance is not indicative of future results.

ICT Opening Range Projections (tristanlee85)ICT Opening Range Projections
This indicator visualizes key price levels based on ICT's (Inner Circle Trader) "Opening Range" concept. This 30-minute time interval establishes price levels that the algorithm will refer to throughout the session. The indicator displays these levels, including standard deviation projections, internal subdivisions (quadrants), and the opening price.
🟪 What It Does
The Opening Range is a crucial 30-minute window where market algorithms establish significant price levels. ICT theory suggests this range forms the basis for daily price movement.
This script helps you:
Mark the high, low, and opening price of each session.
Divide the range into quadrants (premium, discount, and midpoint/Consequent Encroachment).
Project potential price targets beyond the range using configurable standard deviation multiples .
🟪 How to Use It
This tool aids in time-based technical analysis rooted in ICT's Opening Range model, helping you observe price interaction with algorithmic levels.
Example uses include:
Identifying early structural boundaries.
Observing price behavior within premium/discount zones.
Visualizing initial displacement from the range to anticipate future moves.
Comparing price reactions at projected standard deviation levels.
Aligning price action with significant times like London or NY Open.
Note: This indicator provides a visual framework; it does not offer trade signals or interpretations.
🟪 Key Information
Time Zone: New York time (ET) is required on your chart.
Sessions: Supports multiple sessions, including NY midnight, NY AM, NY PM, and three custom timeframes.
Time Interval: Supports multi-timeframe up to 15 minutes. Best used on a 1-minute chart for accuracy.
🟪 Session Options
The Opening Range interval is configurable for up to 6 sessions:
Pre-defined ICT Sessions:
NY Midnight: 12:00 AM – 12:30 AM ET
NY AM: 9:30 AM – 10:00 AM ET
NY PM: 1:30 PM – 2:00 PM ET
Custom Sessions:
Three user-defined start/end time pairs.
This example shows a custom session from 03:30 - 04:00:
🟪 Understanding the Levels
The Opening Price is the open of the first 1-minute candle within the chosen session.
At session close, the Opening Range is calculated using its High and Low . An optional swing-based mode uses swing highs/lows for range boundaries.
The range is divided into quadrants by its midpoint ( Consequent Encroachment or CE):
Upper Quadrant: CE to high (premium).
Lower Quadrant: Low to CE (discount).
These subdivisions help visualize internal range dynamics, where price often reacts during algorithmic delivery.
🟪 Working with Ranges
By default, the range is determined by the highest high and lowest low of the 30-minute session:
A range can also be determined by the highest/lowest swing points:
Quadrants outline the premium and discount of a range that price will reference:
Small ranges still follow the same algorithmic logic, but may be deemed insignificant for one's trading. These can be filtered in the settings by specifying a minimum ticks limit. In this example, the range is 42 ticks (10.5 points) but the indicator is configured for 80 ticks (20 points). We can select which levels will plot if the range is below the limit. Here, only the 00:00 opening price is plotted:
You may opt to include the range high/low, quadrants, and projections as well. This will plot a red (configurable) range bracket to indicate it is below the limit while plotting the levels:
🟪 Price Projections
Projections extend beyond the Opening Range using standard deviations, framing the market beyond the initial session and identifying potential targets. You define the standard deviation multiples (e.g., 1.0, 1.5, 2.0).
Both positive and negative extensions are displayed, symmetrically projected from the range's high and low.
The Dynamic Levels option plots only the next projection level once price crosses the previous extreme. For example, only the 0.5 STDEV level plots until price reaches it, then the 1.0 level appears, and so on. This continues up to your defined maximum projections, or indefinitely if standard deviations are set to 0.
This example shows dynamic levels for a total of 6 sessions, only 1 of which meet a configured minimum limit of 50 ticks:
Small ranges followed by significant displacement are impacted the most with the number of levels plotted. You may hide projections when configuring the minimum ticks.
A fixed standard deviation will plot levels in both directions, regardless of the price range. Here, we plot up to 3.0 which hiding projections for small ranges:
🟪 Legal Disclaimer
This indicator is provided for informational and educational purposes only. It is not financial advice, and should not be construed as a recommendation to buy or sell any financial instrument. Trading involves substantial risk, and you could lose a significant amount of money. Past performance is not indicative of future results. Always consult with a qualified financial professional before making any trading or investment decisions. The creators and distributors of this indicator assume no responsibility for your trading outcomes.

SMC ICT – Simplified Daily Trend & Reversal AnalyzerThis Pine Script provides a simplified approach to analyzing daily trends and potential reversals using concepts inspired by Smart Money Concepts (SMC) and ICT (Inner Circle Trader).
What It Does:
• Detects daily uptrend and downtrend conditions by comparing the current daily high/low to the previous day’s values.
• Highlights potential bullish or bearish reversal zones when price behavior suggests a shift in sentiment.
• Automatically draws dashed lines for the previous day's high and low.
• Labels these high/low levels for quick visual reference.
How to Use:
Apply this indicator to any timeframe chart. Use the plotted trend markers to assess daily direction and potential reversal signals. The dashed lines (previous high/low) can be used as reference points for liquidity zones or break/retest entries.
User Interface:
The indicator displays labels and shapes in English. This script is intended for educational and trading workflow enhancement purposes.
Note:
This is an open-source tool designed for clarity and basic SMC/ICT application. It is best used in combination with other confluences like FVGs, order blocks, and liquidity sweeps.

ICT-Elliott Hybrid Oscillator네이버 프리미엄 콘텐츠 > 재테크 사관학교 검색
This indicator uses Elliott Wave Theory and ICT (Inner Circle Trader) concepts to help easily and accurately predict when asset prices like cryptocurrencies or stocks will rise or fall.
📌 Easy Explanation of Terms
✅ What is Elliott Wave?
A theory stating that price movements follow a specific pattern (5 upward waves + 3 downward waves) repeatedly. Simply put, it's about repetitive cycles of rises and falls creating overall trends.
✅ What is ICT Theory?
A strategy that identifies optimal trading times by observing critical price areas traded by institutional investors (Order Blocks), imbalances in price (Fair Value Gaps - FVG), and major turning points (Break of Structure - BOS).
📈 Signals Provided by the Indicator
🔹 ① Pivot Highs & Lows
Red ▼: Short-term high (increased likelihood of price falling)
Green ▲: Short-term low (increased likelihood of price rising)
🔹 ② Fair Value Gap (FVG)
Green highlighted area: Zone where price is likely to rise again
Red highlighted area: Zone where price is likely to fall again
🔹 ③ Break of Structure (BOS)
Blue "BOS Up": Indicates a shift to an upward trend
Orange "BOS Down": Indicates a shift to a downward trend
⏳ Recommended Timeframe Combinations
| Major Trend (Basic Analysis) | Entry Point (Detailed Analysis) | Short-term Timing (Precision Analysis) |
| ---------------------------- | ------------------------------- | -------------------------------------- |
| 4-hour | 1-hour | 15-minute |
Use the 4-hour timeframe to gauge overall trends,
the 1-hour timeframe to pinpoint exact entry and exit points,
and the 15-minute timeframe for precise timing.
Include Source
🕯 Recommended Candle Patterns
* Pin Bar (Long wick candle) → Trend reversal signal
* Engulfing Candle (fully covering previous candle) → Strong trend reversal signal
* Hammer & Shooting Star (small body with a long wick) → Bullish or bearish reversal signal
* Doji (balance between buyers and sellers) → High potential for trend reversal

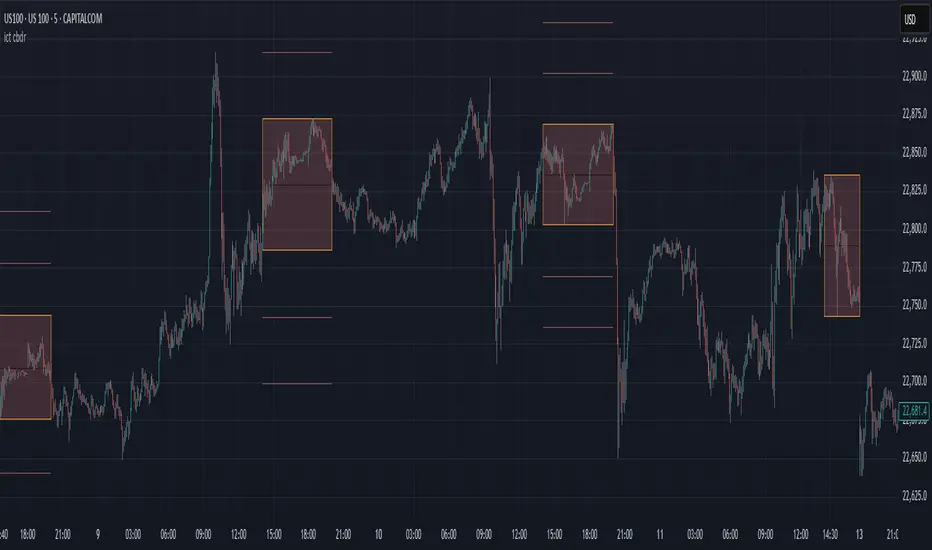
ict cbdr# ICT CBDR - Central Bank Dealers Range
This indicator identifies and displays the Central Bank Dealers Range (CBDR), a concept from Inner Circle Trader (ICT) methodology. The CBDR represents the consolidation period between 2:00 PM and 8:00 PM New York time, during which major financial institutions establish their positions.
## Features
- **Customizable Time Range:** Default setting is the standard 2:00 PM - 8:00 PM NY time, but can be adjusted to any session
- **Timezone Selection:** Choose your preferred timezone while maintaining accurate CBDR tracking
- **Visual Range Box:** Clearly displays the high and low range established during the selected session
- **Equator (EQ) Line:** Shows the 50% mid-point of the range for potential support/resistance
- **Projection Lines:** Automatically projects extensions of the range for potential targets
- **Adjustable Multiplier:** Option for 0.5× or 1× range projections
- **Range Type Selection:** Use price wicks or bodies to establish the range
## How to Use This Indicator
The CBDR forms a consolidation zone that often precedes significant price movements. After this range is established, markets tend to move away from this area with directional bias. Trading strategies commonly involve:
1. **Breakout Trading:** Enter when price breaks above/below the CBDR
2. **Range Trading:** Fade moves from the edges of the range back to the EQ line
3. **EQ Line Support/Resistance:** Use the mid-range as a pivot point
4. **Extension Targets:** Utilize the projection lines as potential take-profit levels
## Settings
- **Show CBDR:** Toggle the visibility of the range box
- **Range Type:** Select whether to use candle wicks or bodies for range calculation
- **Timezone:** Choose your preferred timezone (default is America/New York)
- **Session Time:** Adjust the session time in 24-hour format (default is 1400-2000)
- **EQ Line:** Toggle and customize the equator line
- **Projections:** Toggle and adjust the number and appearance of projection lines
- **Use 0.5 Deviation:** When enabled, uses half-sized projections
- **Hide Above __ Minutes:** Controls on which timeframes the indicator is displayed
## Notes
- The traditional CBDR is specifically the 2:00 PM - 8:00 PM NY time range
- This indicator is most effective on lower timeframes (1-15 minute charts)
- Remember to combine this tool with proper risk management and additional confirmation
- Works best on forex and highly liquid markets
## Disclaimer
This indicator is for informational and educational purposes only. Past performance is not indicative of future results. Always conduct your own analysis and use proper risk management.
Dealing rangeHi all!
This indicator will show you the current dealing range. The concept of dealing range comes from the inner circle trader (ICT) and gives you a range between an established swing high and an established swing low (the length of these pivots can be changed in settings parameter Length and defaults to 5/2 (left/right)). These swing points must have taken out liquidity to be considered "established". The liquidity that must be grabbed by the swing point has to be a pivot of left length of 1 and a right length of 1.
The dealing range that's created should be used in conjunction with market structure. This could be done through scripts (maybe the Market structure script that I published ()) or manually. It's a common approach to look for long opportunities when the trend is bullish and price is currently in the discount zone of the dealing range. If the trend is bearish then short opportunities are presented when the price is currently in the premium zone of the dealing range.
The zones within the dealing range are premium and discount that are split on the 50% level of the dealing range. These zones can be split into 3 zone with a Fair price (also called Fair value ) zone in between premium and discount. This makes the premium zone to be in the upper third of the dealing range, fair price in the middle third and discount in the lower third. This can be enabled in the settings through the Fair price parameter.
Enabled:
You can choose to enable/disable the visualisation of liquidity grabs and the External liquidity available above and below the swing points that created the dealing range.
Enabled:
Disabled:
Enabled on a higher timeframe (will display a box of the liquidity grab price instead of a label):
This dealing range is configurable to be created by a higher timeframe then the visible charts. Use the setting Higher timeframe to change this.
You can force candles to be closed (for liquidity and swing points). Please note that if you use a higher timeframe then the visible charts the candles must be closed on this timeframe.
Lastly you can also change the transparency of liquidity grabs and external liquidity outside of the dealing range. Use the Transparency setting to change this (a lower value will lead to stronger visuals).
If you have any input or suggestions on future features or bugs, don't hesitate to let me know!
Best of trading luck!

London Judas Swing Indicator by PoorTomTradingThis indicator is designed to help people identify and trade the London Judas Swing by Inner Circle Trader (ICT).
UPDATES IN V2:
This is a v2 update with automatic timezone settings, there is no longer any need to adjust the time or offset for DST.
It will now also work on any chart that trades during the Asia and London sessions (20:00 - 05:00 NY Time), including crypto.
It is recommended to use this indicator on the 5 minute timeframe.
INTRODUCTION OF KEY CONCEPTS:
Swing Points are a candle patterns defining highs and lows, these are explained further down in the description in more detail. They are shown on the indicator by arrows above and below candles. They can be removed if you wish by turning their opacity to 0% in settings. Swing points are automatically removed when price trades beyond them (above swing highs, below swing lows).
The Asia Session can be set by the user, but is defined by default as 20:00 - 00:00 NY time. Lines are drawn at the high and low of the Asia Session and the Asian Range is set at midnight.
The London Session is defined as 02:00 - 05:00 NY time.
The user can also include the pre-London session (00:00 - 02:00) for detection of breakouts and Market Structure Breaks (MSBs - explained lower down in the description with examples). This is selected by default.
EXPLANATION OF INDICATOR:
During the London Session, the indicator will wait for a break of either the high or low of the Asian Range.
When this is detected, it will draw a dashed line where the breakout occurred and trigger an alert.
After the break of the Asian Range, the indicator will look for an MSB in the opposite direction, which is when price closes beyond a swing point opposing current price direction. The indicator will draw a line indicating the MSB point and trigger an alert.
Finally, the indicator will also trigger an alert when price returns to this MSB level, which is the most simple Judas Swing entry method.
The Judas swing
Example with chart for Judas Swing short setups -
Price breaks above the Asia High, no candle close is required, the indicator will then wait for price to close a candle below the last swing low.
A swing low is defined as a 3 candle pattern, with two candles on either side of the middle one having higher lows. When a candle closes below the middle candle's low, that is an MSB.
When price returns to the MSB point, the Take Profit and Stop Loss levels will appear.
When price goes to either the Stop Loss or Take Profit level, the MSB, TP and SL, lines will be removed.
After this, if price creates a new setup in the opposite direction, the indicator will also work for this, as shown in this example that occurred right after the first example
SETTINGS:
- The "Swing Point strength" can be adjusted in the settings.
Example:
For a swing low:
The default setting is 1 (one candle on each side of a middle candle has a higher low).
You can change this setting to 2, for a 5 candle pattern (two candles on each side of the middle candle have higher lows).
This can be changed to a maximum of 10. But only 1 or 2 is recommended especially on the 5 minute chart.
- ATR Length and Triangle Distance Multiplier settings are for adjusting how the swing point symbols appear on the chart.
This is to ensure triangles are not drawn over candles when price gets volatile.
The default setting is ideal for almost all market conditions, but you can play around with it to adjust to your liking.
- Alerts.
For alerts to be triggered, they must first be selected in settings.
Then you need to go on to the chart and right-click on an element of the indicator (such as the swing point symbols) and select "add alert on PTT-LJS-v2".
If after this, you change any settings on the indicator such as session times or pre-London session, you must add the alert again, and delete the old one if you wish.

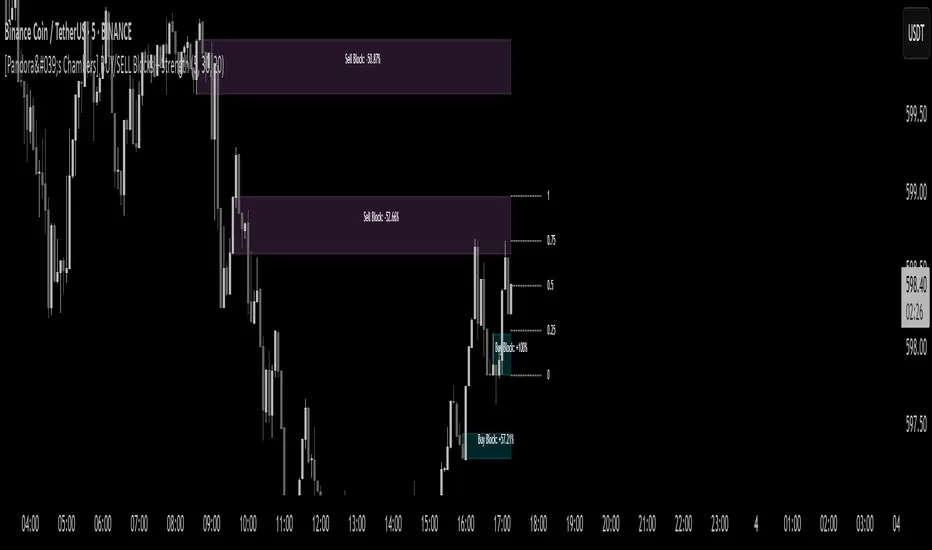
[Pandora's Chambers] BUY/SELL Blocks + Strength FCBased on the secret technique of ATTA,
Traditional price action analysis techniques, such as ICT (Inner Circle Trader), are often based on subjective interpretations and frequently miss the true structure of the market according to the Wyckoff method. The " BUY/SELL Blocks + Strength FC" indicator aims to correct this problem by automatically and accurately identifying buy/sell "blocks" according to Wyckoff principles, calculating volume strength, filtering breached blocks, and displaying precise support and resistance levels.
Indicator Highlights
Buy/Sell Blocks Identification
Uses the ta.pivothigh and ta.pivotlow functions to locate upper and lower pivot points, and draws a "box" between the two points to represent the block.
Each block is automatically extended to the right of the chart (can be disabled in settings) for a fixed number of bars or until the end of the chart.
Colors are configurable: turquoise shades for buy blocks, and purple for sell blocks.
Volume Strength Calculation and Update
In each candle, positive volume (in a rising market) or negative volume (in a falling market) is added to the relevant block.
Displays in percentages which side (buyers/sellers) controls the block: a label on the block shows +XX% or -XX%.
Changes the background color of the box to gray when the net volume flips (e.g., a strong sell block receives a net positive).
Filtering Breached Blocks
Option to automatically filter and remove blocks where the price has closed above the top of the sell block or below the bottom of the buy block, in order to maintain a clean and focused chart.
"Adjusted" Fibonacci Grid
In the last calculated bars, the indicator identifies the nearest high support level (sup) and the nearest low resistance level (res) among all existing blocks.
Based on sup and res, a Fibonacci grid of 0%, 25%, 50%, 75%, and 100% is constructed, automatically updating as the chart progresses.
What is so new here?
Accuracy according to Wyckoff and not personal interpretation: In the Wyckoff method, market oscillations are built on supply and demand balances in precise price gaps. Here, each block is built directly on pivots from a number of bars back, and not on feelings of an "area" as is sometimes done in ICT techniques.
Quantitative measurement of control: The indicator does not settle for a visual identification of a block but calculates for each block the buy volume versus the sell volume, and clearly displays who is in control.
Automatic filtering to maintain relevance: Breached blocks are removed, so only the strong areas that have not yet been closed remain.
Full integration with modern price action: Understanding price movement is measured here objectively, leaving no room for subjective interpretations of "structure breaks" or "diagonal waves" that standard tools do not support.
Why is the existing price action not enough?
Inconsistency in defining supply and demand zones: Many techniques rely on manual marking of "buy zones" only, without fixed criteria (number of bars back, low highs, volume, etc.).
Scarcity of quantitative indicators: Without calculating net volume, it is difficult to know if a particular block is truly supported by the power of buyers or sellers.
Net invalidation of blocks that have been violated: Repeated breaches of support and resistance areas below/above their boundaries confuse the trader, while here they are automatically removed.
The " BUY/SELL Blocks + Strength FC" indicator comes to correct all these shortcomings, and provides the user with an objective, accurate, and quantitative framework for understanding the dynamics of the market and identifying volume-based support and resistance areas, according to the principles of the Wyckoff method.